Temel İstatistikler
| Portföy Değeri | $ 455.438.330 |
| Mevcut Pozisyonlar | 180 |
Son Varlıklar, Performans, Yönetilen Varlıklar (13F, 13Dden itibaren)
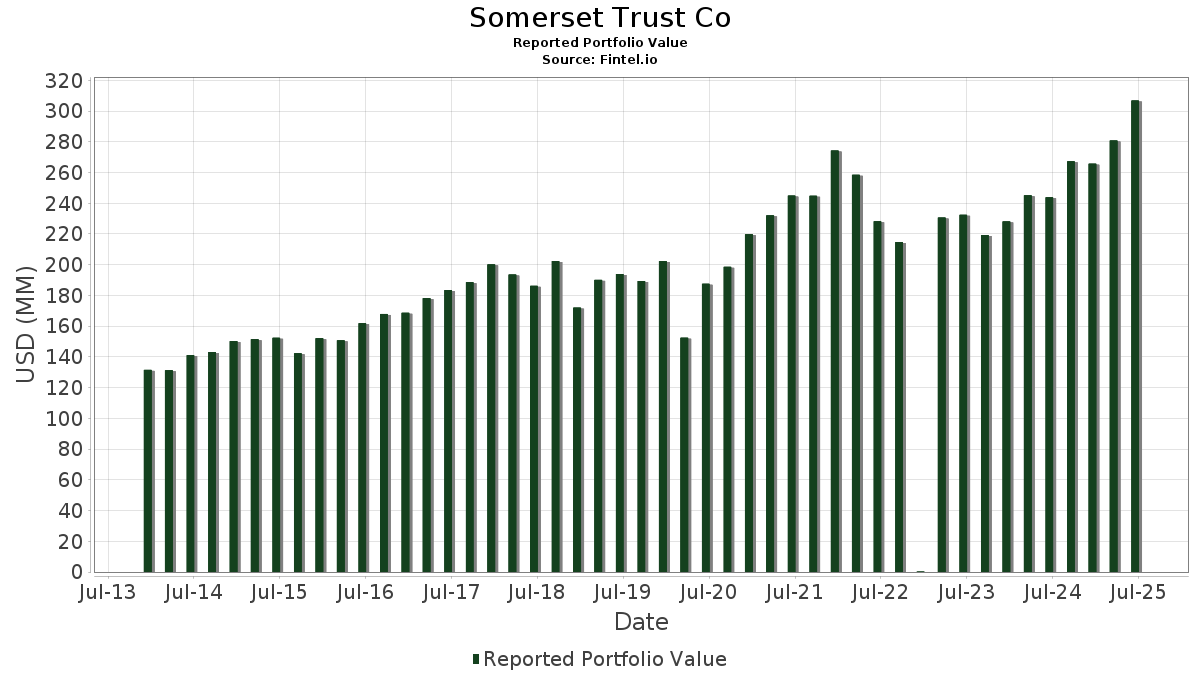
Somerset Trust Co, en son SEC dosyalarında toplam 180 varlığını açıkladı. En güncel portföy değeri 455.438.330 $ USD olarak hesaplanmıştır. Yönetilen Gerçek Varlıklar (AUM), bu değer artı nakittir (ki bu açıklanmamıştır). Somerset Trust Coın en büyük varlıkları: Microsoft Corporation (US:MSFT) , Apple Inc. (US:AAPL) , JPMorgan Chase & Co. (US:JPM) , Walmart Inc. (US:WMT) , and Lowe's Companies, Inc. (US:LOW) . Somerset Trust Coın yeni pozisyonları şunları içeriyor: iShares Trust - iShares Semiconductor ETF (US:SOXX) , Exchange Traded Concepts Trust - Range Nuclear Renaissance Index ETF (US:NUKZ) , Alphabet Inc. (US:GOOG) , Stride, Inc. (US:LRN) , and Vanguard International Equity Index Funds - Vanguard FTSE Emerging Markets ETF (US:VWO) .
Bu Çeyrekte En Yükselenler
Portföy dağıtımındaki değişikliği kullanıyoruz çünkü bu en anlamlı ölçümdür. Değişiklikler alım satımlardan veya hisse fiyatlarındaki değişikliklerden kaynaklanabilir.
| Menkul Kıymet | Hisseler (MM) |
Değer (MM$) |
Portföy % | ΔPortföy % |
|---|---|---|---|---|
| SOXX / iShares Trust - iShares Semiconductor ETF | 0,00 | 0,81 | 0,1784 | 0,1784 |
| NUKZ / Exchange Traded Concepts Trust - Range Nuclear Renaissance Index ETF | 0,01 | 0,68 | 0,1501 | 0,1501 |
| GOOG / Alphabet Inc. | 0,00 | 0,61 | 0,1337 | 0,1337 |
| GOOGL / Alphabet Inc. | 0,01 | 2,75 | 0,6047 | 0,1185 |
| BABA / Alibaba Group Holding Limited - Depositary Receipt (Common Stock) | 0,01 | 1,31 | 0,2885 | 0,0999 |
| LRN / Stride, Inc. | 0,00 | 0,42 | 0,0924 | 0,0924 |
| RSPG / Invesco Exchange-Traded Fund Trust - Invesco S&P 500 Equal Weight Energy ETF | 0,01 | 1,05 | 0,2310 | 0,0877 |
| WYNN / Wynn Resorts, Limited | 0,00 | 0,33 | 0,0719 | 0,0719 |
| VWO / Vanguard International Equity Index Funds - Vanguard FTSE Emerging Markets ETF | 0,01 | 0,31 | 0,0690 | 0,0690 |
| BITO / ProShares Trust - ProShares Bitcoin ETF | 0,02 | 0,31 | 0,0670 | 0,0670 |
Bu Çeyrekte En Düşenler
Portföy dağıtımdaki değişikliği kullanıyoruz çünkü bu en anlamlı ölçümdür. Değişiklikler alım satımlardan veya hisse fiyatlarındaki değişikliklerden kaynaklanabilir.
| Menkul Kıymet | Hisseler (MM) |
Değer (MM$) |
Portföy % | ΔPortföy % |
|---|---|---|---|---|
| MSFT / Microsoft Corporation | 0,03 | 17,27 | 3,7912 | -1,7097 |
| JPM / JPMorgan Chase & Co. | 0,03 | 10,79 | 2,3682 | -0,9026 |
| CSCO / Cisco Systems, Inc. | 0,11 | 7,49 | 1,6447 | -0,8301 |
| FDS / FactSet Research Systems Inc. | 0,01 | 2,52 | 0,5530 | -0,7157 |
| WMT / Walmart Inc. | 0,08 | 7,92 | 1,7399 | -0,6994 |
| ADP / Automatic Data Processing, Inc. | 0,02 | 5,67 | 1,2439 | -0,6933 |
| COST / Costco Wholesale Corporation | 0,01 | 5,33 | 1,1713 | -0,6893 |
| ADI / Analog Devices, Inc. | 0,03 | 6,66 | 1,4626 | -0,6426 |
| PAYX / Paychex, Inc. | 0,03 | 4,18 | 0,9175 | -0,6412 |
| ABT / Abbott Laboratories | 0,04 | 5,89 | 1,2936 | -0,6395 |
13F ve Fon Başvuruları
Bu form, raporlama dönemi 2025-10-14da, {1} tarihinde dosyalanmıştır. Tüm işlem geçmişini görmek için bağlantı simgesini tıklayınız.
Premium verilerin kilidini açmak ve Excele aktarmak için Yükseltme![]() .
.
| Menkul Kıymet | Tür | Ort. Hisse Fiyatı | Hisseler (MM) |
ΔHisseler (%) |
ΔHisseler (%) |
Değer (MM$) |
Portföy (%) |
ΔPortföy (%) |
|
|---|---|---|---|---|---|---|---|---|---|
| MSFT / Microsoft Corporation | 0,03 | -1,76 | 17,27 | 2,30 | 3,7912 | -1,7097 | |||
| AAPL / Apple Inc. | 0,05 | 0,15 | 13,97 | 24,30 | 3,0675 | -0,5956 | |||
| JPM / JPMorgan Chase & Co. | 0,03 | -1,22 | 10,79 | 7,47 | 2,3682 | -0,9026 | |||
| WMT / Walmart Inc. | 0,08 | 0,45 | 7,92 | 5,87 | 1,7399 | -0,6994 | |||
| LOW / Lowe's Companies, Inc. | 0,03 | 0,16 | 7,65 | 13,46 | 1,6804 | -0,5181 | |||
| CSCO / Cisco Systems, Inc. | 0,11 | 0,03 | 7,49 | -1,36 | 1,6447 | -0,8301 | |||
| JNJ / Johnson & Johnson | 0,04 | 0,76 | 7,20 | 22,30 | 1,5813 | -0,3377 | |||
| NEE / NextEra Energy, Inc. | 0,09 | 1,13 | 6,86 | 9,98 | 1,5057 | -0,5266 | |||
| ADI / Analog Devices, Inc. | 0,03 | -0,10 | 6,66 | 3,13 | 1,4626 | -0,6426 | |||
| RTX / RTX Corporation | 0,04 | 0,75 | 6,56 | 15,45 | 1,4405 | -0,4114 | |||
| FDN / First Trust Exchange-Traded Fund - First Trust Dow Jones Internet Index Fund | 0,02 | -0,95 | 6,53 | 2,91 | 1,4342 | -0,6344 | |||
| AFL / Aflac Incorporated | 0,05 | -0,57 | 6,05 | 5,31 | 1,3276 | -0,5435 | |||
| LHX / L3Harris Technologies, Inc. | 0,02 | 0,88 | 6,02 | 22,81 | 1,3217 | -0,2756 | |||
| ABT / Abbott Laboratories | 0,04 | 0,86 | 5,89 | -0,67 | 1,2936 | -0,6395 | |||
| AMGN / Amgen Inc. | 0,02 | 0,82 | 5,81 | 1,91 | 1,2759 | -0,5827 | |||
| AVGO / Broadcom Inc. | 0,02 | 1,61 | 5,75 | 21,60 | 1,2636 | -0,2786 | |||
| ADP / Automatic Data Processing, Inc. | 0,02 | 0,15 | 5,67 | -4,69 | 1,2439 | -0,6933 | |||
| MCD / McDonald's Corporation | 0,02 | -0,09 | 5,56 | 3,92 | 1,2214 | -0,5231 | |||
| BLK / BlackRock, Inc. | 0,00 | 0,00 | 5,42 | 11,11 | 1,1903 | -0,3998 | |||
| LIN / Linde plc | 0,01 | -0,31 | 5,35 | 0,92 | 1,1742 | -0,5526 | |||
| COST / Costco Wholesale Corporation | 0,01 | -0,07 | 5,33 | -6,55 | 1,1713 | -0,6893 | |||
| ITW / Illinois Tool Works Inc. | 0,02 | 0,68 | 5,28 | 6,19 | 1,1603 | -0,4617 | |||
| NSC / Norfolk Southern Corporation | 0,02 | 0,63 | 5,25 | 18,10 | 1,1520 | -0,2959 | |||
| GD / General Dynamics Corporation | 0,01 | -0,15 | 5,04 | 16,76 | 1,1060 | -0,3002 | |||
| META / Meta Platforms, Inc. | 0,01 | 0,83 | 4,71 | 0,32 | 1,0341 | -0,4958 | |||
| MDT / Medtronic plc | 0,05 | 0,86 | 4,69 | 10,20 | 1,0299 | -0,3573 | |||
| PAYX / Paychex, Inc. | 0,03 | 0,26 | 4,18 | -12,63 | 0,9175 | -0,6412 | |||
| WEC / WEC Energy Group, Inc. | 0,04 | 0,78 | 4,14 | 10,82 | 0,9085 | -0,3082 | |||
| CB / Chubb Limited | 0,01 | -0,01 | 4,06 | -2,59 | 0,8912 | -0,4667 | |||
| EMR / Emerson Electric Co. | 0,03 | 0,62 | 3,56 | -1,00 | 0,7807 | -0,3898 | |||
| APD / Air Products and Chemicals, Inc. | 0,01 | 1,03 | 3,54 | -2,32 | 0,7769 | -0,4036 | |||
| PG / The Procter & Gamble Company | 0,02 | 1,39 | 3,34 | -2,19 | 0,7338 | -0,3801 | |||
| ACN / Accenture plc | 0,01 | -0,43 | 3,30 | -17,85 | 0,7247 | -0,5847 | |||
| HD / The Home Depot, Inc. | 0,01 | -1,63 | 3,28 | 8,72 | 0,7200 | -0,2630 | |||
| CEG / Constellation Energy Corporation | 0,01 | 1,58 | 3,26 | 3,56 | 0,7149 | -0,3097 | |||
| BDX / Becton, Dickinson and Company | 0,02 | 1,44 | 3,12 | 10,22 | 0,6848 | -0,2374 | |||
| PEP / PepsiCo, Inc. | 0,02 | 0,24 | 3,00 | 6,60 | 0,6597 | -0,2587 | |||
| ES / Eversource Energy | 0,04 | 2,94 | 2,93 | 15,11 | 0,6424 | -0,1859 | |||
| PSX / Phillips 66 | 0,02 | 0,75 | 2,81 | 14,90 | 0,6164 | -0,1801 | |||
| GOOGL / Alphabet Inc. | 0,01 | 33,82 | 2,75 | 84,64 | 0,6047 | 0,1185 | |||
| MS / Morgan Stanley | 0,02 | 0,99 | 2,62 | 13,99 | 0,5745 | -0,1737 | |||
| FDS / FactSet Research Systems Inc. | 0,01 | 1,01 | 2,52 | -35,30 | 0,5530 | -0,7157 | |||
| CVX / Chevron Corporation | 0,02 | 1,32 | 2,37 | 9,87 | 0,5205 | -0,1826 | |||
| COF / Capital One Financial Corporation | 0,01 | -1,66 | 2,30 | -1,75 | 0,5054 | -0,2581 | |||
| TSLA / Tesla, Inc. | 0,01 | 8,30 | 2,25 | 51,58 | 0,4944 | 0,0104 | |||
| ROST / Ross Stores, Inc. | 0,01 | -1,57 | 2,25 | 17,60 | 0,4930 | -0,1294 | |||
| CL / Colgate-Palmolive Company | 0,03 | 1,29 | 2,15 | -10,89 | 0,4725 | -0,3148 | |||
| CMCSA / Comcast Corporation | 0,06 | 0,22 | 1,98 | -11,79 | 0,4339 | -0,2960 | |||
| CLX / The Clorox Company | 0,02 | 0,86 | 1,94 | 3,58 | 0,4259 | -0,1845 | |||
| TSM / Taiwan Semiconductor Manufacturing Company Limited - Depositary Receipt (Common Stock) | 0,01 | 3,18 | 1,91 | 27,30 | 0,4198 | -0,0699 | |||
| DY / Dycom Industries, Inc. | 0,01 | 6,17 | 1,88 | 26,76 | 0,4121 | -0,0705 | |||
| JEPI / J.P. Morgan Exchange-Traded Fund Trust - JPMorgan Equity Premium Income ETF | 0,03 | -0,39 | 1,84 | 0,05 | 0,4030 | -0,1949 | |||
| NVDD / Direxion Shares ETF Trust - Direxion Daily NVDA Bear 1X Shares | 0,01 | 24,37 | 1,81 | 46,88 | 0,3977 | -0,0042 | |||
| DGX / Quest Diagnostics Incorporated | 0,01 | -1,62 | 1,73 | 4,34 | 0,3800 | -0,1604 | |||
| T / AT&T Inc. | 0,06 | 1,97 | 1,69 | -0,53 | 0,3710 | -0,1824 | |||
| NKE / NIKE, Inc. | 0,02 | 2,03 | 1,67 | 0,18 | 0,3668 | -0,1768 | |||
| PFF / iShares Trust - iShares Preferred and Income Securities ETF | 0,05 | 0,87 | 1,54 | 3,99 | 0,3373 | -0,1443 | |||
| MU / Micron Technology, Inc. | 0,01 | 1,39 | 1,51 | 37,69 | 0,3305 | -0,0259 | |||
| USB / U.S. Bancorp | 0,03 | 2,02 | 1,49 | 8,98 | 0,3276 | -0,1187 | |||
| C / Citigroup Inc. | 0,01 | -1,75 | 1,48 | 17,22 | 0,3244 | -0,0866 | |||
| MET / MetLife, Inc. | 0,02 | -2,40 | 1,39 | 0,00 | 0,3050 | -0,1479 | |||
| ITOT / iShares Trust - iShares Core S&P Total U.S. Stock Market ETF | 0,01 | 0,00 | 1,37 | 7,81 | 0,3001 | -0,1129 | |||
| BABA / Alibaba Group Holding Limited - Depositary Receipt (Common Stock) | 0,01 | 44,11 | 1,31 | 127,16 | 0,2885 | 0,0999 | |||
| AMT / American Tower Corporation | 0,01 | -2,24 | 1,12 | -14,94 | 0,2464 | -0,1836 | |||
| RSPG / Invesco Exchange-Traded Fund Trust - Invesco S&P 500 Equal Weight Energy ETF | 0,01 | 123,79 | 1,05 | 139,64 | 0,2310 | 0,0877 | |||
| ABBV / AbbVie Inc. | 0,00 | 0,67 | 0,90 | 25,66 | 0,1979 | -0,0360 | |||
| GILD / Gilead Sciences, Inc. | 0,01 | -1,73 | 0,84 | -1,64 | 0,1844 | -0,0938 | |||
| LDOS / Leidos Holdings, Inc. | 0,00 | 14,36 | 0,82 | 36,94 | 0,1808 | -0,0151 | |||
| SOXX / iShares Trust - iShares Semiconductor ETF | 0,00 | 0,81 | 0,1784 | 0,1784 | |||||
| PNR / Pentair plc | 0,01 | -2,73 | 0,81 | 4,92 | 0,1782 | -0,0738 | |||
| VZ / Verizon Communications Inc. | 0,02 | -2,38 | 0,80 | -0,86 | 0,1764 | -0,0877 | |||
| PKG / Packaging Corporation of America | 0,00 | 0,71 | 0,77 | 16,62 | 0,1695 | -0,0465 | |||
| IVV / iShares Trust - iShares Core S&P 500 ETF | 0,00 | -0,61 | 0,76 | 7,15 | 0,1678 | -0,0647 | |||
| FANG / Diamondback Energy, Inc. | 0,01 | -12,27 | 0,76 | -8,63 | 0,1673 | -0,1045 | |||
| VMC / Vulcan Materials Company | 0,00 | 3,26 | 0,75 | 21,79 | 0,1647 | -0,0360 | |||
| IJH / iShares Trust - iShares Core S&P Mid-Cap ETF | 0,01 | 0,00 | 0,74 | 5,29 | 0,1617 | -0,0664 | |||
| PSCT / Invesco Exchange-Traded Fund Trust II - Invesco S&P SmallCap Information Technology ETF | 0,01 | 0,00 | 0,71 | 14,81 | 0,1567 | -0,0459 | |||
| HEWJ / iShares Trust - iShares Currency Hedged MSCI Japan ETF | 0,01 | -1,65 | 0,70 | 8,15 | 0,1544 | -0,0574 | |||
| MRK / Merck & Co., Inc. | 0,01 | -22,03 | 0,69 | -17,32 | 0,1520 | -0,1209 | |||
| NUKZ / Exchange Traded Concepts Trust - Range Nuclear Renaissance Index ETF | 0,01 | 0,68 | 0,1501 | 0,1501 | |||||
| ACM / AECOM | 0,01 | 0,22 | 0,66 | 15,88 | 0,1459 | -0,0410 | |||
| MA / Mastercard Incorporated | 0,00 | 0,09 | 0,66 | 1,22 | 0,1457 | -0,0678 | |||
| LRCX / Lam Research Corporation | 0,00 | 0,60 | 0,65 | 38,54 | 0,1422 | -0,0103 | |||
| GWRE / Guidewire Software, Inc. | 0,00 | 19,70 | 0,64 | 16,82 | 0,1405 | -0,0379 | |||
| AJG / Arthur J. Gallagher & Co. | 0,00 | 0,00 | 0,63 | -3,24 | 0,1378 | -0,0736 | |||
| GOOG / Alphabet Inc. | 0,00 | 0,61 | 0,1337 | 0,1337 | |||||
| HUBB / Hubbell Incorporated | 0,00 | 0,00 | 0,61 | 5,37 | 0,1336 | -0,0546 | |||
| RBC / RBC Bearings Incorporated | 0,00 | 8,84 | 0,61 | 10,40 | 0,1330 | -0,0458 | |||
| GLD / SPDR Gold Trust | 0,00 | 20,83 | 0,60 | 40,98 | 0,1322 | -0,0071 | |||
| IJR / iShares Trust - iShares Core S&P Small-Cap ETF | 0,01 | 0,00 | 0,60 | 8,88 | 0,1320 | -0,0482 | |||
| CI / The Cigna Group | 0,00 | -2,88 | 0,59 | -15,29 | 0,1303 | -0,0981 | |||
| IRM / Iron Mountain Incorporated | 0,01 | 1,12 | 0,59 | 0,51 | 0,1295 | -0,0618 | |||
| SPYG / SPDR Series Trust - SPDR Portfolio S&P 500 Growth ETF | 0,01 | -3,15 | 0,58 | 6,18 | 0,1284 | -0,0511 | |||
| HSY / The Hershey Company | 0,00 | -14,11 | 0,58 | -3,15 | 0,1283 | -0,0684 | |||
| SONY / Sony Group Corporation - Depositary Receipt (Common Stock) | 0,02 | 4,99 | 0,58 | 16,23 | 0,1274 | -0,0354 | |||
| XAR / SPDR Series Trust - SPDR S&P Aerospace & Defense ETF | 0,00 | 3,90 | 0,58 | 15,66 | 0,1265 | -0,0358 | |||
| FIVE / Five Below, Inc. | 0,00 | 0,00 | 0,58 | 17,83 | 0,1265 | -0,0327 | |||
| BLBD / Blue Bird Corporation | 0,01 | 16,01 | 0,56 | 54,95 | 0,1239 | 0,0050 | |||
| EPD / Enterprise Products Partners L.P. - Limited Partnership | 0,02 | 0,00 | 0,56 | 0,72 | 0,1238 | -0,0584 | |||
| CHWY / Chewy, Inc. | 0,01 | 0,86 | 0,55 | -4,37 | 0,1203 | -0,0662 | |||
| SHOP / Shopify Inc. | 0,00 | 0,44 | 0,54 | 29,36 | 0,1192 | -0,0175 | |||
| NTR / Nutrien Ltd. | 0,01 | -1,69 | 0,54 | -0,92 | 0,1185 | -0,0590 | |||
| SBUX / Starbucks Corporation | 0,01 | 0,38 | 0,53 | -7,34 | 0,1164 | -0,0700 | |||
| AMAT / Applied Materials, Inc. | 0,00 | 0,71 | 0,53 | 12,63 | 0,1155 | -0,0367 | |||
| CRM / Salesforce, Inc. | 0,00 | 85,45 | 0,52 | 61,18 | 0,1141 | 0,0090 | |||
| NEM / Newmont Corporation | 0,01 | 6,02 | 0,52 | 53,41 | 0,1137 | 0,0037 | |||
| CBOE / Cboe Global Markets, Inc. | 0,00 | -1,59 | 0,52 | 3,61 | 0,1133 | -0,0492 | |||
| DHI / D.R. Horton, Inc. | 0,00 | -1,20 | 0,50 | 29,87 | 0,1098 | -0,0157 | |||
| AMP / Ameriprise Financial, Inc. | 0,00 | 1,00 | 0,50 | -6,95 | 0,1087 | -0,0649 | |||
| THC / Tenet Healthcare Corporation | 0,00 | 2,06 | 0,49 | 17,94 | 0,1083 | -0,0282 | |||
| LLY / Eli Lilly and Company | 0,00 | 0,00 | 0,49 | -2,21 | 0,1071 | -0,0553 | |||
| ADBE / Adobe Inc. | 0,00 | -14,85 | 0,49 | -22,33 | 0,1070 | -0,0976 | |||
| AMZN / Amazon.com, Inc. | 0,00 | 0,00 | 0,47 | 0,21 | 0,1030 | -0,0498 | |||
| RDDT / Reddit, Inc. | 0,00 | -60,00 | 0,46 | -38,96 | 0,1010 | -0,1444 | |||
| SIGI / Selective Insurance Group, Inc. | 0,01 | 0,00 | 0,46 | -6,33 | 0,1008 | -0,0591 | |||
| SYM / Symbotic Inc. | 0,01 | -8,38 | 0,46 | 27,30 | 0,1003 | -0,0168 | |||
| CRUS / Cirrus Logic, Inc. | 0,00 | 8,17 | 0,45 | 30,03 | 0,0980 | -0,0139 | |||
| MO / Altria Group, Inc. | 0,01 | 0,76 | 0,44 | 13,44 | 0,0965 | -0,0297 | |||
| EQT / EQT Corporation | 0,01 | 8,64 | 0,44 | 1,40 | 0,0957 | -0,0444 | |||
| TKO / TKO Group Holdings, Inc. | 0,00 | 2,52 | 0,44 | 13,87 | 0,0956 | -0,0291 | |||
| WCN / Waste Connections, Inc. | 0,00 | 18,70 | 0,43 | 11,75 | 0,0941 | -0,0309 | |||
| LRN / Stride, Inc. | 0,00 | 0,42 | 0,0924 | 0,0924 | |||||
| SPYV / SPDR Series Trust - SPDR Portfolio S&P 500 Value ETF | 0,01 | -3,12 | 0,41 | 2,48 | 0,0909 | -0,0409 | |||
| CSGS / CSG Systems International, Inc. | 0,01 | 12,43 | 0,41 | 10,81 | 0,0902 | -0,0306 | |||
| KEYS / Keysight Technologies, Inc. | 0,00 | -1,64 | 0,41 | 5,13 | 0,0901 | -0,0373 | |||
| DIS / The Walt Disney Company | 0,00 | 0,14 | 0,40 | -7,60 | 0,0882 | -0,0534 | |||
| GNRC / Generac Holdings Inc. | 0,00 | 0,39 | 0,38 | 17,48 | 0,0842 | -0,0223 | |||
| TEL / TE Connectivity plc | 0,00 | 0,72 | 0,37 | 31,32 | 0,0811 | -0,0107 | |||
| TRV / The Travelers Companies, Inc. | 0,00 | 0,08 | 0,37 | 4,57 | 0,0804 | -0,0339 | |||
| CVS / CVS Health Corporation | 0,00 | 16,19 | 0,36 | 27,27 | 0,0800 | -0,0135 | |||
| BRK.B / Berkshire Hathaway Inc. | 0,00 | -3,34 | 0,36 | 0,00 | 0,0799 | -0,0387 | |||
| BRO / Brown & Brown, Inc. | 0,00 | -1,60 | 0,36 | -16,74 | 0,0787 | -0,0616 | |||
| ETB / Eaton Vance Tax-Managed Buy-Write Income Fund | 0,02 | 0,00 | 0,35 | 3,85 | 0,0772 | -0,0331 | |||
| BAH / Booz Allen Hamilton Holding Corporation | 0,00 | -0,98 | 0,33 | -4,87 | 0,0729 | -0,0410 | |||
| WYNN / Wynn Resorts, Limited | 0,00 | 0,33 | 0,0719 | 0,0719 | |||||
| FCF / First Commonwealth Financial Corporation | 0,02 | 8,23 | 0,32 | 14,08 | 0,0694 | -0,0212 | |||
| VWO / Vanguard International Equity Index Funds - Vanguard FTSE Emerging Markets ETF | 0,01 | 0,31 | 0,0690 | 0,0690 | |||||
| PSCH / Invesco Exchange-Traded Fund Trust II - Invesco S&P SmallCap Health Care ETF | 0,01 | -3,37 | 0,31 | 0,32 | 0,0688 | -0,0330 | |||
| WRB / W. R. Berkley Corporation | 0,00 | -1,61 | 0,31 | 2,67 | 0,0676 | -0,0302 | |||
| APPF / AppFolio, Inc. | 0,00 | 0,90 | 0,31 | 20,87 | 0,0675 | -0,0154 | |||
| BITO / ProShares Trust - ProShares Bitcoin ETF | 0,02 | 0,31 | 0,0670 | 0,0670 | |||||
| FDX / FedEx Corporation | 0,00 | -17,08 | 0,30 | -14,12 | 0,0656 | -0,0476 | |||
| ROL / Rollins, Inc. | 0,01 | -1,80 | 0,30 | 2,41 | 0,0655 | -0,0296 | |||
| HON / Honeywell International Inc. | 0,00 | 0,93 | 0,30 | -8,92 | 0,0652 | -0,0409 | |||
| RLI / RLI Corp. | 0,00 | -1,65 | 0,30 | -11,14 | 0,0649 | -0,0435 | |||
| CHKP / Check Point Software Technologies Ltd. | 0,00 | -4,71 | 0,29 | -10,67 | 0,0644 | -0,0428 | |||
| TMO / Thermo Fisher Scientific Inc. | 0,00 | -27,21 | 0,29 | -13,13 | 0,0641 | -0,0452 | |||
| ICLR / ICON Public Limited Company | 0,00 | -6,88 | 0,29 | 12,06 | 0,0634 | -0,0206 | |||
| UNP / Union Pacific Corporation | 0,00 | 0,08 | 0,29 | 2,86 | 0,0633 | -0,0281 | |||
| GGG / Graco Inc. | 0,00 | 0,00 | 0,29 | -1,04 | 0,0627 | -0,0315 | |||
| O / Realty Income Corporation | 0,00 | 0,02 | 0,28 | 5,73 | 0,0609 | -0,0248 | |||
| CHD / Church & Dwight Co., Inc. | 0,00 | -1,13 | 0,28 | -9,80 | 0,0606 | -0,0392 | |||
| MGM / MGM Resorts International | 0,01 | -0,98 | 0,28 | -0,36 | 0,0605 | -0,0295 | |||
| MLPX / Global X Funds - Global X MLP & Energy Infrastructure ETF | 0,00 | 1,95 | 0,28 | 2,23 | 0,0605 | -0,0275 | |||
| INFY / Infosys Limited - Depositary Receipt (Common Stock) | 0,02 | -15,65 | 0,27 | -25,96 | 0,0596 | -0,0599 | |||
| EGP / EastGroup Properties, Inc. | 0,00 | 0,00 | 0,27 | 1,14 | 0,0588 | -0,0274 | |||
| V / Visa Inc. | 0,00 | 0,00 | 0,27 | -3,96 | 0,0587 | -0,0319 | |||
| IBM / International Business Machines Corporation | 0,00 | 11,98 | 0,26 | 6,91 | 0,0579 | -0,0223 | |||
| GSCE / GS Connect S&P GSCI Enhanced Commodity Total Return ETN | 0,00 | 0,00 | 0,26 | 12,17 | 0,0568 | -0,0181 | |||
| DECK / Deckers Outdoor Corporation | 0,00 | -5,95 | 0,26 | -7,25 | 0,0562 | -0,0340 | |||
| MPLX / MPLX LP - Limited Partnership | 0,01 | 0,00 | 0,26 | -3,04 | 0,0562 | -0,0298 | |||
| CHE / Chemed Corporation | 0,00 | -21,89 | 0,25 | -28,20 | 0,0544 | -0,0580 | |||
| TYL / Tyler Technologies, Inc. | 0,00 | -28,48 | 0,25 | -37,08 | 0,0542 | -0,0733 | |||
| STAG / STAG Industrial, Inc. | 0,01 | -1,46 | 0,25 | -4,30 | 0,0540 | -0,0296 | |||
| RPM / RPM International Inc. | 0,00 | -1,21 | 0,24 | 6,17 | 0,0530 | -0,0212 | |||
| D / Dominion Energy, Inc. | 0,00 | 0,82 | 0,24 | 9,09 | 0,0529 | -0,0190 | |||
| IEFA / iShares Trust - iShares Core MSCI EAFE ETF | 0,00 | 0,00 | 0,24 | 4,35 | 0,0528 | -0,0221 | |||
| ORCL / Oracle Corporation | 0,00 | 0,24 | 0,0519 | 0,0519 | |||||
| XOM / Exxon Mobil Corporation | 0,00 | 10,59 | 0,24 | 15,76 | 0,0517 | -0,0146 | |||
| THG / The Hanover Insurance Group, Inc. | 0,00 | 1,66 | 0,23 | 8,88 | 0,0513 | -0,0187 | |||
| LH / Labcorp Holdings Inc. | 0,00 | 1,25 | 0,23 | 10,95 | 0,0512 | -0,0174 | |||
| CSX / CSX Corporation | 0,01 | 0,57 | 0,23 | 9,66 | 0,0499 | -0,0178 | |||
| AXP / American Express Company | 0,00 | 0,00 | 0,23 | 4,15 | 0,0497 | -0,0211 | |||
| EG / Everest Group, Ltd. | 0,00 | -25,31 | 0,21 | -23,08 | 0,0463 | -0,0430 | |||
| MDYG / SPDR Series Trust - SPDR S&P 400 Mid Cap Growth ETF | 0,00 | -1,21 | 0,21 | 4,00 | 0,0459 | -0,0195 | |||
| MCHP / Microchip Technology Incorporated | 0,00 | 1,42 | 0,21 | -7,62 | 0,0453 | -0,0274 | |||
| FNB / F.N.B. Corporation | 0,01 | 0,00 | 0,21 | 10,75 | 0,0453 | -0,0155 | |||
| MDYV / SPDR Series Trust - SPDR S&P 400 Mid Cap Value ETF | 0,00 | 0,20 | 0,0450 | 0,0450 | |||||
| VSH / Vishay Intertechnology, Inc. | 0,01 | -21,40 | 0,20 | -24,12 | 0,0428 | -0,0411 | |||
| CTO / CTO Realty Growth, Inc. | 0,01 | -13,27 | 0,17 | -17,92 | 0,0382 | -0,0310 | |||
| UNH / UnitedHealth Group Incorporated | 0,00 | -100,00 | 0,00 | 0,0000 | |||||
| UPS / United Parcel Service, Inc. | 0,00 | -100,00 | 0,00 | 0,0000 | |||||
| CTAS / Cintas Corporation | 0,00 | -100,00 | 0,00 | 0,0000 | |||||
| CNC / Centene Corporation | 0,00 | -100,00 | 0,00 | 0,0000 | |||||
| POST / Post Holdings, Inc. | 0,00 | -100,00 | 0,00 | 0,0000 | |||||
| PFE / Pfizer Inc. | 0,00 | -100,00 | 0,00 | 0,0000 | |||||
| TGT / Target Corporation | 0,00 | -100,00 | 0,00 | 0,0000 | |||||
| DAL / Delta Air Lines, Inc. | 0,00 | -100,00 | 0,00 | 0,0000 | |||||
| BJRI / BJ's Restaurants, Inc. | 0,00 | -100,00 | 0,00 | 0,0000 | |||||
| VHT / Vanguard World Fund - Vanguard Health Care ETF | 0,00 | -100,00 | 0,00 | 0,0000 | |||||
| PTEN / Patterson-UTI Energy, Inc. | 0,00 | -100,00 | 0,00 | 0,0000 | |||||
| AIG / American International Group, Inc. | 0,00 | -100,00 | 0,00 | 0,0000 |