Temel İstatistikler
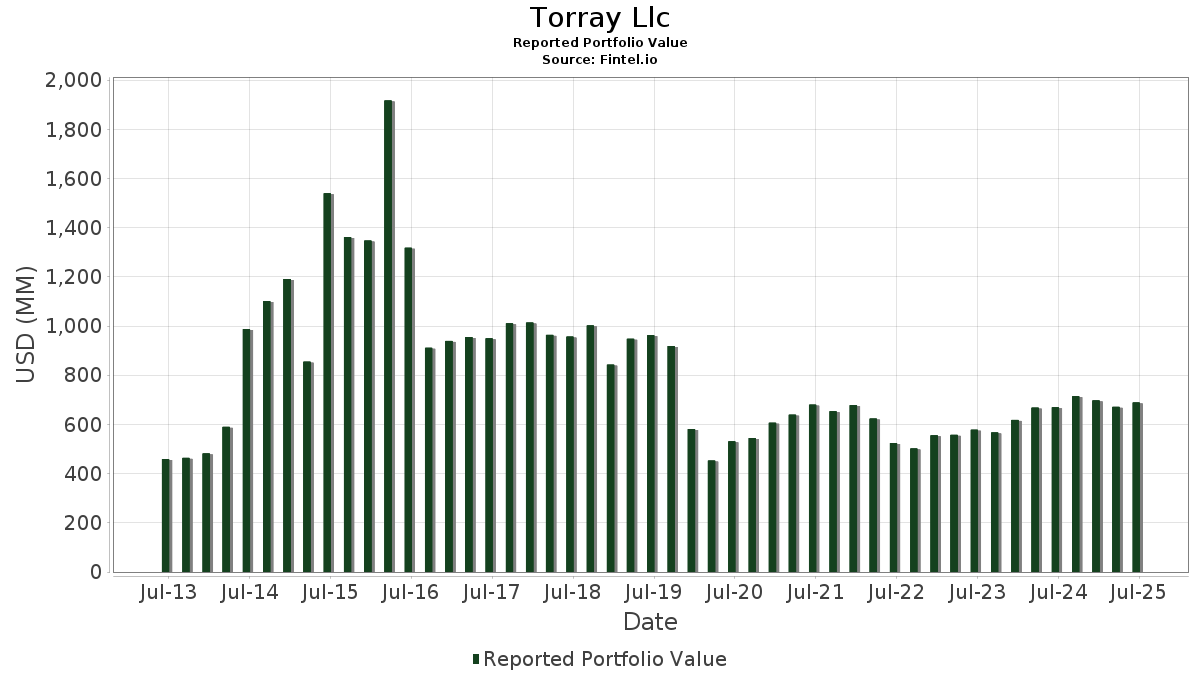
| Portföy Değeri | $ 698.380.614 |
| Mevcut Pozisyonlar | 95 |
Son Varlıklar, Performans, Yönetilen Varlıklar (13F, 13Dden itibaren)
Torray Llc, en son SEC dosyalarında toplam 95 varlığını açıkladı. En güncel portföy değeri 698.380.614 $ USD olarak hesaplanmıştır. Yönetilen Gerçek Varlıklar (AUM), bu değer artı nakittir (ki bu açıklanmamıştır). Torray Llcın en büyük varlıkları: Broadcom Inc. (US:AVGO) , Royalty Pharma plc (US:RPRX) , Phillips 66 (US:PSX) , Hewlett Packard Enterprise Company - Preferred Security (US:HPE.PRC) , and Texas Instruments Incorporated (US:TXN) . Torray Llcın yeni pozisyonları şunları içeriyor: KKR & Co. Inc. - Preferred Stock (US:KKR.PRD) , ONEOK, Inc. (US:OKE) , Intuit Inc. (US:INTU) , Syndax Pharmaceuticals, Inc. (US:SNDX) , and Verastem, Inc. (US:VSTM) .
Bu Çeyrekte En Yükselenler
Portföy dağıtımındaki değişikliği kullanıyoruz çünkü bu en anlamlı ölçümdür. Değişiklikler alım satımlardan veya hisse fiyatlarındaki değişikliklerden kaynaklanabilir.
| Menkul Kıymet | Hisseler (MM) |
Değer (MM$) |
Portföy % | ΔPortföy % |
|---|---|---|---|---|
| KKR.PRD / KKR & Co. Inc. - Preferred Stock | 0,41 | 21,48 | 3,0761 | 3,0761 |
| OKE / ONEOK, Inc. | 0,26 | 19,11 | 2,7361 | 2,7361 |
| INTU / Intuit Inc. | 0,02 | 14,33 | 2,0521 | 2,0521 |
| TW / Tradeweb Markets Inc. | 0,07 | 7,75 | 1,1093 | 0,8742 |
| RPRX / Royalty Pharma plc | 0,74 | 28,76 | 4,1184 | 0,7538 |
| MMC / Marsh & McLennan Companies, Inc. | 0,10 | 18,12 | 2,5947 | 0,6803 |
| TXN / Texas Instruments Incorporated | 0,14 | 24,31 | 3,4805 | 0,6307 |
| PLD / Prologis, Inc. | 0,16 | 20,01 | 2,8654 | 0,5341 |
| GOOG / Alphabet Inc. | 0,05 | 14,80 | 2,1189 | 0,4610 |
| PEP / PepsiCo, Inc. | 0,14 | 19,47 | 2,7882 | 0,4516 |
Bu Çeyrekte En Düşenler
Portföy dağıtımdaki değişikliği kullanıyoruz çünkü bu en anlamlı ölçümdür. Değişiklikler alım satımlardan veya hisse fiyatlarındaki değişikliklerden kaynaklanabilir.
| Menkul Kıymet | Hisseler (MM) |
Değer (MM$) |
Portföy % | ΔPortföy % |
|---|---|---|---|---|
| HD / The Home Depot, Inc. | 0,00 | 1,43 | 0,2051 | -2,9843 |
| EOG / EOG Resources, Inc. | 0,00 | 0,00 | -2,3239 | |
| EQIX / Equinix, Inc. | 0,00 | 0,00 | -2,2337 | |
| LENB / Lennar Corp. - Class B | 0,00 | 0,00 | -2,2039 | |
| ETN / Eaton Corporation plc | 0,00 | 0,00 | -1,4802 | |
| BRK.B / Berkshire Hathaway Inc. | 0,00 | 1,45 | 0,2076 | -1,4721 |
| AXP / American Express Company | 0,02 | 8,98 | 1,2859 | -1,3122 |
| XPRO / Expro Group Holdings N.V. | 0,00 | 0,00 | -0,7970 | |
| SPNS / Sapiens International Corporation N.V. | 0,00 | 0,00 | -0,3410 | |
| VEEV / Veeva Systems Inc. | 0,02 | 4,72 | 0,6755 | -0,2091 |
13F ve Fon Başvuruları
Bu form, raporlama dönemi 2026-01-28da, {1} tarihinde dosyalanmıştır. Tüm işlem geçmişini görmek için bağlantı simgesini tıklayınız.
Premium verilerin kilidini açmak ve Excele aktarmak için Yükseltme![]() .
.
| Menkul Kıymet | Tür | Ort. Hisse Fiyatı | Hisseler (MM) |
ΔHisseler (%) |
Değer (MM$) |
ΔDeğer (%) |
Portföy (%) |
ΔPortföy (%) |
|
|---|---|---|---|---|---|---|---|---|---|
| AVGO / Broadcom Inc. | 0,09 | -3,37 | 31,54 | 1,38 | 4,5165 | 0,2949 | |||
| RPRX / Royalty Pharma plc | 0,74 | 5,90 | 28,76 | 15,99 | 4,1184 | 0,7538 | |||
| PSX / Phillips 66 | 0,21 | -1,08 | 26,66 | -6,15 | 3,8173 | -0,0371 | |||
| HPE.PRC / Hewlett Packard Enterprise Company - Preferred Security | 0,37 | 4,13 | 24,96 | 2,27 | 3,5733 | 0,2627 | |||
| TXN / Texas Instruments Incorporated | 0,14 | 22,56 | 24,31 | 15,73 | 3,4805 | 0,6307 | |||
| CNA / CNA Financial Corporation | 0,49 | -1,83 | 23,56 | 0,87 | 3,3728 | 0,2045 | |||
| CVX / Chevron Corporation | 0,14 | 10,44 | 22,02 | 8,39 | 3,1523 | 0,3965 | |||
| BX / Blackstone Inc. | 0,14 | 1,81 | 21,51 | -8,14 | 3,0800 | -0,0972 | |||
| KKR.PRD / KKR & Co. Inc. - Preferred Stock | 0,41 | 21,48 | 3,0761 | 3,0761 | |||||
| ABBV / AbbVie Inc. | 0,09 | -8,80 | 21,18 | -10,00 | 3,0325 | -0,1604 | |||
| AMGN / Amgen Inc. | 0,06 | -10,87 | 21,16 | 3,38 | 3,0298 | 0,2527 | |||
| PLD / Prologis, Inc. | 0,16 | 4,48 | 20,01 | 16,46 | 2,8654 | 0,5341 | |||
| PFE / Pfizer Inc. | 0,80 | 6,72 | 20,01 | 4,28 | 2,8650 | 0,2618 | |||
| UNH / UnitedHealth Group Incorporated | 0,06 | 3,58 | 19,53 | -0,97 | 2,7960 | 0,1206 | |||
| PEP / PepsiCo, Inc. | 0,14 | 10,64 | 19,47 | 13,07 | 2,7882 | 0,4516 | |||
| OKE / ONEOK, Inc. | 0,26 | 19,11 | 2,7361 | 2,7361 | |||||
| NEE / NextEra Energy, Inc. | 0,24 | -1,43 | 18,87 | 4,82 | 2,7017 | 0,2595 | |||
| MMC / Marsh & McLennan Companies, Inc. | 0,10 | 39,51 | 18,12 | 28,43 | 2,5947 | 0,6803 | |||
| AMZN / Amazon.com, Inc. | 0,07 | -3,45 | 16,72 | 1,50 | 2,3935 | 0,1590 | |||
| MSFT / Microsoft Corporation | 0,03 | -4,42 | 16,42 | -10,75 | 2,3517 | -0,1452 | |||
| GOOG / Alphabet Inc. | 0,05 | -5,94 | 14,80 | 21,11 | 2,1189 | 0,4610 | |||
| INTU / Intuit Inc. | 0,02 | 14,33 | 2,0521 | 2,0521 | |||||
| AAPL / Apple Inc. | 0,05 | -6,27 | 13,61 | 0,07 | 1,9487 | 0,1035 | |||
| JPM / JPMorgan Chase & Co. | 0,04 | 0,00 | 12,52 | 2,15 | 1,7929 | 0,1298 | |||
| CASY / Casey's General Stores, Inc. | 0,02 | -3,10 | 9,57 | -5,26 | 1,3699 | -0,0003 | |||
| AXP / American Express Company | 0,02 | -57,89 | 8,98 | -53,10 | 1,2859 | -1,3122 | |||
| APH / Amphenol Corporation | 0,06 | -21,54 | 8,66 | -14,32 | 1,2404 | -0,1314 | |||
| TSM / Taiwan Semiconductor Manufacturing Company Limited - Depositary Receipt (Common Stock) | 0,03 | -2,48 | 8,20 | 6,11 | 1,1737 | 0,1256 | |||
| KLAC / KLA Corporation | 0,01 | -6,56 | 8,01 | 5,27 | 1,1476 | 0,1145 | |||
| TW / Tradeweb Markets Inc. | 0,07 | 361,36 | 7,75 | 347,29 | 1,1093 | 0,8742 | |||
| VRTX / Vertex Pharmaceuticals Incorporated | 0,02 | -4,85 | 7,01 | 10,13 | 1,0040 | 0,1402 | |||
| V / Visa Inc. | 0,02 | -2,42 | 6,89 | 0,25 | 0,9859 | 0,0540 | |||
| CEG / Constellation Energy Corporation | 0,02 | -1,50 | 6,73 | 5,74 | 0,9636 | 0,1001 | |||
| CPRT / Copart, Inc. | 0,16 | 12,29 | 6,26 | -2,23 | 0,8959 | 0,0275 | |||
| LZAGY / Lonza Group AG - Depositary Receipt (Common Stock) | 0,09 | -4,30 | 6,24 | -3,51 | 0,8940 | 0,0161 | |||
| NOW / ServiceNow, Inc. | 0,04 | 390,45 | 6,22 | -18,37 | 0,8912 | -0,1432 | |||
| AJG / Arthur J. Gallagher & Co. | 0,02 | -4,95 | 6,00 | -20,59 | 0,8590 | -0,1659 | |||
| ORLY / O'Reilly Automotive, Inc. | 0,06 | -5,12 | 5,73 | -19,73 | 0,8211 | -0,1481 | |||
| MS / Morgan Stanley | 0,03 | -21,63 | 5,53 | -12,48 | 0,7915 | -0,0654 | |||
| ADBE / Adobe Inc. | 0,01 | -9,05 | 5,21 | -9,75 | 0,7463 | -0,0374 | |||
| CNSWF / Constellation Software Inc. | 0,00 | -6,60 | 5,14 | -17,22 | 0,7357 | -0,1064 | |||
| VEEV / Veeva Systems Inc. | 0,02 | -3,43 | 4,72 | -27,64 | 0,6755 | -0,2091 | |||
| TYL / Tyler Technologies, Inc. | 0,01 | -3,03 | 4,27 | -15,86 | 0,6109 | -0,0771 | |||
| RBC / RBC Bearings Incorporated | 0,01 | 5,52 | 4,10 | 21,24 | 0,5868 | 0,1282 | |||
| VRSK / Verisk Analytics, Inc. | 0,02 | -1,22 | 3,88 | -12,15 | 0,5562 | -0,0437 | |||
| MPWR / Monolithic Power Systems, Inc. | 0,00 | 7,38 | 3,85 | 5,74 | 0,5514 | 0,0572 | |||
| SHW / The Sherwin-Williams Company | 0,01 | -3,48 | 3,77 | -9,66 | 0,5398 | -0,0265 | |||
| VUG / Vanguard Index Funds - Vanguard Growth ETF | 0,01 | -25,66 | 3,14 | -24,40 | 0,4496 | -0,1138 | |||
| RYAN / Ryan Specialty Holdings, Inc. | 0,06 | 30,62 | 3,12 | 19,65 | 0,4464 | 0,0929 | |||
| FN / Fabrinet | 0,01 | 1,23 | 3,11 | 26,41 | 0,4448 | 0,1114 | |||
| KRYS / Krystal Biotech, Inc. | 0,01 | 0,71 | 2,95 | 40,67 | 0,4231 | 0,1380 | |||
| NTRA / Natera, Inc. | 0,01 | 1,68 | 2,77 | 44,70 | 0,3969 | 0,1370 | |||
| JKHY / Jack Henry & Associates, Inc. | 0,01 | 18,13 | 2,74 | 44,79 | 0,3917 | 0,1353 | |||
| AXSM / Axsome Therapeutics, Inc. | 0,01 | -15,07 | 2,70 | 27,71 | 0,3869 | 0,0999 | |||
| BE / Bloom Energy Corporation | 0,03 | -15,96 | 2,67 | -13,66 | 0,3830 | -0,0373 | |||
| DT / Dynatrace, Inc. | 0,06 | 5,01 | 2,58 | -6,09 | 0,3691 | -0,0032 | |||
| HALO / Halozyme Therapeutics, Inc. | 0,04 | 0,04 | 2,57 | -8,19 | 0,3675 | -0,0118 | |||
| MTD / Mettler-Toledo International Inc. | 0,00 | -0,12 | 2,33 | 13,41 | 0,3332 | 0,0549 | |||
| HURN / Huron Consulting Group Inc. | 0,01 | 141,04 | 2,25 | 184,09 | 0,3223 | 0,2147 | |||
| BWXT / BWX Technologies, Inc. | 0,01 | -19,13 | 2,19 | -24,19 | 0,3133 | -0,0783 | |||
| FCN / FTI Consulting, Inc. | 0,01 | 33,01 | 2,13 | 40,58 | 0,3046 | 0,0992 | |||
| SNDX / Syndax Pharmaceuticals, Inc. | 0,10 | 2,05 | 0,2942 | 0,2942 | |||||
| COO / The Cooper Companies, Inc. | 0,02 | 52,13 | 2,03 | 81,93 | 0,2913 | 0,1395 | |||
| ENTG / Entegris, Inc. | 0,02 | 2,88 | 1,92 | -6,25 | 0,2749 | -0,0030 | |||
| GOOG / Alphabet Inc. | 0,01 | -0,18 | 1,92 | 28,64 | 0,2747 | 0,0723 | |||
| QLYS / Qualys, Inc. | 0,01 | 22,61 | 1,87 | 23,19 | 0,2678 | 0,0617 | |||
| CCC / CCC Intelligent Solutions Holdings Inc. | 0,21 | 25,62 | 1,68 | 9,61 | 0,2400 | 0,0326 | |||
| VSTM / Verastem, Inc. | 0,22 | 1,67 | 0,2392 | 0,2392 | |||||
| BRK.B / Berkshire Hathaway Inc. | 0,00 | -88,29 | 1,45 | -88,29 | 0,2076 | -1,4721 | |||
| HD / The Home Depot, Inc. | 0,00 | -92,83 | 1,43 | -93,91 | 0,2051 | -2,9843 | |||
| IWF / iShares Trust - iShares Russell 1000 Growth ETF | 0,00 | 75,13 | 0,94 | 76,92 | 0,1351 | 0,0627 | |||
| EVLV / Evolv Technologies Holdings, Inc. | 0,13 | -20,92 | 0,93 | -25,00 | 0,1336 | -0,0352 | |||
| JNJ / Johnson & Johnson | 0,00 | 0,00 | 0,87 | 11,64 | 0,1251 | 0,0189 | |||
| TSLA / Tesla, Inc. | 0,00 | 0,00 | 0,83 | 1,09 | 0,1191 | 0,0075 | |||
| POOL / Pool Corporation | 0,00 | -35,36 | 0,78 | -52,35 | 0,1121 | -0,1106 | |||
| RKLB / Rocket Lab Corporation | 0,01 | 0,63 | 0,0000 | ||||||
| NVDA / NVIDIA Corporation | 0,00 | 0,00 | 0,57 | -0,18 | 0,0816 | 0,0042 | |||
| COST / Costco Wholesale Corporation | 0,00 | 0,00 | 0,54 | -6,88 | 0,0775 | -0,0013 | |||
| URI / United Rentals, Inc. | 0,00 | 0,00 | 0,53 | -15,24 | 0,0765 | -0,0090 | |||
| ENB / Enbridge Inc. | 0,01 | -6,75 | 0,53 | -11,56 | 0,0756 | -0,0055 | |||
| NOC / Northrop Grumman Corporation | 0,00 | 0,00 | 0,51 | -6,48 | 0,0724 | -0,0009 | |||
| DHR / Danaher Corporation | 0,00 | 0,00 | 0,43 | 15,68 | 0,0613 | 0,0110 | |||
| LLY / Eli Lilly and Company | 0,00 | 0,00 | 0,43 | 40,92 | 0,0612 | 0,0200 | |||
| RYCEY / Rolls-Royce Holdings plc - Depositary Receipt (Common Stock) | 0,03 | 0,00 | 0,39 | -2,96 | 0,0563 | 0,0013 | |||
| MMM / 3M Company | 0,00 | 0,00 | 0,32 | 3,23 | 0,0458 | 0,0037 | |||
| RTX / RTX Corporation | 0,00 | 0,00 | 0,31 | 9,57 | 0,0444 | 0,0060 | |||
| AMAT / Applied Materials, Inc. | 0,00 | 0,00 | 0,31 | 25,71 | 0,0442 | 0,0108 | |||
| WFC / Wells Fargo & Company | 0,00 | 0,00 | 0,28 | 11,16 | 0,0400 | 0,0059 | |||
| EW / Edwards Lifesciences Corporation | 0,00 | 0,00 | 0,26 | 9,91 | 0,0365 | 0,0050 | |||
| VTI / Vanguard Index Funds - Vanguard Total Stock Market ETF | 0,00 | 0,41 | 0,25 | 2,48 | 0,0356 | 0,0027 | |||
| HON / Honeywell International Inc. | 0,00 | 0,00 | 0,24 | -7,63 | 0,0348 | -0,0008 | |||
| ABT / Abbott Laboratories | 0,00 | 0,00 | 0,23 | -6,64 | 0,0323 | -0,0004 | |||
| SLB / SLB N.V. | 0,01 | 0,22 | 0,0312 | 0,0312 | |||||
| MSI / Motorola Solutions, Inc. | 0,00 | 0,00 | 0,22 | -16,28 | 0,0311 | -0,0041 | |||
| EXPE / Expedia Group, Inc. | 0,00 | 0,21 | 0,0294 | 0,0294 | |||||
| SPSC / SPS Commerce, Inc. | 0,00 | -100,00 | 0,00 | -100,00 | -0,1859 | ||||
| SBAC / SBA Communications Corporation | 0,00 | -100,00 | 0,00 | -100,00 | -0,1992 | ||||
| EQIX / Equinix, Inc. | 0,00 | -100,00 | 0,00 | -100,00 | -2,2337 | ||||
| SPNS / Sapiens International Corporation N.V. | 0,00 | -100,00 | 0,00 | -100,00 | -0,3410 | ||||
| EOG / EOG Resources, Inc. | 0,00 | -100,00 | 0,00 | -100,00 | -2,3239 | ||||
| UNP / Union Pacific Corporation | 0,00 | -100,00 | 0,00 | -100,00 | -0,0273 | ||||
| ETN / Eaton Corporation plc | 0,00 | -100,00 | 0,00 | -100,00 | -1,4802 | ||||
| LENB / Lennar Corp. - Class B | 0,00 | -100,00 | 0,00 | -100,00 | -2,2039 | ||||
| AMT / American Tower Corporation | 0,00 | -100,00 | 0,00 | -100,00 | -0,0319 | ||||
| XPRO / Expro Group Holdings N.V. | 0,00 | -100,00 | 0,00 | -100,00 | -0,7970 | ||||
| PTC / PTC Inc. | 0,00 | -100,00 | 0,00 | -100,00 | -0,0313 |