Annexon, Inc.
Giriş
Bu sayfada, Blackstone Group Management L.L.C. için bilinen içeriden öğrenen ticareti geçmişinin kapsamlı bir analizi sunulmaktadır. İçeriden öğrenenler bir şirketteki yetkililer, yöneticiler veya önemli yatırımcılardır. İçeridekilerin belirli, kamuya açık olmayan bilgilere dayanarak şirketlerinin ticaretini yapması yasa dışıdır. Bu onların kendi şirketlerinde herhangi bir işlem yapmalarının yasa dışı olduğu anlamına gelmez. Ancak tüm işlemleri Form 4 aracılığıyla SECe bildirmeleri gerekiyor. Bu kısıtlamalara rağmen, akademik araştırmalar içerdekilerin genel olarak kendi şirketlerinde piyasadan daha iyi performans gösterme eğiliminde olduklarını gösteriyor.
Ortalama Ticaret Kârlılığı
Ortalama ticari kârlılık, içeriden öğrenen tarafından son üç yılda yaptığı tüm açık piyasa alımlarının ortalama getirisidir. Bunu hesaplamak için, 10b5-1 ticaret planının bir parçası olarak işaretlenen tüm işlemler hariç, içeriden öğrenenlerin yaptığı her açık piyasa, planlanmamış satın almayı inceliyoruz. Daha sonra bu işlemlerin 3, 6 ve 12 aylık ortalama performansını hesaplıyoruz ve her bir işlem için nihai bir performans ölçüsü oluşturmak amacıyla bu sürelerin her birinin ortalamasını alıyoruz. Son olarak, içeriden öğrenenlerin performans ölçümünü hesaplamak için tüm performans ölçümlerinin ortalamasını alıyoruz. Bu liste yalnızca son iki yılda en az üç işlem gerçekleştiren içeriden öğrenenleri içermektedir.
İçeriden öğrenenlerin ticari kârlılığı "Uygulanamaz" ise, içeriden öğrenen kişi ya son üç yılda herhangi bir açık piyasadan alım yapmamıştır ya da yaptıkları işlemler güvenilir bir performans ölçüsü hesaplamak için çok yenidir.
Güncelleme Sıklığı: Günlük
İçeriden Öğrenen Pozisyonları Bildiren Şirketler
SEC dosyaları, Blackstone Group Management L.L.C.ın aşağıdaki şirketlerde varlıkları olduğunu veya ticaret yaptığını bildirdiğini gösteriyor:
Grafikler Nasıl Yorumlanır?
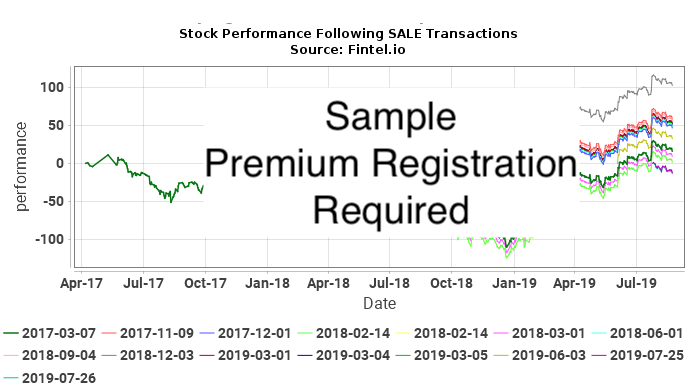
Aşağıdaki grafikler, Blackstone Group Management L.L.C. tarafından yapılan her açık piyasa, planlanmamış ticaret sonrasında menkul kıymetlerin hisse senedi performansını göstermektedir. Planlanmamış ticaret, 10b5-1 ticaret planının parçası olarak yapılmayan ticarettir. Hisse senedi performansı, hisse fiyatındaki kümülatif yüzde değişim olarak gösterilmektedir. Örneğin, 1 Ocak 2019da içeriden öğrenen ticareti yapılmışsa grafik, menkul kıymetin günümüze kadar olan günlük yüzde değişimini gösterecektir. Bu süre zarfında hisse fiyatı 10 dolardan 15 dolara çıkarsa, hisse fiyatındaki kümülatif yüzde değişim %50 olacaktır. Fiyattaki 10 Dolardan 20 Dolara değişim %100, fiyatta 10 Dolardan 5 Dolara değişim ise -%50 olur.
Son olarak, içeriden öğrenenin işlemlerinin içeriden öğrenilen bilgilerden kâr elde edebilmek için zamanlayıp zamanlamadığını görmek amacıyla, içeriden öğrenenin işlemlerinin hisse fiyatındaki aşırı getirilerle (pozitif veya negatif) ne kadar yakından ilişkili olduğunu belirlemeye çalışıyoruz. İçeriden öğrenenin bunu yaptığı durumu düşünün. Bu durumda, (a) alımlardan sonra pozitif getiriler veya (b) satışlardan sonra olumsuz getiriler bekleriz. (a) durumunda, ALIM grafiği, her satın alma işleminden sonra pozitif getiriyi gösteren bir dizi yukarı doğru eğimli eğri gösterecektir. (b) durumunda, SATIM grafiği, her satış işleminden sonra negatif getiriyi gösteren bir dizi aşağı doğru eğimli eğri gösterecektir.
Ancak bu tek başına sonuç çıkarmak için yeterli değildir. Örneğin, şirketin hisse fiyatı uzun yıllar boyunca döngüsel olmayan bir yükseliş gösteriyorsa, satın alma sonrası tüm lotların yukarı doğru eğimli olmasını bekleriz. Benzer şekilde, uzun yıllar boyunca döngüsel olmayan düşüşler, ticaret sonrası lotların aşağı doğru eğimli olmasına neden olacaktır. Bu grafiklerin hiçbiri içeriden öğrenenlerin ticareti faaliyeti şüphesi öne sürmez.
En güçlü gösterge, hisse fiyatının son derece döngüsel olduğu ve ALIM tablosunda hem pozitif sinyallerin, hem de SATIM grafiğinde negatif lotların olduğu bir durum olacaktır. Bu durum, içeriden öğrenenin işlemleri kendi finansal avantajlarına göre zamanladığını gösteriyor.
İçeriden Öğrenen Alımları ANNX / Annexon, Inc. - Kısa Vadeli Kâr Analizi
Bu bölümde, ANNX / Annexon, Inc. yılında yapılan her planlanmamış, açık piyasada içeriden öğrenen alımlarının kârlılığını analiz ediyoruz. Bu analiz, içeriden öğrenen kişinin sürekli olarak anormal getiriler sağlayıp sağlamadığını ve takip edilmeye değer olup olmadığını anlamaya yardımcı olur. Bu analiz her işlemi takip eden bir yıllık süreyi kapsar ve sonuçlar teoriktir .
Aşağıdaki tablo, otomatik ticaret planının parçası olmayan en son açık piyasa alımlarını göstermektedir.
| İşlem Tarihi | Ticker | İçeriden Öğrenen | Bildirilmiş Hisseler |
Bildirilmiş Fiyat |
Düzeltilmiş Hisseler |
Düzeltilmiş Fiyat |
Maliyet Esası | Gün | Fiyat Maks |
Maks Kâr ($) |
Maks Getiri (%) |
|---|---|---|---|---|---|---|---|---|---|---|---|
| 2020-07-28 | ANNX | Clarus Lifesciences III, L.P. | 200.000 | 17,0000 | 200.000 | 17,0000 | 3.400.000 | 231 | 35.01 | 3.602.000 | 105,94 |
Düzeltilmiş Fiyat, bölünmüş olarak düzeltilmiş fiyattır. Düzeltilmiş Hisseler , bölünmüş olarak düzeltilmiş hisselerdir.
İçeriden Öğrenenlerin Satışları ANNX / Annexon, Inc. - Kısa Vadeli Zarar Analizi
Bu bölümde, ANNX / Annexon, Inc. yılında yapılan her planlanmamış, açık piyasa içeriden öğrenen satışın kısa vadeli zarardan kaçınma yöntemini analiz ediyoruz. Tutarlı bir kayıptan kaçınma modeli gelecekteki satış işlemlerinin fiyattaki düşüşleri öngörebileceğini düşündürebilir. Bu analiz her işlemi takip eden bir yıllık süreyi kapsar ve sonuçlar teoriktir .
Aşağıdaki tablo, otomatik ticaret planının parçası olmayan en son açık piyasa satışlarını göstermektedir.
| İşlem Tarihi | Ticker | İçeriden Öğrenen | Bildirilmiş Hisseler |
Bildirilmiş Fiyat |
Düzeltilmiş Hisseler |
Düzeltilmiş Fiyat |
Maliyet Esası | Gün Min |
Fiyat Min |
Maks Kayıp Kaçınılan ($) |
Maks Kayıp Kaçınılan (%) |
|---|---|---|---|---|---|---|---|
| Bu içeriden öğrenilenler ve güvenlik kombinasyonu için bilinen planlanmamış açık piyasa ticareti yoktur. |
Düzeltilmiş Fiyat, bölünmüş olarak düzeltilmiş fiyattır. Düzeltilmiş Hisseler , bölünmüş olarak düzeltilmiş hisselerdir.
İçeriden Öğrenen Alımları APG / APi Group Corporation - Kısa Vadeli Kâr Analizi
Bu bölümde, ANNX / Annexon, Inc. yılında yapılan her planlanmamış, açık piyasada içeriden öğrenen alımlarının kârlılığını analiz ediyoruz. Bu analiz, içeriden öğrenen kişinin sürekli olarak anormal getiriler sağlayıp sağlamadığını ve takip edilmeye değer olup olmadığını anlamaya yardımcı olur. Bu analiz her işlemi takip eden bir yıllık süreyi kapsar ve sonuçlar teoriktir .
Aşağıdaki tablo, otomatik ticaret planının parçası olmayan en son açık piyasa alımlarını göstermektedir.
| İşlem Tarihi | Ticker | İçeriden Öğrenen | Bildirilmiş Hisseler |
Bildirilmiş Fiyat |
Düzeltilmiş Hisseler |
Düzeltilmiş Fiyat |
Maliyet Esası | Gün | Fiyat Maks |
Maks Kâr ($) |
Maks Getiri (%) |
|---|---|---|---|---|---|---|---|
| Bu içeriden öğrenilenler ve güvenlik kombinasyonu için bilinen planlanmamış açık piyasa ticareti yoktur. |
Düzeltilmiş Fiyat, bölünmüş olarak düzeltilmiş fiyattır. Düzeltilmiş Hisseler , bölünmüş olarak düzeltilmiş hisselerdir.
İçeriden Öğrenenlerin Satışları APG / APi Group Corporation - Kısa Vadeli Zarar Analizi
Bu bölümde, ANNX / Annexon, Inc. yılında yapılan her planlanmamış, açık piyasa içeriden öğrenen satışın kısa vadeli zarardan kaçınma yöntemini analiz ediyoruz. Tutarlı bir kayıptan kaçınma modeli gelecekteki satış işlemlerinin fiyattaki düşüşleri öngörebileceğini düşündürebilir. Bu analiz her işlemi takip eden bir yıllık süreyi kapsar ve sonuçlar teoriktir .
Aşağıdaki tablo, otomatik ticaret planının parçası olmayan en son açık piyasa satışlarını göstermektedir.
Düzeltilmiş Fiyat, bölünmüş olarak düzeltilmiş fiyattır. Düzeltilmiş Hisseler , bölünmüş olarak düzeltilmiş hisselerdir.
İçeriden Öğrenen Alımları BAERW / Bridger Aerospace Group Holdings, Inc. - Equity Warrant - Kısa Vadeli Kâr Analizi
Bu bölümde, ANNX / Annexon, Inc. yılında yapılan her planlanmamış, açık piyasada içeriden öğrenen alımlarının kârlılığını analiz ediyoruz. Bu analiz, içeriden öğrenen kişinin sürekli olarak anormal getiriler sağlayıp sağlamadığını ve takip edilmeye değer olup olmadığını anlamaya yardımcı olur. Bu analiz her işlemi takip eden bir yıllık süreyi kapsar ve sonuçlar teoriktir .
Aşağıdaki tablo, otomatik ticaret planının parçası olmayan en son açık piyasa alımlarını göstermektedir.
| İşlem Tarihi | Ticker | İçeriden Öğrenen | Bildirilmiş Hisseler |
Bildirilmiş Fiyat |
Düzeltilmiş Hisseler |
Düzeltilmiş Fiyat |
Maliyet Esası | Gün | Fiyat Maks |
Maks Kâr ($) |
Maks Getiri (%) |
|---|---|---|---|---|---|---|---|
| Bu içeriden öğrenilenler ve güvenlik kombinasyonu için bilinen planlanmamış açık piyasa ticareti yoktur. |
Düzeltilmiş Fiyat, bölünmüş olarak düzeltilmiş fiyattır. Düzeltilmiş Hisseler , bölünmüş olarak düzeltilmiş hisselerdir.
İçeriden Öğrenenlerin Satışları BAERW / Bridger Aerospace Group Holdings, Inc. - Equity Warrant - Kısa Vadeli Zarar Analizi
Bu bölümde, ANNX / Annexon, Inc. yılında yapılan her planlanmamış, açık piyasa içeriden öğrenen satışın kısa vadeli zarardan kaçınma yöntemini analiz ediyoruz. Tutarlı bir kayıptan kaçınma modeli gelecekteki satış işlemlerinin fiyattaki düşüşleri öngörebileceğini düşündürebilir. Bu analiz her işlemi takip eden bir yıllık süreyi kapsar ve sonuçlar teoriktir .
Aşağıdaki tablo, otomatik ticaret planının parçası olmayan en son açık piyasa satışlarını göstermektedir.
| İşlem Tarihi | Ticker | İçeriden Öğrenen | Bildirilmiş Hisseler |
Bildirilmiş Fiyat |
Düzeltilmiş Hisseler |
Düzeltilmiş Fiyat |
Maliyet Esası | Gün Min |
Fiyat Min |
Maks Kayıp Kaçınılan ($) |
Maks Kayıp Kaçınılan (%) |
|---|---|---|---|---|---|---|---|
| Bu içeriden öğrenilenler ve güvenlik kombinasyonu için bilinen planlanmamış açık piyasa ticareti yoktur. |
Düzeltilmiş Fiyat, bölünmüş olarak düzeltilmiş fiyattır. Düzeltilmiş Hisseler , bölünmüş olarak düzeltilmiş hisselerdir.
İçeriden Öğrenen Alımları BGB / Blackstone Strategic Credit 2027 Term Fund - Kısa Vadeli Kâr Analizi
Bu bölümde, ANNX / Annexon, Inc. yılında yapılan her planlanmamış, açık piyasada içeriden öğrenen alımlarının kârlılığını analiz ediyoruz. Bu analiz, içeriden öğrenen kişinin sürekli olarak anormal getiriler sağlayıp sağlamadığını ve takip edilmeye değer olup olmadığını anlamaya yardımcı olur. Bu analiz her işlemi takip eden bir yıllık süreyi kapsar ve sonuçlar teoriktir .
Aşağıdaki tablo, otomatik ticaret planının parçası olmayan en son açık piyasa alımlarını göstermektedir.
| İşlem Tarihi | Ticker | İçeriden Öğrenen | Bildirilmiş Hisseler |
Bildirilmiş Fiyat |
Düzeltilmiş Hisseler |
Düzeltilmiş Fiyat |
Maliyet Esası | Gün | Fiyat Maks |
Maks Kâr ($) |
Maks Getiri (%) |
|---|---|---|---|---|---|---|---|
| Bu içeriden öğrenilenler ve güvenlik kombinasyonu için bilinen planlanmamış açık piyasa ticareti yoktur. |
Düzeltilmiş Fiyat, bölünmüş olarak düzeltilmiş fiyattır. Düzeltilmiş Hisseler , bölünmüş olarak düzeltilmiş hisselerdir.
İçeriden Öğrenenlerin Satışları BGB / Blackstone Strategic Credit 2027 Term Fund - Kısa Vadeli Zarar Analizi
Bu bölümde, ANNX / Annexon, Inc. yılında yapılan her planlanmamış, açık piyasa içeriden öğrenen satışın kısa vadeli zarardan kaçınma yöntemini analiz ediyoruz. Tutarlı bir kayıptan kaçınma modeli gelecekteki satış işlemlerinin fiyattaki düşüşleri öngörebileceğini düşündürebilir. Bu analiz her işlemi takip eden bir yıllık süreyi kapsar ve sonuçlar teoriktir .
Aşağıdaki tablo, otomatik ticaret planının parçası olmayan en son açık piyasa satışlarını göstermektedir.
| İşlem Tarihi | Ticker | İçeriden Öğrenen | Bildirilmiş Hisseler |
Bildirilmiş Fiyat |
Düzeltilmiş Hisseler |
Düzeltilmiş Fiyat |
Maliyet Esası | Gün Min |
Fiyat Min |
Maks Kayıp Kaçınılan ($) |
Maks Kayıp Kaçınılan (%) |
|---|---|---|---|---|---|---|---|
| Bu içeriden öğrenilenler ve güvenlik kombinasyonu için bilinen planlanmamış açık piyasa ticareti yoktur. |
Düzeltilmiş Fiyat, bölünmüş olarak düzeltilmiş fiyattır. Düzeltilmiş Hisseler , bölünmüş olarak düzeltilmiş hisselerdir.
İçeriden Öğrenen Alımları BKU / BankUnited, Inc. - Kısa Vadeli Kâr Analizi
Bu bölümde, ANNX / Annexon, Inc. yılında yapılan her planlanmamış, açık piyasada içeriden öğrenen alımlarının kârlılığını analiz ediyoruz. Bu analiz, içeriden öğrenen kişinin sürekli olarak anormal getiriler sağlayıp sağlamadığını ve takip edilmeye değer olup olmadığını anlamaya yardımcı olur. Bu analiz her işlemi takip eden bir yıllık süreyi kapsar ve sonuçlar teoriktir .
Aşağıdaki tablo, otomatik ticaret planının parçası olmayan en son açık piyasa alımlarını göstermektedir.
| İşlem Tarihi | Ticker | İçeriden Öğrenen | Bildirilmiş Hisseler |
Bildirilmiş Fiyat |
Düzeltilmiş Hisseler |
Düzeltilmiş Fiyat |
Maliyet Esası | Gün | Fiyat Maks |
Maks Kâr ($) |
Maks Getiri (%) |
|---|---|---|---|---|---|---|---|
| Bu içeriden öğrenilenler ve güvenlik kombinasyonu için bilinen planlanmamış açık piyasa ticareti yoktur. |
Düzeltilmiş Fiyat, bölünmüş olarak düzeltilmiş fiyattır. Düzeltilmiş Hisseler , bölünmüş olarak düzeltilmiş hisselerdir.
İçeriden Öğrenenlerin Satışları BKU / BankUnited, Inc. - Kısa Vadeli Zarar Analizi
Bu bölümde, ANNX / Annexon, Inc. yılında yapılan her planlanmamış, açık piyasa içeriden öğrenen satışın kısa vadeli zarardan kaçınma yöntemini analiz ediyoruz. Tutarlı bir kayıptan kaçınma modeli gelecekteki satış işlemlerinin fiyattaki düşüşleri öngörebileceğini düşündürebilir. Bu analiz her işlemi takip eden bir yıllık süreyi kapsar ve sonuçlar teoriktir .
Aşağıdaki tablo, otomatik ticaret planının parçası olmayan en son açık piyasa satışlarını göstermektedir.
| İşlem Tarihi | Ticker | İçeriden Öğrenen | Bildirilmiş Hisseler |
Bildirilmiş Fiyat |
Düzeltilmiş Hisseler |
Düzeltilmiş Fiyat |
Maliyet Esası | Gün Min |
Fiyat Min |
Maks Kayıp Kaçınılan ($) |
Maks Kayıp Kaçınılan (%) |
|---|---|---|---|---|---|---|---|
| Bu içeriden öğrenilenler ve güvenlik kombinasyonu için bilinen planlanmamış açık piyasa ticareti yoktur. |
Düzeltilmiş Fiyat, bölünmüş olarak düzeltilmiş fiyattır. Düzeltilmiş Hisseler , bölünmüş olarak düzeltilmiş hisselerdir.
İçeriden Öğrenen Alımları BRX / Brixmor Property Group Inc. - Kısa Vadeli Kâr Analizi
Bu bölümde, ANNX / Annexon, Inc. yılında yapılan her planlanmamış, açık piyasada içeriden öğrenen alımlarının kârlılığını analiz ediyoruz. Bu analiz, içeriden öğrenen kişinin sürekli olarak anormal getiriler sağlayıp sağlamadığını ve takip edilmeye değer olup olmadığını anlamaya yardımcı olur. Bu analiz her işlemi takip eden bir yıllık süreyi kapsar ve sonuçlar teoriktir .
Aşağıdaki tablo, otomatik ticaret planının parçası olmayan en son açık piyasa alımlarını göstermektedir.
Düzeltilmiş Fiyat, bölünmüş olarak düzeltilmiş fiyattır. Düzeltilmiş Hisseler , bölünmüş olarak düzeltilmiş hisselerdir.
İçeriden Öğrenenlerin Satışları BRX / Brixmor Property Group Inc. - Kısa Vadeli Zarar Analizi
Bu bölümde, ANNX / Annexon, Inc. yılında yapılan her planlanmamış, açık piyasa içeriden öğrenen satışın kısa vadeli zarardan kaçınma yöntemini analiz ediyoruz. Tutarlı bir kayıptan kaçınma modeli gelecekteki satış işlemlerinin fiyattaki düşüşleri öngörebileceğini düşündürebilir. Bu analiz her işlemi takip eden bir yıllık süreyi kapsar ve sonuçlar teoriktir .
Aşağıdaki tablo, otomatik ticaret planının parçası olmayan en son açık piyasa satışlarını göstermektedir.
Düzeltilmiş Fiyat, bölünmüş olarak düzeltilmiş fiyattır. Düzeltilmiş Hisseler , bölünmüş olarak düzeltilmiş hisselerdir.
İçeriden Öğrenen Alımları BXMT / Blackstone Mortgage Trust, Inc. - Kısa Vadeli Kâr Analizi
Bu bölümde, ANNX / Annexon, Inc. yılında yapılan her planlanmamış, açık piyasada içeriden öğrenen alımlarının kârlılığını analiz ediyoruz. Bu analiz, içeriden öğrenen kişinin sürekli olarak anormal getiriler sağlayıp sağlamadığını ve takip edilmeye değer olup olmadığını anlamaya yardımcı olur. Bu analiz her işlemi takip eden bir yıllık süreyi kapsar ve sonuçlar teoriktir .
Aşağıdaki tablo, otomatik ticaret planının parçası olmayan en son açık piyasa alımlarını göstermektedir.
| İşlem Tarihi | Ticker | İçeriden Öğrenen | Bildirilmiş Hisseler |
Bildirilmiş Fiyat |
Düzeltilmiş Hisseler |
Düzeltilmiş Fiyat |
Maliyet Esası | Gün | Fiyat Maks |
Maks Kâr ($) |
Maks Getiri (%) |
|---|---|---|---|---|---|---|---|---|---|---|---|
| 2013-05-29 | BXMT | Blackstone Holdings III L.P. | 1.960.784 | 25,5000 | 1.960.784 | 25,5000 | 49.999.992 | 365 | 29.7400 | 8.313.724 | 16,63 |
Düzeltilmiş Fiyat, bölünmüş olarak düzeltilmiş fiyattır. Düzeltilmiş Hisseler , bölünmüş olarak düzeltilmiş hisselerdir.
İçeriden Öğrenenlerin Satışları BXMT / Blackstone Mortgage Trust, Inc. - Kısa Vadeli Zarar Analizi
Bu bölümde, ANNX / Annexon, Inc. yılında yapılan her planlanmamış, açık piyasa içeriden öğrenen satışın kısa vadeli zarardan kaçınma yöntemini analiz ediyoruz. Tutarlı bir kayıptan kaçınma modeli gelecekteki satış işlemlerinin fiyattaki düşüşleri öngörebileceğini düşündürebilir. Bu analiz her işlemi takip eden bir yıllık süreyi kapsar ve sonuçlar teoriktir .
Aşağıdaki tablo, otomatik ticaret planının parçası olmayan en son açık piyasa satışlarını göstermektedir.
| İşlem Tarihi | Ticker | İçeriden Öğrenen | Bildirilmiş Hisseler |
Bildirilmiş Fiyat |
Düzeltilmiş Hisseler |
Düzeltilmiş Fiyat |
Maliyet Esası | Gün Min |
Fiyat Min |
Maks Kayıp Kaçınılan ($) |
Maks Kayıp Kaçınılan (%) |
|---|---|---|---|---|---|---|---|
| Bu içeriden öğrenilenler ve güvenlik kombinasyonu için bilinen planlanmamış açık piyasa ticareti yoktur. |
Düzeltilmiş Fiyat, bölünmüş olarak düzeltilmiş fiyattır. Düzeltilmiş Hisseler , bölünmüş olarak düzeltilmiş hisselerdir.
İçeriden Öğrenen Alımları BXSL / Blackstone Secured Lending Fund - Kısa Vadeli Kâr Analizi
Bu bölümde, ANNX / Annexon, Inc. yılında yapılan her planlanmamış, açık piyasada içeriden öğrenen alımlarının kârlılığını analiz ediyoruz. Bu analiz, içeriden öğrenen kişinin sürekli olarak anormal getiriler sağlayıp sağlamadığını ve takip edilmeye değer olup olmadığını anlamaya yardımcı olur. Bu analiz her işlemi takip eden bir yıllık süreyi kapsar ve sonuçlar teoriktir .
Aşağıdaki tablo, otomatik ticaret planının parçası olmayan en son açık piyasa alımlarını göstermektedir.
| İşlem Tarihi | Ticker | İçeriden Öğrenen | Bildirilmiş Hisseler |
Bildirilmiş Fiyat |
Düzeltilmiş Hisseler |
Düzeltilmiş Fiyat |
Maliyet Esası | Gün | Fiyat Maks |
Maks Kâr ($) |
Maks Getiri (%) |
|---|---|---|---|---|---|---|---|---|---|---|---|
| 2018-11-06 | NONE | Blackstone BGSL Holdings LLC | 192.000 | 25,0000 | 192.000 | 25,0000 | 4.800.000 | 731 |
Düzeltilmiş Fiyat, bölünmüş olarak düzeltilmiş fiyattır. Düzeltilmiş Hisseler , bölünmüş olarak düzeltilmiş hisselerdir.
İçeriden Öğrenenlerin Satışları BXSL / Blackstone Secured Lending Fund - Kısa Vadeli Zarar Analizi
Bu bölümde, ANNX / Annexon, Inc. yılında yapılan her planlanmamış, açık piyasa içeriden öğrenen satışın kısa vadeli zarardan kaçınma yöntemini analiz ediyoruz. Tutarlı bir kayıptan kaçınma modeli gelecekteki satış işlemlerinin fiyattaki düşüşleri öngörebileceğini düşündürebilir. Bu analiz her işlemi takip eden bir yıllık süreyi kapsar ve sonuçlar teoriktir .
Aşağıdaki tablo, otomatik ticaret planının parçası olmayan en son açık piyasa satışlarını göstermektedir.
| İşlem Tarihi | Ticker | İçeriden Öğrenen | Bildirilmiş Hisseler |
Bildirilmiş Fiyat |
Düzeltilmiş Hisseler |
Düzeltilmiş Fiyat |
Maliyet Esası | Gün Min |
Fiyat Min |
Maks Kayıp Kaçınılan ($) |
Maks Kayıp Kaçınılan (%) |
|---|---|---|---|---|---|---|---|
| Bu içeriden öğrenilenler ve güvenlik kombinasyonu için bilinen planlanmamış açık piyasa ticareti yoktur. |
Düzeltilmiş Fiyat, bölünmüş olarak düzeltilmiş fiyattır. Düzeltilmiş Hisseler , bölünmüş olarak düzeltilmiş hisselerdir.
İçeriden Öğrenen Alımları CALC / CalciMedica, Inc. - Kısa Vadeli Kâr Analizi
Bu bölümde, ANNX / Annexon, Inc. yılında yapılan her planlanmamış, açık piyasada içeriden öğrenen alımlarının kârlılığını analiz ediyoruz. Bu analiz, içeriden öğrenen kişinin sürekli olarak anormal getiriler sağlayıp sağlamadığını ve takip edilmeye değer olup olmadığını anlamaya yardımcı olur. Bu analiz her işlemi takip eden bir yıllık süreyi kapsar ve sonuçlar teoriktir .
Aşağıdaki tablo, otomatik ticaret planının parçası olmayan en son açık piyasa alımlarını göstermektedir.
| İşlem Tarihi | Ticker | İçeriden Öğrenen | Bildirilmiş Hisseler |
Bildirilmiş Fiyat |
Düzeltilmiş Hisseler |
Düzeltilmiş Fiyat |
Maliyet Esası | Gün | Fiyat Maks |
Maks Kâr ($) |
Maks Getiri (%) |
|---|---|---|---|---|---|---|---|---|---|---|---|
| 2020-09-29 | GRAY | Clarus Lifesciences III, L.P. | 250.000 | 16,0000 | 17.857 | 224,0000 | 4.000.000 | 115 | 490 | 4.749.930 | 118,75 |
Düzeltilmiş Fiyat, bölünmüş olarak düzeltilmiş fiyattır. Düzeltilmiş Hisseler , bölünmüş olarak düzeltilmiş hisselerdir.
İçeriden Öğrenenlerin Satışları CALC / CalciMedica, Inc. - Kısa Vadeli Zarar Analizi
Bu bölümde, ANNX / Annexon, Inc. yılında yapılan her planlanmamış, açık piyasa içeriden öğrenen satışın kısa vadeli zarardan kaçınma yöntemini analiz ediyoruz. Tutarlı bir kayıptan kaçınma modeli gelecekteki satış işlemlerinin fiyattaki düşüşleri öngörebileceğini düşündürebilir. Bu analiz her işlemi takip eden bir yıllık süreyi kapsar ve sonuçlar teoriktir .
Aşağıdaki tablo, otomatik ticaret planının parçası olmayan en son açık piyasa satışlarını göstermektedir.
| İşlem Tarihi | Ticker | İçeriden Öğrenen | Bildirilmiş Hisseler |
Bildirilmiş Fiyat |
Düzeltilmiş Hisseler |
Düzeltilmiş Fiyat |
Maliyet Esası | Gün Min |
Fiyat Min |
Maks Kayıp Kaçınılan ($) |
Maks Kayıp Kaçınılan (%) |
|---|---|---|---|---|---|---|---|
| Bu içeriden öğrenilenler ve güvenlik kombinasyonu için bilinen planlanmamış açık piyasa ticareti yoktur. |
Düzeltilmiş Fiyat, bölünmüş olarak düzeltilmiş fiyattır. Düzeltilmiş Hisseler , bölünmüş olarak düzeltilmiş hisselerdir.
İçeriden Öğrenen Alımları CQP / Cheniere Energy Partners, L.P. - Limited Partnership - Kısa Vadeli Kâr Analizi
Bu bölümde, ANNX / Annexon, Inc. yılında yapılan her planlanmamış, açık piyasada içeriden öğrenen alımlarının kârlılığını analiz ediyoruz. Bu analiz, içeriden öğrenen kişinin sürekli olarak anormal getiriler sağlayıp sağlamadığını ve takip edilmeye değer olup olmadığını anlamaya yardımcı olur. Bu analiz her işlemi takip eden bir yıllık süreyi kapsar ve sonuçlar teoriktir .
Aşağıdaki tablo, otomatik ticaret planının parçası olmayan en son açık piyasa alımlarını göstermektedir.
Düzeltilmiş Fiyat, bölünmüş olarak düzeltilmiş fiyattır. Düzeltilmiş Hisseler , bölünmüş olarak düzeltilmiş hisselerdir.
İçeriden Öğrenenlerin Satışları CQP / Cheniere Energy Partners, L.P. - Limited Partnership - Kısa Vadeli Zarar Analizi
Bu bölümde, ANNX / Annexon, Inc. yılında yapılan her planlanmamış, açık piyasa içeriden öğrenen satışın kısa vadeli zarardan kaçınma yöntemini analiz ediyoruz. Tutarlı bir kayıptan kaçınma modeli gelecekteki satış işlemlerinin fiyattaki düşüşleri öngörebileceğini düşündürebilir. Bu analiz her işlemi takip eden bir yıllık süreyi kapsar ve sonuçlar teoriktir .
Aşağıdaki tablo, otomatik ticaret planının parçası olmayan en son açık piyasa satışlarını göstermektedir.
Düzeltilmiş Fiyat, bölünmüş olarak düzeltilmiş fiyattır. Düzeltilmiş Hisseler , bölünmüş olarak düzeltilmiş hisselerdir.
İçeriden Öğrenen Alımları CRBD / Corebridge Financial, Inc. - Corporate Bond/Note - Kısa Vadeli Kâr Analizi
Bu bölümde, ANNX / Annexon, Inc. yılında yapılan her planlanmamış, açık piyasada içeriden öğrenen alımlarının kârlılığını analiz ediyoruz. Bu analiz, içeriden öğrenen kişinin sürekli olarak anormal getiriler sağlayıp sağlamadığını ve takip edilmeye değer olup olmadığını anlamaya yardımcı olur. Bu analiz her işlemi takip eden bir yıllık süreyi kapsar ve sonuçlar teoriktir .
Aşağıdaki tablo, otomatik ticaret planının parçası olmayan en son açık piyasa alımlarını göstermektedir.
| İşlem Tarihi | Ticker | İçeriden Öğrenen | Bildirilmiş Hisseler |
Bildirilmiş Fiyat |
Düzeltilmiş Hisseler |
Düzeltilmiş Fiyat |
Maliyet Esası | Gün | Fiyat Maks |
Maks Kâr ($) |
Maks Getiri (%) |
|---|---|---|---|---|---|---|---|
| Bu içeriden öğrenilenler ve güvenlik kombinasyonu için bilinen planlanmamış açık piyasa ticareti yoktur. |
Düzeltilmiş Fiyat, bölünmüş olarak düzeltilmiş fiyattır. Düzeltilmiş Hisseler , bölünmüş olarak düzeltilmiş hisselerdir.
İçeriden Öğrenenlerin Satışları CRBD / Corebridge Financial, Inc. - Corporate Bond/Note - Kısa Vadeli Zarar Analizi
Bu bölümde, ANNX / Annexon, Inc. yılında yapılan her planlanmamış, açık piyasa içeriden öğrenen satışın kısa vadeli zarardan kaçınma yöntemini analiz ediyoruz. Tutarlı bir kayıptan kaçınma modeli gelecekteki satış işlemlerinin fiyattaki düşüşleri öngörebileceğini düşündürebilir. Bu analiz her işlemi takip eden bir yıllık süreyi kapsar ve sonuçlar teoriktir .
Aşağıdaki tablo, otomatik ticaret planının parçası olmayan en son açık piyasa satışlarını göstermektedir.
| İşlem Tarihi | Ticker | İçeriden Öğrenen | Bildirilmiş Hisseler |
Bildirilmiş Fiyat |
Düzeltilmiş Hisseler |
Düzeltilmiş Fiyat |
Maliyet Esası | Gün Min |
Fiyat Min |
Maks Kayıp Kaçınılan ($) |
Maks Kayıp Kaçınılan (%) |
|---|---|---|---|---|---|---|---|
| Bu içeriden öğrenilenler ve güvenlik kombinasyonu için bilinen planlanmamış açık piyasa ticareti yoktur. |
Düzeltilmiş Fiyat, bölünmüş olarak düzeltilmiş fiyattır. Düzeltilmiş Hisseler , bölünmüş olarak düzeltilmiş hisselerdir.
İçeriden Öğrenen Alımları CROX / Crocs, Inc. - Kısa Vadeli Kâr Analizi
Bu bölümde, ANNX / Annexon, Inc. yılında yapılan her planlanmamış, açık piyasada içeriden öğrenen alımlarının kârlılığını analiz ediyoruz. Bu analiz, içeriden öğrenen kişinin sürekli olarak anormal getiriler sağlayıp sağlamadığını ve takip edilmeye değer olup olmadığını anlamaya yardımcı olur. Bu analiz her işlemi takip eden bir yıllık süreyi kapsar ve sonuçlar teoriktir .
Aşağıdaki tablo, otomatik ticaret planının parçası olmayan en son açık piyasa alımlarını göstermektedir.
| İşlem Tarihi | Ticker | İçeriden Öğrenen | Bildirilmiş Hisseler |
Bildirilmiş Fiyat |
Düzeltilmiş Hisseler |
Düzeltilmiş Fiyat |
Maliyet Esası | Gün | Fiyat Maks |
Maks Kâr ($) |
Maks Getiri (%) |
|---|---|---|---|---|---|---|---|
| Bu içeriden öğrenilenler ve güvenlik kombinasyonu için bilinen planlanmamış açık piyasa ticareti yoktur. |
Düzeltilmiş Fiyat, bölünmüş olarak düzeltilmiş fiyattır. Düzeltilmiş Hisseler , bölünmüş olarak düzeltilmiş hisselerdir.
İçeriden Öğrenenlerin Satışları CROX / Crocs, Inc. - Kısa Vadeli Zarar Analizi
Bu bölümde, ANNX / Annexon, Inc. yılında yapılan her planlanmamış, açık piyasa içeriden öğrenen satışın kısa vadeli zarardan kaçınma yöntemini analiz ediyoruz. Tutarlı bir kayıptan kaçınma modeli gelecekteki satış işlemlerinin fiyattaki düşüşleri öngörebileceğini düşündürebilir. Bu analiz her işlemi takip eden bir yıllık süreyi kapsar ve sonuçlar teoriktir .
Aşağıdaki tablo, otomatik ticaret planının parçası olmayan en son açık piyasa satışlarını göstermektedir.
Düzeltilmiş Fiyat, bölünmüş olarak düzeltilmiş fiyattır. Düzeltilmiş Hisseler , bölünmüş olarak düzeltilmiş hisselerdir.
İçeriden Öğrenen Alımları CTOS / Custom Truck One Source, Inc. - Kısa Vadeli Kâr Analizi
Bu bölümde, ANNX / Annexon, Inc. yılında yapılan her planlanmamış, açık piyasada içeriden öğrenen alımlarının kârlılığını analiz ediyoruz. Bu analiz, içeriden öğrenen kişinin sürekli olarak anormal getiriler sağlayıp sağlamadığını ve takip edilmeye değer olup olmadığını anlamaya yardımcı olur. Bu analiz her işlemi takip eden bir yıllık süreyi kapsar ve sonuçlar teoriktir .
Aşağıdaki tablo, otomatik ticaret planının parçası olmayan en son açık piyasa alımlarını göstermektedir.
| İşlem Tarihi | Ticker | İçeriden Öğrenen | Bildirilmiş Hisseler |
Bildirilmiş Fiyat |
Düzeltilmiş Hisseler |
Düzeltilmiş Fiyat |
Maliyet Esası | Gün | Fiyat Maks |
Maks Kâr ($) |
Maks Getiri (%) |
|---|---|---|---|---|---|---|---|
| Bu içeriden öğrenilenler ve güvenlik kombinasyonu için bilinen planlanmamış açık piyasa ticareti yoktur. |
Düzeltilmiş Fiyat, bölünmüş olarak düzeltilmiş fiyattır. Düzeltilmiş Hisseler , bölünmüş olarak düzeltilmiş hisselerdir.
İçeriden Öğrenenlerin Satışları CTOS / Custom Truck One Source, Inc. - Kısa Vadeli Zarar Analizi
Bu bölümde, ANNX / Annexon, Inc. yılında yapılan her planlanmamış, açık piyasa içeriden öğrenen satışın kısa vadeli zarardan kaçınma yöntemini analiz ediyoruz. Tutarlı bir kayıptan kaçınma modeli gelecekteki satış işlemlerinin fiyattaki düşüşleri öngörebileceğini düşündürebilir. Bu analiz her işlemi takip eden bir yıllık süreyi kapsar ve sonuçlar teoriktir .
Aşağıdaki tablo, otomatik ticaret planının parçası olmayan en son açık piyasa satışlarını göstermektedir.
Düzeltilmiş Fiyat, bölünmüş olarak düzeltilmiş fiyattır. Düzeltilmiş Hisseler , bölünmüş olarak düzeltilmiş hisselerdir.
İçeriden Öğrenen Alımları CYRX / Cryoport, Inc. - Kısa Vadeli Kâr Analizi
Bu bölümde, ANNX / Annexon, Inc. yılında yapılan her planlanmamış, açık piyasada içeriden öğrenen alımlarının kârlılığını analiz ediyoruz. Bu analiz, içeriden öğrenen kişinin sürekli olarak anormal getiriler sağlayıp sağlamadığını ve takip edilmeye değer olup olmadığını anlamaya yardımcı olur. Bu analiz her işlemi takip eden bir yıllık süreyi kapsar ve sonuçlar teoriktir .
Aşağıdaki tablo, otomatik ticaret planının parçası olmayan en son açık piyasa alımlarını göstermektedir.
| İşlem Tarihi | Ticker | İçeriden Öğrenen | Bildirilmiş Hisseler |
Bildirilmiş Fiyat |
Düzeltilmiş Hisseler |
Düzeltilmiş Fiyat |
Maliyet Esası | Gün | Fiyat Maks |
Maks Kâr ($) |
Maks Getiri (%) |
|---|---|---|---|---|---|---|---|
| Bu içeriden öğrenilenler ve güvenlik kombinasyonu için bilinen planlanmamış açık piyasa ticareti yoktur. |
Düzeltilmiş Fiyat, bölünmüş olarak düzeltilmiş fiyattır. Düzeltilmiş Hisseler , bölünmüş olarak düzeltilmiş hisselerdir.
İçeriden Öğrenenlerin Satışları CYRX / Cryoport, Inc. - Kısa Vadeli Zarar Analizi
Bu bölümde, ANNX / Annexon, Inc. yılında yapılan her planlanmamış, açık piyasa içeriden öğrenen satışın kısa vadeli zarardan kaçınma yöntemini analiz ediyoruz. Tutarlı bir kayıptan kaçınma modeli gelecekteki satış işlemlerinin fiyattaki düşüşleri öngörebileceğini düşündürebilir. Bu analiz her işlemi takip eden bir yıllık süreyi kapsar ve sonuçlar teoriktir .
Aşağıdaki tablo, otomatik ticaret planının parçası olmayan en son açık piyasa satışlarını göstermektedir.
Düzeltilmiş Fiyat, bölünmüş olarak düzeltilmiş fiyattır. Düzeltilmiş Hisseler , bölünmüş olarak düzeltilmiş hisselerdir.
İçeriden Öğrenen Alımları ELLA / Ellington Credit Company - Kısa Vadeli Kâr Analizi
Bu bölümde, ANNX / Annexon, Inc. yılında yapılan her planlanmamış, açık piyasada içeriden öğrenen alımlarının kârlılığını analiz ediyoruz. Bu analiz, içeriden öğrenen kişinin sürekli olarak anormal getiriler sağlayıp sağlamadığını ve takip edilmeye değer olup olmadığını anlamaya yardımcı olur. Bu analiz her işlemi takip eden bir yıllık süreyi kapsar ve sonuçlar teoriktir .
Aşağıdaki tablo, otomatik ticaret planının parçası olmayan en son açık piyasa alımlarını göstermektedir.
Düzeltilmiş Fiyat, bölünmüş olarak düzeltilmiş fiyattır. Düzeltilmiş Hisseler , bölünmüş olarak düzeltilmiş hisselerdir.
İçeriden Öğrenenlerin Satışları ELLA / Ellington Credit Company - Kısa Vadeli Zarar Analizi
Bu bölümde, ANNX / Annexon, Inc. yılında yapılan her planlanmamış, açık piyasa içeriden öğrenen satışın kısa vadeli zarardan kaçınma yöntemini analiz ediyoruz. Tutarlı bir kayıptan kaçınma modeli gelecekteki satış işlemlerinin fiyattaki düşüşleri öngörebileceğini düşündürebilir. Bu analiz her işlemi takip eden bir yıllık süreyi kapsar ve sonuçlar teoriktir .
Aşağıdaki tablo, otomatik ticaret planının parçası olmayan en son açık piyasa satışlarını göstermektedir.
| İşlem Tarihi | Ticker | İçeriden Öğrenen | Bildirilmiş Hisseler |
Bildirilmiş Fiyat |
Düzeltilmiş Hisseler |
Düzeltilmiş Fiyat |
Maliyet Esası | Gün Min |
Fiyat Min |
Maks Kayıp Kaçınılan ($) |
Maks Kayıp Kaçınılan (%) |
|---|---|---|---|---|---|---|---|---|---|---|---|
| 2021-06-17 | EARN | Blackstone Holdings III L.P. | 2.675.000 | 12,8000 | 2.675.000 | 12,8000 | 34.240.000 | 6 |
Düzeltilmiş Fiyat, bölünmüş olarak düzeltilmiş fiyattır. Düzeltilmiş Hisseler , bölünmüş olarak düzeltilmiş hisselerdir.
İçeriden Öğrenen Alımları EXE / Expand Energy Corporation - Kısa Vadeli Kâr Analizi
Bu bölümde, ANNX / Annexon, Inc. yılında yapılan her planlanmamış, açık piyasada içeriden öğrenen alımlarının kârlılığını analiz ediyoruz. Bu analiz, içeriden öğrenen kişinin sürekli olarak anormal getiriler sağlayıp sağlamadığını ve takip edilmeye değer olup olmadığını anlamaya yardımcı olur. Bu analiz her işlemi takip eden bir yıllık süreyi kapsar ve sonuçlar teoriktir .
Aşağıdaki tablo, otomatik ticaret planının parçası olmayan en son açık piyasa alımlarını göstermektedir.
| İşlem Tarihi | Ticker | İçeriden Öğrenen | Bildirilmiş Hisseler |
Bildirilmiş Fiyat |
Düzeltilmiş Hisseler |
Düzeltilmiş Fiyat |
Maliyet Esası | Gün | Fiyat Maks |
Maks Kâr ($) |
Maks Getiri (%) |
|---|---|---|---|---|---|---|---|
| Bu içeriden öğrenilenler ve güvenlik kombinasyonu için bilinen planlanmamış açık piyasa ticareti yoktur. |
Düzeltilmiş Fiyat, bölünmüş olarak düzeltilmiş fiyattır. Düzeltilmiş Hisseler , bölünmüş olarak düzeltilmiş hisselerdir.
İçeriden Öğrenenlerin Satışları EXE / Expand Energy Corporation - Kısa Vadeli Zarar Analizi
Bu bölümde, ANNX / Annexon, Inc. yılında yapılan her planlanmamış, açık piyasa içeriden öğrenen satışın kısa vadeli zarardan kaçınma yöntemini analiz ediyoruz. Tutarlı bir kayıptan kaçınma modeli gelecekteki satış işlemlerinin fiyattaki düşüşleri öngörebileceğini düşündürebilir. Bu analiz her işlemi takip eden bir yıllık süreyi kapsar ve sonuçlar teoriktir .
Aşağıdaki tablo, otomatik ticaret planının parçası olmayan en son açık piyasa satışlarını göstermektedir.
Düzeltilmiş Fiyat, bölünmüş olarak düzeltilmiş fiyattır. Düzeltilmiş Hisseler , bölünmüş olarak düzeltilmiş hisselerdir.
İçeriden Öğrenen Alımları FOA / Finance of America Companies Inc. - Kısa Vadeli Kâr Analizi
Bu bölümde, ANNX / Annexon, Inc. yılında yapılan her planlanmamış, açık piyasada içeriden öğrenen alımlarının kârlılığını analiz ediyoruz. Bu analiz, içeriden öğrenen kişinin sürekli olarak anormal getiriler sağlayıp sağlamadığını ve takip edilmeye değer olup olmadığını anlamaya yardımcı olur. Bu analiz her işlemi takip eden bir yıllık süreyi kapsar ve sonuçlar teoriktir .
Aşağıdaki tablo, otomatik ticaret planının parçası olmayan en son açık piyasa alımlarını göstermektedir.
| İşlem Tarihi | Ticker | İçeriden Öğrenen | Bildirilmiş Hisseler |
Bildirilmiş Fiyat |
Düzeltilmiş Hisseler |
Düzeltilmiş Fiyat |
Maliyet Esası | Gün | Fiyat Maks |
Maks Kâr ($) |
Maks Getiri (%) |
|---|---|---|---|---|---|---|---|
| Bu içeriden öğrenilenler ve güvenlik kombinasyonu için bilinen planlanmamış açık piyasa ticareti yoktur. |
Düzeltilmiş Fiyat, bölünmüş olarak düzeltilmiş fiyattır. Düzeltilmiş Hisseler , bölünmüş olarak düzeltilmiş hisselerdir.
İçeriden Öğrenenlerin Satışları FOA / Finance of America Companies Inc. - Kısa Vadeli Zarar Analizi
Bu bölümde, ANNX / Annexon, Inc. yılında yapılan her planlanmamış, açık piyasa içeriden öğrenen satışın kısa vadeli zarardan kaçınma yöntemini analiz ediyoruz. Tutarlı bir kayıptan kaçınma modeli gelecekteki satış işlemlerinin fiyattaki düşüşleri öngörebileceğini düşündürebilir. Bu analiz her işlemi takip eden bir yıllık süreyi kapsar ve sonuçlar teoriktir .
Aşağıdaki tablo, otomatik ticaret planının parçası olmayan en son açık piyasa satışlarını göstermektedir.
| İşlem Tarihi | Ticker | İçeriden Öğrenen | Bildirilmiş Hisseler |
Bildirilmiş Fiyat |
Düzeltilmiş Hisseler |
Düzeltilmiş Fiyat |
Maliyet Esası | Gün Min |
Fiyat Min |
Maks Kayıp Kaçınılan ($) |
Maks Kayıp Kaçınılan (%) |
|---|---|---|---|---|---|---|---|
| Bu içeriden öğrenilenler ve güvenlik kombinasyonu için bilinen planlanmamış açık piyasa ticareti yoktur. |
Düzeltilmiş Fiyat, bölünmüş olarak düzeltilmiş fiyattır. Düzeltilmiş Hisseler , bölünmüş olarak düzeltilmiş hisselerdir.
İçeriden Öğrenen Alımları GRTX / Galera Therapeutics, Inc. - Kısa Vadeli Kâr Analizi
Bu bölümde, ANNX / Annexon, Inc. yılında yapılan her planlanmamış, açık piyasada içeriden öğrenen alımlarının kârlılığını analiz ediyoruz. Bu analiz, içeriden öğrenen kişinin sürekli olarak anormal getiriler sağlayıp sağlamadığını ve takip edilmeye değer olup olmadığını anlamaya yardımcı olur. Bu analiz her işlemi takip eden bir yıllık süreyi kapsar ve sonuçlar teoriktir .
Aşağıdaki tablo, otomatik ticaret planının parçası olmayan en son açık piyasa alımlarını göstermektedir.
Düzeltilmiş Fiyat, bölünmüş olarak düzeltilmiş fiyattır. Düzeltilmiş Hisseler , bölünmüş olarak düzeltilmiş hisselerdir.
İçeriden Öğrenenlerin Satışları GRTX / Galera Therapeutics, Inc. - Kısa Vadeli Zarar Analizi
Bu bölümde, ANNX / Annexon, Inc. yılında yapılan her planlanmamış, açık piyasa içeriden öğrenen satışın kısa vadeli zarardan kaçınma yöntemini analiz ediyoruz. Tutarlı bir kayıptan kaçınma modeli gelecekteki satış işlemlerinin fiyattaki düşüşleri öngörebileceğini düşündürebilir. Bu analiz her işlemi takip eden bir yıllık süreyi kapsar ve sonuçlar teoriktir .
Aşağıdaki tablo, otomatik ticaret planının parçası olmayan en son açık piyasa satışlarını göstermektedir.
| İşlem Tarihi | Ticker | İçeriden Öğrenen | Bildirilmiş Hisseler |
Bildirilmiş Fiyat |
Düzeltilmiş Hisseler |
Düzeltilmiş Fiyat |
Maliyet Esası | Gün Min |
Fiyat Min |
Maks Kayıp Kaçınılan ($) |
Maks Kayıp Kaçınılan (%) |
|---|---|---|---|---|---|---|---|
| Bu içeriden öğrenilenler ve güvenlik kombinasyonu için bilinen planlanmamış açık piyasa ticareti yoktur. |
Düzeltilmiş Fiyat, bölünmüş olarak düzeltilmiş fiyattır. Düzeltilmiş Hisseler , bölünmüş olarak düzeltilmiş hisselerdir.
İçeriden Öğrenen Alımları GTES / Gates Industrial Corporation plc - Kısa Vadeli Kâr Analizi
Bu bölümde, ANNX / Annexon, Inc. yılında yapılan her planlanmamış, açık piyasada içeriden öğrenen alımlarının kârlılığını analiz ediyoruz. Bu analiz, içeriden öğrenen kişinin sürekli olarak anormal getiriler sağlayıp sağlamadığını ve takip edilmeye değer olup olmadığını anlamaya yardımcı olur. Bu analiz her işlemi takip eden bir yıllık süreyi kapsar ve sonuçlar teoriktir .
Aşağıdaki tablo, otomatik ticaret planının parçası olmayan en son açık piyasa alımlarını göstermektedir.
Düzeltilmiş Fiyat, bölünmüş olarak düzeltilmiş fiyattır. Düzeltilmiş Hisseler , bölünmüş olarak düzeltilmiş hisselerdir.
İçeriden Öğrenenlerin Satışları GTES / Gates Industrial Corporation plc - Kısa Vadeli Zarar Analizi
Bu bölümde, ANNX / Annexon, Inc. yılında yapılan her planlanmamış, açık piyasa içeriden öğrenen satışın kısa vadeli zarardan kaçınma yöntemini analiz ediyoruz. Tutarlı bir kayıptan kaçınma modeli gelecekteki satış işlemlerinin fiyattaki düşüşleri öngörebileceğini düşündürebilir. Bu analiz her işlemi takip eden bir yıllık süreyi kapsar ve sonuçlar teoriktir .
Aşağıdaki tablo, otomatik ticaret planının parçası olmayan en son açık piyasa satışlarını göstermektedir.
Düzeltilmiş Fiyat, bölünmüş olarak düzeltilmiş fiyattır. Düzeltilmiş Hisseler , bölünmüş olarak düzeltilmiş hisselerdir.
İçeriden Öğrenen Alımları HGV / Hilton Grand Vacations Inc. - Kısa Vadeli Kâr Analizi
Bu bölümde, ANNX / Annexon, Inc. yılında yapılan her planlanmamış, açık piyasada içeriden öğrenen alımlarının kârlılığını analiz ediyoruz. Bu analiz, içeriden öğrenen kişinin sürekli olarak anormal getiriler sağlayıp sağlamadığını ve takip edilmeye değer olup olmadığını anlamaya yardımcı olur. Bu analiz her işlemi takip eden bir yıllık süreyi kapsar ve sonuçlar teoriktir .
Aşağıdaki tablo, otomatik ticaret planının parçası olmayan en son açık piyasa alımlarını göstermektedir.
| İşlem Tarihi | Ticker | İçeriden Öğrenen | Bildirilmiş Hisseler |
Bildirilmiş Fiyat |
Düzeltilmiş Hisseler |
Düzeltilmiş Fiyat |
Maliyet Esası | Gün | Fiyat Maks |
Maks Kâr ($) |
Maks Getiri (%) |
|---|---|---|---|---|---|---|---|
| Bu içeriden öğrenilenler ve güvenlik kombinasyonu için bilinen planlanmamış açık piyasa ticareti yoktur. |
Düzeltilmiş Fiyat, bölünmüş olarak düzeltilmiş fiyattır. Düzeltilmiş Hisseler , bölünmüş olarak düzeltilmiş hisselerdir.
İçeriden Öğrenenlerin Satışları HGV / Hilton Grand Vacations Inc. - Kısa Vadeli Zarar Analizi
Bu bölümde, ANNX / Annexon, Inc. yılında yapılan her planlanmamış, açık piyasa içeriden öğrenen satışın kısa vadeli zarardan kaçınma yöntemini analiz ediyoruz. Tutarlı bir kayıptan kaçınma modeli gelecekteki satış işlemlerinin fiyattaki düşüşleri öngörebileceğini düşündürebilir. Bu analiz her işlemi takip eden bir yıllık süreyi kapsar ve sonuçlar teoriktir .
Aşağıdaki tablo, otomatik ticaret planının parçası olmayan en son açık piyasa satışlarını göstermektedir.
Düzeltilmiş Fiyat, bölünmüş olarak düzeltilmiş fiyattır. Düzeltilmiş Hisseler , bölünmüş olarak düzeltilmiş hisselerdir.
İçeriden Öğrenen Alımları HPP / Hudson Pacific Properties, Inc. - Kısa Vadeli Kâr Analizi
Bu bölümde, ANNX / Annexon, Inc. yılında yapılan her planlanmamış, açık piyasada içeriden öğrenen alımlarının kârlılığını analiz ediyoruz. Bu analiz, içeriden öğrenen kişinin sürekli olarak anormal getiriler sağlayıp sağlamadığını ve takip edilmeye değer olup olmadığını anlamaya yardımcı olur. Bu analiz her işlemi takip eden bir yıllık süreyi kapsar ve sonuçlar teoriktir .
Aşağıdaki tablo, otomatik ticaret planının parçası olmayan en son açık piyasa alımlarını göstermektedir.
| İşlem Tarihi | Ticker | İçeriden Öğrenen | Bildirilmiş Hisseler |
Bildirilmiş Fiyat |
Düzeltilmiş Hisseler |
Düzeltilmiş Fiyat |
Maliyet Esası | Gün | Fiyat Maks |
Maks Kâr ($) |
Maks Getiri (%) |
|---|---|---|---|---|---|---|---|
| Bu içeriden öğrenilenler ve güvenlik kombinasyonu için bilinen planlanmamış açık piyasa ticareti yoktur. |
Düzeltilmiş Fiyat, bölünmüş olarak düzeltilmiş fiyattır. Düzeltilmiş Hisseler , bölünmüş olarak düzeltilmiş hisselerdir.
İçeriden Öğrenenlerin Satışları HPP / Hudson Pacific Properties, Inc. - Kısa Vadeli Zarar Analizi
Bu bölümde, ANNX / Annexon, Inc. yılında yapılan her planlanmamış, açık piyasa içeriden öğrenen satışın kısa vadeli zarardan kaçınma yöntemini analiz ediyoruz. Tutarlı bir kayıptan kaçınma modeli gelecekteki satış işlemlerinin fiyattaki düşüşleri öngörebileceğini düşündürebilir. Bu analiz her işlemi takip eden bir yıllık süreyi kapsar ve sonuçlar teoriktir .
Aşağıdaki tablo, otomatik ticaret planının parçası olmayan en son açık piyasa satışlarını göstermektedir.
Düzeltilmiş Fiyat, bölünmüş olarak düzeltilmiş fiyattır. Düzeltilmiş Hisseler , bölünmüş olarak düzeltilmiş hisselerdir.
İçeriden Öğrenen Alımları KNTK / Kinetik Holdings Inc. - Kısa Vadeli Kâr Analizi
Bu bölümde, ANNX / Annexon, Inc. yılında yapılan her planlanmamış, açık piyasada içeriden öğrenen alımlarının kârlılığını analiz ediyoruz. Bu analiz, içeriden öğrenen kişinin sürekli olarak anormal getiriler sağlayıp sağlamadığını ve takip edilmeye değer olup olmadığını anlamaya yardımcı olur. Bu analiz her işlemi takip eden bir yıllık süreyi kapsar ve sonuçlar teoriktir .
Aşağıdaki tablo, otomatik ticaret planının parçası olmayan en son açık piyasa alımlarını göstermektedir.
| İşlem Tarihi | Ticker | İçeriden Öğrenen | Bildirilmiş Hisseler |
Bildirilmiş Fiyat |
Düzeltilmiş Hisseler |
Düzeltilmiş Fiyat |
Maliyet Esası | Gün | Fiyat Maks |
Maks Kâr ($) |
Maks Getiri (%) |
|---|---|---|---|---|---|---|---|
| Bu içeriden öğrenilenler ve güvenlik kombinasyonu için bilinen planlanmamış açık piyasa ticareti yoktur. |
Düzeltilmiş Fiyat, bölünmüş olarak düzeltilmiş fiyattır. Düzeltilmiş Hisseler , bölünmüş olarak düzeltilmiş hisselerdir.
İçeriden Öğrenenlerin Satışları KNTK / Kinetik Holdings Inc. - Kısa Vadeli Zarar Analizi
Bu bölümde, ANNX / Annexon, Inc. yılında yapılan her planlanmamış, açık piyasa içeriden öğrenen satışın kısa vadeli zarardan kaçınma yöntemini analiz ediyoruz. Tutarlı bir kayıptan kaçınma modeli gelecekteki satış işlemlerinin fiyattaki düşüşleri öngörebileceğini düşündürebilir. Bu analiz her işlemi takip eden bir yıllık süreyi kapsar ve sonuçlar teoriktir .
Aşağıdaki tablo, otomatik ticaret planının parçası olmayan en son açık piyasa satışlarını göstermektedir.
| İşlem Tarihi | Ticker | İçeriden Öğrenen | Bildirilmiş Hisseler |
Bildirilmiş Fiyat |
Düzeltilmiş Hisseler |
Düzeltilmiş Fiyat |
Maliyet Esası | Gün Min |
Fiyat Min |
Maks Kayıp Kaçınılan ($) |
Maks Kayıp Kaçınılan (%) |
|---|---|---|---|---|---|---|---|
| Bu içeriden öğrenilenler ve güvenlik kombinasyonu için bilinen planlanmamış açık piyasa ticareti yoktur. |
Düzeltilmiş Fiyat, bölünmüş olarak düzeltilmiş fiyattır. Düzeltilmiş Hisseler , bölünmüş olarak düzeltilmiş hisselerdir.
İçeriden Öğrenen Alımları KOS / Kosmos Energy Ltd. - Kısa Vadeli Kâr Analizi
Bu bölümde, ANNX / Annexon, Inc. yılında yapılan her planlanmamış, açık piyasada içeriden öğrenen alımlarının kârlılığını analiz ediyoruz. Bu analiz, içeriden öğrenen kişinin sürekli olarak anormal getiriler sağlayıp sağlamadığını ve takip edilmeye değer olup olmadığını anlamaya yardımcı olur. Bu analiz her işlemi takip eden bir yıllık süreyi kapsar ve sonuçlar teoriktir .
Aşağıdaki tablo, otomatik ticaret planının parçası olmayan en son açık piyasa alımlarını göstermektedir.
| İşlem Tarihi | Ticker | İçeriden Öğrenen | Bildirilmiş Hisseler |
Bildirilmiş Fiyat |
Düzeltilmiş Hisseler |
Düzeltilmiş Fiyat |
Maliyet Esası | Gün | Fiyat Maks |
Maks Kâr ($) |
Maks Getiri (%) |
|---|---|---|---|---|---|---|---|
| Bu içeriden öğrenilenler ve güvenlik kombinasyonu için bilinen planlanmamış açık piyasa ticareti yoktur. |
Düzeltilmiş Fiyat, bölünmüş olarak düzeltilmiş fiyattır. Düzeltilmiş Hisseler , bölünmüş olarak düzeltilmiş hisselerdir.
İçeriden Öğrenenlerin Satışları KOS / Kosmos Energy Ltd. - Kısa Vadeli Zarar Analizi
Bu bölümde, ANNX / Annexon, Inc. yılında yapılan her planlanmamış, açık piyasa içeriden öğrenen satışın kısa vadeli zarardan kaçınma yöntemini analiz ediyoruz. Tutarlı bir kayıptan kaçınma modeli gelecekteki satış işlemlerinin fiyattaki düşüşleri öngörebileceğini düşündürebilir. Bu analiz her işlemi takip eden bir yıllık süreyi kapsar ve sonuçlar teoriktir .
Aşağıdaki tablo, otomatik ticaret planının parçası olmayan en son açık piyasa satışlarını göstermektedir.
Düzeltilmiş Fiyat, bölünmüş olarak düzeltilmiş fiyattır. Düzeltilmiş Hisseler , bölünmüş olarak düzeltilmiş hisselerdir.
İçeriden Öğrenen Alımları LNG / Cheniere Energy, Inc. - Kısa Vadeli Kâr Analizi
Bu bölümde, ANNX / Annexon, Inc. yılında yapılan her planlanmamış, açık piyasada içeriden öğrenen alımlarının kârlılığını analiz ediyoruz. Bu analiz, içeriden öğrenen kişinin sürekli olarak anormal getiriler sağlayıp sağlamadığını ve takip edilmeye değer olup olmadığını anlamaya yardımcı olur. Bu analiz her işlemi takip eden bir yıllık süreyi kapsar ve sonuçlar teoriktir .
Aşağıdaki tablo, otomatik ticaret planının parçası olmayan en son açık piyasa alımlarını göstermektedir.
| İşlem Tarihi | Ticker | İçeriden Öğrenen | Bildirilmiş Hisseler |
Bildirilmiş Fiyat |
Düzeltilmiş Hisseler |
Düzeltilmiş Fiyat |
Maliyet Esası | Gün | Fiyat Maks |
Maks Kâr ($) |
Maks Getiri (%) |
|---|---|---|---|---|---|---|---|
| Bu içeriden öğrenilenler ve güvenlik kombinasyonu için bilinen planlanmamış açık piyasa ticareti yoktur. |
Düzeltilmiş Fiyat, bölünmüş olarak düzeltilmiş fiyattır. Düzeltilmiş Hisseler , bölünmüş olarak düzeltilmiş hisselerdir.
İçeriden Öğrenenlerin Satışları LNG / Cheniere Energy, Inc. - Kısa Vadeli Zarar Analizi
Bu bölümde, ANNX / Annexon, Inc. yılında yapılan her planlanmamış, açık piyasa içeriden öğrenen satışın kısa vadeli zarardan kaçınma yöntemini analiz ediyoruz. Tutarlı bir kayıptan kaçınma modeli gelecekteki satış işlemlerinin fiyattaki düşüşleri öngörebileceğini düşündürebilir. Bu analiz her işlemi takip eden bir yıllık süreyi kapsar ve sonuçlar teoriktir .
Aşağıdaki tablo, otomatik ticaret planının parçası olmayan en son açık piyasa satışlarını göstermektedir.
| İşlem Tarihi | Ticker | İçeriden Öğrenen | Bildirilmiş Hisseler |
Bildirilmiş Fiyat |
Düzeltilmiş Hisseler |
Düzeltilmiş Fiyat |
Maliyet Esası | Gün Min |
Fiyat Min |
Maks Kayıp Kaçınılan ($) |
Maks Kayıp Kaçınılan (%) |
|---|---|---|---|---|---|---|---|
| Bu içeriden öğrenilenler ve güvenlik kombinasyonu için bilinen planlanmamış açık piyasa ticareti yoktur. |
Düzeltilmiş Fiyat, bölünmüş olarak düzeltilmiş fiyattır. Düzeltilmiş Hisseler , bölünmüş olarak düzeltilmiş hisselerdir.
İçeriden Öğrenen Alımları LQ / Simplify Exchange Traded Funds - Simplify Tax Aware Alternatives ETF - Kısa Vadeli Kâr Analizi
Bu bölümde, ANNX / Annexon, Inc. yılında yapılan her planlanmamış, açık piyasada içeriden öğrenen alımlarının kârlılığını analiz ediyoruz. Bu analiz, içeriden öğrenen kişinin sürekli olarak anormal getiriler sağlayıp sağlamadığını ve takip edilmeye değer olup olmadığını anlamaya yardımcı olur. Bu analiz her işlemi takip eden bir yıllık süreyi kapsar ve sonuçlar teoriktir .
Aşağıdaki tablo, otomatik ticaret planının parçası olmayan en son açık piyasa alımlarını göstermektedir.
| İşlem Tarihi | Ticker | İçeriden Öğrenen | Bildirilmiş Hisseler |
Bildirilmiş Fiyat |
Düzeltilmiş Hisseler |
Düzeltilmiş Fiyat |
Maliyet Esası | Gün | Fiyat Maks |
Maks Kâr ($) |
Maks Getiri (%) |
|---|---|---|---|---|---|---|---|
| Bu içeriden öğrenilenler ve güvenlik kombinasyonu için bilinen planlanmamış açık piyasa ticareti yoktur. |
Düzeltilmiş Fiyat, bölünmüş olarak düzeltilmiş fiyattır. Düzeltilmiş Hisseler , bölünmüş olarak düzeltilmiş hisselerdir.
İçeriden Öğrenenlerin Satışları LQ / Simplify Exchange Traded Funds - Simplify Tax Aware Alternatives ETF - Kısa Vadeli Zarar Analizi
Bu bölümde, ANNX / Annexon, Inc. yılında yapılan her planlanmamış, açık piyasa içeriden öğrenen satışın kısa vadeli zarardan kaçınma yöntemini analiz ediyoruz. Tutarlı bir kayıptan kaçınma modeli gelecekteki satış işlemlerinin fiyattaki düşüşleri öngörebileceğini düşündürebilir. Bu analiz her işlemi takip eden bir yıllık süreyi kapsar ve sonuçlar teoriktir .
Aşağıdaki tablo, otomatik ticaret planının parçası olmayan en son açık piyasa satışlarını göstermektedir.
Düzeltilmiş Fiyat, bölünmüş olarak düzeltilmiş fiyattır. Düzeltilmiş Hisseler , bölünmüş olarak düzeltilmiş hisselerdir.
İçeriden Öğrenen Alımları NCRRP / NCR Voyix Corporation - Preferred Security - Kısa Vadeli Kâr Analizi
Bu bölümde, ANNX / Annexon, Inc. yılında yapılan her planlanmamış, açık piyasada içeriden öğrenen alımlarının kârlılığını analiz ediyoruz. Bu analiz, içeriden öğrenen kişinin sürekli olarak anormal getiriler sağlayıp sağlamadığını ve takip edilmeye değer olup olmadığını anlamaya yardımcı olur. Bu analiz her işlemi takip eden bir yıllık süreyi kapsar ve sonuçlar teoriktir .
Aşağıdaki tablo, otomatik ticaret planının parçası olmayan en son açık piyasa alımlarını göstermektedir.
| İşlem Tarihi | Ticker | İçeriden Öğrenen | Bildirilmiş Hisseler |
Bildirilmiş Fiyat |
Düzeltilmiş Hisseler |
Düzeltilmiş Fiyat |
Maliyet Esası | Gün | Fiyat Maks |
Maks Kâr ($) |
Maks Getiri (%) |
|---|---|---|---|---|---|---|---|
| Bu içeriden öğrenilenler ve güvenlik kombinasyonu için bilinen planlanmamış açık piyasa ticareti yoktur. |
Düzeltilmiş Fiyat, bölünmüş olarak düzeltilmiş fiyattır. Düzeltilmiş Hisseler , bölünmüş olarak düzeltilmiş hisselerdir.
İçeriden Öğrenenlerin Satışları NCRRP / NCR Voyix Corporation - Preferred Security - Kısa Vadeli Zarar Analizi
Bu bölümde, ANNX / Annexon, Inc. yılında yapılan her planlanmamış, açık piyasa içeriden öğrenen satışın kısa vadeli zarardan kaçınma yöntemini analiz ediyoruz. Tutarlı bir kayıptan kaçınma modeli gelecekteki satış işlemlerinin fiyattaki düşüşleri öngörebileceğini düşündürebilir. Bu analiz her işlemi takip eden bir yıllık süreyi kapsar ve sonuçlar teoriktir .
Aşağıdaki tablo, otomatik ticaret planının parçası olmayan en son açık piyasa satışlarını göstermektedir.
Düzeltilmiş Fiyat, bölünmüş olarak düzeltilmiş fiyattır. Düzeltilmiş Hisseler , bölünmüş olarak düzeltilmiş hisselerdir.
İçeriden Öğrenen Alımları OPFI / OppFi Inc. - Kısa Vadeli Kâr Analizi
Bu bölümde, ANNX / Annexon, Inc. yılında yapılan her planlanmamış, açık piyasada içeriden öğrenen alımlarının kârlılığını analiz ediyoruz. Bu analiz, içeriden öğrenen kişinin sürekli olarak anormal getiriler sağlayıp sağlamadığını ve takip edilmeye değer olup olmadığını anlamaya yardımcı olur. Bu analiz her işlemi takip eden bir yıllık süreyi kapsar ve sonuçlar teoriktir .
Aşağıdaki tablo, otomatik ticaret planının parçası olmayan en son açık piyasa alımlarını göstermektedir.
| İşlem Tarihi | Ticker | İçeriden Öğrenen | Bildirilmiş Hisseler |
Bildirilmiş Fiyat |
Düzeltilmiş Hisseler |
Düzeltilmiş Fiyat |
Maliyet Esası | Gün | Fiyat Maks |
Maks Kâr ($) |
Maks Getiri (%) |
|---|---|---|---|---|---|---|---|
| Bu içeriden öğrenilenler ve güvenlik kombinasyonu için bilinen planlanmamış açık piyasa ticareti yoktur. |
Düzeltilmiş Fiyat, bölünmüş olarak düzeltilmiş fiyattır. Düzeltilmiş Hisseler , bölünmüş olarak düzeltilmiş hisselerdir.
İçeriden Öğrenenlerin Satışları OPFI / OppFi Inc. - Kısa Vadeli Zarar Analizi
Bu bölümde, ANNX / Annexon, Inc. yılında yapılan her planlanmamış, açık piyasa içeriden öğrenen satışın kısa vadeli zarardan kaçınma yöntemini analiz ediyoruz. Tutarlı bir kayıptan kaçınma modeli gelecekteki satış işlemlerinin fiyattaki düşüşleri öngörebileceğini düşündürebilir. Bu analiz her işlemi takip eden bir yıllık süreyi kapsar ve sonuçlar teoriktir .
Aşağıdaki tablo, otomatik ticaret planının parçası olmayan en son açık piyasa satışlarını göstermektedir.
Düzeltilmiş Fiyat, bölünmüş olarak düzeltilmiş fiyattır. Düzeltilmiş Hisseler , bölünmüş olarak düzeltilmiş hisselerdir.
İçeriden Öğrenen Alımları PACK / Ranpak Holdings Corp. - Kısa Vadeli Kâr Analizi
Bu bölümde, ANNX / Annexon, Inc. yılında yapılan her planlanmamış, açık piyasada içeriden öğrenen alımlarının kârlılığını analiz ediyoruz. Bu analiz, içeriden öğrenen kişinin sürekli olarak anormal getiriler sağlayıp sağlamadığını ve takip edilmeye değer olup olmadığını anlamaya yardımcı olur. Bu analiz her işlemi takip eden bir yıllık süreyi kapsar ve sonuçlar teoriktir .
Aşağıdaki tablo, otomatik ticaret planının parçası olmayan en son açık piyasa alımlarını göstermektedir.
Düzeltilmiş Fiyat, bölünmüş olarak düzeltilmiş fiyattır. Düzeltilmiş Hisseler , bölünmüş olarak düzeltilmiş hisselerdir.
İçeriden Öğrenenlerin Satışları PACK / Ranpak Holdings Corp. - Kısa Vadeli Zarar Analizi
Bu bölümde, ANNX / Annexon, Inc. yılında yapılan her planlanmamış, açık piyasa içeriden öğrenen satışın kısa vadeli zarardan kaçınma yöntemini analiz ediyoruz. Tutarlı bir kayıptan kaçınma modeli gelecekteki satış işlemlerinin fiyattaki düşüşleri öngörebileceğini düşündürebilir. Bu analiz her işlemi takip eden bir yıllık süreyi kapsar ve sonuçlar teoriktir .
Aşağıdaki tablo, otomatik ticaret planının parçası olmayan en son açık piyasa satışlarını göstermektedir.
Düzeltilmiş Fiyat, bölünmüş olarak düzeltilmiş fiyattır. Düzeltilmiş Hisseler , bölünmüş olarak düzeltilmiş hisselerdir.
İçeriden Öğrenen Alımları PBF / PBF Energy Inc. - Kısa Vadeli Kâr Analizi
Bu bölümde, ANNX / Annexon, Inc. yılında yapılan her planlanmamış, açık piyasada içeriden öğrenen alımlarının kârlılığını analiz ediyoruz. Bu analiz, içeriden öğrenen kişinin sürekli olarak anormal getiriler sağlayıp sağlamadığını ve takip edilmeye değer olup olmadığını anlamaya yardımcı olur. Bu analiz her işlemi takip eden bir yıllık süreyi kapsar ve sonuçlar teoriktir .
Aşağıdaki tablo, otomatik ticaret planının parçası olmayan en son açık piyasa alımlarını göstermektedir.
| İşlem Tarihi | Ticker | İçeriden Öğrenen | Bildirilmiş Hisseler |
Bildirilmiş Fiyat |
Düzeltilmiş Hisseler |
Düzeltilmiş Fiyat |
Maliyet Esası | Gün | Fiyat Maks |
Maks Kâr ($) |
Maks Getiri (%) |
|---|---|---|---|---|---|---|---|
| Bu içeriden öğrenilenler ve güvenlik kombinasyonu için bilinen planlanmamış açık piyasa ticareti yoktur. |
Düzeltilmiş Fiyat, bölünmüş olarak düzeltilmiş fiyattır. Düzeltilmiş Hisseler , bölünmüş olarak düzeltilmiş hisselerdir.
İçeriden Öğrenenlerin Satışları PBF / PBF Energy Inc. - Kısa Vadeli Zarar Analizi
Bu bölümde, ANNX / Annexon, Inc. yılında yapılan her planlanmamış, açık piyasa içeriden öğrenen satışın kısa vadeli zarardan kaçınma yöntemini analiz ediyoruz. Tutarlı bir kayıptan kaçınma modeli gelecekteki satış işlemlerinin fiyattaki düşüşleri öngörebileceğini düşündürebilir. Bu analiz her işlemi takip eden bir yıllık süreyi kapsar ve sonuçlar teoriktir .
Aşağıdaki tablo, otomatik ticaret planının parçası olmayan en son açık piyasa satışlarını göstermektedir.
Düzeltilmiş Fiyat, bölünmüş olarak düzeltilmiş fiyattır. Düzeltilmiş Hisseler , bölünmüş olarak düzeltilmiş hisselerdir.
İçeriden Öğrenen Alımları PFGC / Performance Food Group Company - Kısa Vadeli Kâr Analizi
Bu bölümde, ANNX / Annexon, Inc. yılında yapılan her planlanmamış, açık piyasada içeriden öğrenen alımlarının kârlılığını analiz ediyoruz. Bu analiz, içeriden öğrenen kişinin sürekli olarak anormal getiriler sağlayıp sağlamadığını ve takip edilmeye değer olup olmadığını anlamaya yardımcı olur. Bu analiz her işlemi takip eden bir yıllık süreyi kapsar ve sonuçlar teoriktir .
Aşağıdaki tablo, otomatik ticaret planının parçası olmayan en son açık piyasa alımlarını göstermektedir.
| İşlem Tarihi | Ticker | İçeriden Öğrenen | Bildirilmiş Hisseler |
Bildirilmiş Fiyat |
Düzeltilmiş Hisseler |
Düzeltilmiş Fiyat |
Maliyet Esası | Gün | Fiyat Maks |
Maks Kâr ($) |
Maks Getiri (%) |
|---|---|---|---|---|---|---|---|
| Bu içeriden öğrenilenler ve güvenlik kombinasyonu için bilinen planlanmamış açık piyasa ticareti yoktur. |
Düzeltilmiş Fiyat, bölünmüş olarak düzeltilmiş fiyattır. Düzeltilmiş Hisseler , bölünmüş olarak düzeltilmiş hisselerdir.
İçeriden Öğrenenlerin Satışları PFGC / Performance Food Group Company - Kısa Vadeli Zarar Analizi
Bu bölümde, ANNX / Annexon, Inc. yılında yapılan her planlanmamış, açık piyasa içeriden öğrenen satışın kısa vadeli zarardan kaçınma yöntemini analiz ediyoruz. Tutarlı bir kayıptan kaçınma modeli gelecekteki satış işlemlerinin fiyattaki düşüşleri öngörebileceğini düşündürebilir. Bu analiz her işlemi takip eden bir yıllık süreyi kapsar ve sonuçlar teoriktir .
Aşağıdaki tablo, otomatik ticaret planının parçası olmayan en son açık piyasa satışlarını göstermektedir.
Düzeltilmiş Fiyat, bölünmüş olarak düzeltilmiş fiyattır. Düzeltilmiş Hisseler , bölünmüş olarak düzeltilmiş hisselerdir.
İçeriden Öğrenen Alımları PJT / PJT Partners Inc. - Kısa Vadeli Kâr Analizi
Bu bölümde, ANNX / Annexon, Inc. yılında yapılan her planlanmamış, açık piyasada içeriden öğrenen alımlarının kârlılığını analiz ediyoruz. Bu analiz, içeriden öğrenen kişinin sürekli olarak anormal getiriler sağlayıp sağlamadığını ve takip edilmeye değer olup olmadığını anlamaya yardımcı olur. Bu analiz her işlemi takip eden bir yıllık süreyi kapsar ve sonuçlar teoriktir .
Aşağıdaki tablo, otomatik ticaret planının parçası olmayan en son açık piyasa alımlarını göstermektedir.
| İşlem Tarihi | Ticker | İçeriden Öğrenen | Bildirilmiş Hisseler |
Bildirilmiş Fiyat |
Düzeltilmiş Hisseler |
Düzeltilmiş Fiyat |
Maliyet Esası | Gün | Fiyat Maks |
Maks Kâr ($) |
Maks Getiri (%) |
|---|---|---|---|---|---|---|---|
| Bu içeriden öğrenilenler ve güvenlik kombinasyonu için bilinen planlanmamış açık piyasa ticareti yoktur. |
Düzeltilmiş Fiyat, bölünmüş olarak düzeltilmiş fiyattır. Düzeltilmiş Hisseler , bölünmüş olarak düzeltilmiş hisselerdir.
İçeriden Öğrenenlerin Satışları PJT / PJT Partners Inc. - Kısa Vadeli Zarar Analizi
Bu bölümde, ANNX / Annexon, Inc. yılında yapılan her planlanmamış, açık piyasa içeriden öğrenen satışın kısa vadeli zarardan kaçınma yöntemini analiz ediyoruz. Tutarlı bir kayıptan kaçınma modeli gelecekteki satış işlemlerinin fiyattaki düşüşleri öngörebileceğini düşündürebilir. Bu analiz her işlemi takip eden bir yıllık süreyi kapsar ve sonuçlar teoriktir .
Aşağıdaki tablo, otomatik ticaret planının parçası olmayan en son açık piyasa satışlarını göstermektedir.
| İşlem Tarihi | Ticker | İçeriden Öğrenen | Bildirilmiş Hisseler |
Bildirilmiş Fiyat |
Düzeltilmiş Hisseler |
Düzeltilmiş Fiyat |
Maliyet Esası | Gün Min |
Fiyat Min |
Maks Kayıp Kaçınılan ($) |
Maks Kayıp Kaçınılan (%) |
|---|---|---|---|---|---|---|---|
| Bu içeriden öğrenilenler ve güvenlik kombinasyonu için bilinen planlanmamış açık piyasa ticareti yoktur. |
Düzeltilmiş Fiyat, bölünmüş olarak düzeltilmiş fiyattır. Düzeltilmiş Hisseler , bölünmüş olarak düzeltilmiş hisselerdir.
İçeriden Öğrenen Alımları PK / Park Hotels & Resorts Inc. - Kısa Vadeli Kâr Analizi
Bu bölümde, ANNX / Annexon, Inc. yılında yapılan her planlanmamış, açık piyasada içeriden öğrenen alımlarının kârlılığını analiz ediyoruz. Bu analiz, içeriden öğrenen kişinin sürekli olarak anormal getiriler sağlayıp sağlamadığını ve takip edilmeye değer olup olmadığını anlamaya yardımcı olur. Bu analiz her işlemi takip eden bir yıllık süreyi kapsar ve sonuçlar teoriktir .
Aşağıdaki tablo, otomatik ticaret planının parçası olmayan en son açık piyasa alımlarını göstermektedir.
| İşlem Tarihi | Ticker | İçeriden Öğrenen | Bildirilmiş Hisseler |
Bildirilmiş Fiyat |
Düzeltilmiş Hisseler |
Düzeltilmiş Fiyat |
Maliyet Esası | Gün | Fiyat Maks |
Maks Kâr ($) |
Maks Getiri (%) |
|---|---|---|---|---|---|---|---|
| Bu içeriden öğrenilenler ve güvenlik kombinasyonu için bilinen planlanmamış açık piyasa ticareti yoktur. |
Düzeltilmiş Fiyat, bölünmüş olarak düzeltilmiş fiyattır. Düzeltilmiş Hisseler , bölünmüş olarak düzeltilmiş hisselerdir.
İçeriden Öğrenenlerin Satışları PK / Park Hotels & Resorts Inc. - Kısa Vadeli Zarar Analizi
Bu bölümde, ANNX / Annexon, Inc. yılında yapılan her planlanmamış, açık piyasa içeriden öğrenen satışın kısa vadeli zarardan kaçınma yöntemini analiz ediyoruz. Tutarlı bir kayıptan kaçınma modeli gelecekteki satış işlemlerinin fiyattaki düşüşleri öngörebileceğini düşündürebilir. Bu analiz her işlemi takip eden bir yıllık süreyi kapsar ve sonuçlar teoriktir .
Aşağıdaki tablo, otomatik ticaret planının parçası olmayan en son açık piyasa satışlarını göstermektedir.
Düzeltilmiş Fiyat, bölünmüş olarak düzeltilmiş fiyattır. Düzeltilmiş Hisseler , bölünmüş olarak düzeltilmiş hisselerdir.
İçeriden Öğrenen Alımları PRAX / Praxis Precision Medicines, Inc. - Kısa Vadeli Kâr Analizi
Bu bölümde, ANNX / Annexon, Inc. yılında yapılan her planlanmamış, açık piyasada içeriden öğrenen alımlarının kârlılığını analiz ediyoruz. Bu analiz, içeriden öğrenen kişinin sürekli olarak anormal getiriler sağlayıp sağlamadığını ve takip edilmeye değer olup olmadığını anlamaya yardımcı olur. Bu analiz her işlemi takip eden bir yıllık süreyi kapsar ve sonuçlar teoriktir .
Aşağıdaki tablo, otomatik ticaret planının parçası olmayan en son açık piyasa alımlarını göstermektedir.
| İşlem Tarihi | Ticker | İçeriden Öğrenen | Bildirilmiş Hisseler |
Bildirilmiş Fiyat |
Düzeltilmiş Hisseler |
Düzeltilmiş Fiyat |
Maliyet Esası | Gün | Fiyat Maks |
Maks Kâr ($) |
Maks Getiri (%) |
|---|---|---|---|---|---|---|---|
| Bu içeriden öğrenilenler ve güvenlik kombinasyonu için bilinen planlanmamış açık piyasa ticareti yoktur. |
Düzeltilmiş Fiyat, bölünmüş olarak düzeltilmiş fiyattır. Düzeltilmiş Hisseler , bölünmüş olarak düzeltilmiş hisselerdir.
İçeriden Öğrenenlerin Satışları PRAX / Praxis Precision Medicines, Inc. - Kısa Vadeli Zarar Analizi
Bu bölümde, ANNX / Annexon, Inc. yılında yapılan her planlanmamış, açık piyasa içeriden öğrenen satışın kısa vadeli zarardan kaçınma yöntemini analiz ediyoruz. Tutarlı bir kayıptan kaçınma modeli gelecekteki satış işlemlerinin fiyattaki düşüşleri öngörebileceğini düşündürebilir. Bu analiz her işlemi takip eden bir yıllık süreyi kapsar ve sonuçlar teoriktir .
Aşağıdaki tablo, otomatik ticaret planının parçası olmayan en son açık piyasa satışlarını göstermektedir.
Düzeltilmiş Fiyat, bölünmüş olarak düzeltilmiş fiyattır. Düzeltilmiş Hisseler , bölünmüş olarak düzeltilmiş hisselerdir.
İçeriden Öğrenen Alımları PRKS / United Parks & Resorts Inc. - Kısa Vadeli Kâr Analizi
Bu bölümde, ANNX / Annexon, Inc. yılında yapılan her planlanmamış, açık piyasada içeriden öğrenen alımlarının kârlılığını analiz ediyoruz. Bu analiz, içeriden öğrenen kişinin sürekli olarak anormal getiriler sağlayıp sağlamadığını ve takip edilmeye değer olup olmadığını anlamaya yardımcı olur. Bu analiz her işlemi takip eden bir yıllık süreyi kapsar ve sonuçlar teoriktir .
Aşağıdaki tablo, otomatik ticaret planının parçası olmayan en son açık piyasa alımlarını göstermektedir.
| İşlem Tarihi | Ticker | İçeriden Öğrenen | Bildirilmiş Hisseler |
Bildirilmiş Fiyat |
Düzeltilmiş Hisseler |
Düzeltilmiş Fiyat |
Maliyet Esası | Gün | Fiyat Maks |
Maks Kâr ($) |
Maks Getiri (%) |
|---|---|---|---|---|---|---|---|
| Bu içeriden öğrenilenler ve güvenlik kombinasyonu için bilinen planlanmamış açık piyasa ticareti yoktur. |
Düzeltilmiş Fiyat, bölünmüş olarak düzeltilmiş fiyattır. Düzeltilmiş Hisseler , bölünmüş olarak düzeltilmiş hisselerdir.
İçeriden Öğrenenlerin Satışları PRKS / United Parks & Resorts Inc. - Kısa Vadeli Zarar Analizi
Bu bölümde, ANNX / Annexon, Inc. yılında yapılan her planlanmamış, açık piyasa içeriden öğrenen satışın kısa vadeli zarardan kaçınma yöntemini analiz ediyoruz. Tutarlı bir kayıptan kaçınma modeli gelecekteki satış işlemlerinin fiyattaki düşüşleri öngörebileceğini düşündürebilir. Bu analiz her işlemi takip eden bir yıllık süreyi kapsar ve sonuçlar teoriktir .
Aşağıdaki tablo, otomatik ticaret planının parçası olmayan en son açık piyasa satışlarını göstermektedir.
Düzeltilmiş Fiyat, bölünmüş olarak düzeltilmiş fiyattır. Düzeltilmiş Hisseler , bölünmüş olarak düzeltilmiş hisselerdir.
İçeriden Öğrenen Alımları PTEN / Patterson-UTI Energy, Inc. - Kısa Vadeli Kâr Analizi
Bu bölümde, ANNX / Annexon, Inc. yılında yapılan her planlanmamış, açık piyasada içeriden öğrenen alımlarının kârlılığını analiz ediyoruz. Bu analiz, içeriden öğrenen kişinin sürekli olarak anormal getiriler sağlayıp sağlamadığını ve takip edilmeye değer olup olmadığını anlamaya yardımcı olur. Bu analiz her işlemi takip eden bir yıllık süreyi kapsar ve sonuçlar teoriktir .
Aşağıdaki tablo, otomatik ticaret planının parçası olmayan en son açık piyasa alımlarını göstermektedir.
| İşlem Tarihi | Ticker | İçeriden Öğrenen | Bildirilmiş Hisseler |
Bildirilmiş Fiyat |
Düzeltilmiş Hisseler |
Düzeltilmiş Fiyat |
Maliyet Esası | Gün | Fiyat Maks |
Maks Kâr ($) |
Maks Getiri (%) |
|---|---|---|---|---|---|---|---|
| Bu içeriden öğrenilenler ve güvenlik kombinasyonu için bilinen planlanmamış açık piyasa ticareti yoktur. |
Düzeltilmiş Fiyat, bölünmüş olarak düzeltilmiş fiyattır. Düzeltilmiş Hisseler , bölünmüş olarak düzeltilmiş hisselerdir.
İçeriden Öğrenenlerin Satışları PTEN / Patterson-UTI Energy, Inc. - Kısa Vadeli Zarar Analizi
Bu bölümde, ANNX / Annexon, Inc. yılında yapılan her planlanmamış, açık piyasa içeriden öğrenen satışın kısa vadeli zarardan kaçınma yöntemini analiz ediyoruz. Tutarlı bir kayıptan kaçınma modeli gelecekteki satış işlemlerinin fiyattaki düşüşleri öngörebileceğini düşündürebilir. Bu analiz her işlemi takip eden bir yıllık süreyi kapsar ve sonuçlar teoriktir .
Aşağıdaki tablo, otomatik ticaret planının parçası olmayan en son açık piyasa satışlarını göstermektedir.
| İşlem Tarihi | Ticker | İçeriden Öğrenen | Bildirilmiş Hisseler |
Bildirilmiş Fiyat |
Düzeltilmiş Hisseler |
Düzeltilmiş Fiyat |
Maliyet Esası | Gün Min |
Fiyat Min |
Maks Kayıp Kaçınılan ($) |
Maks Kayıp Kaçınılan (%) |
|---|---|---|---|---|---|---|---|
| Bu içeriden öğrenilenler ve güvenlik kombinasyonu için bilinen planlanmamış açık piyasa ticareti yoktur. |
Düzeltilmiş Fiyat, bölünmüş olarak düzeltilmiş fiyattır. Düzeltilmiş Hisseler , bölünmüş olarak düzeltilmiş hisselerdir.
İçeriden Öğrenen Alımları RUN / Sunrun Inc. - Kısa Vadeli Kâr Analizi
Bu bölümde, ANNX / Annexon, Inc. yılında yapılan her planlanmamış, açık piyasada içeriden öğrenen alımlarının kârlılığını analiz ediyoruz. Bu analiz, içeriden öğrenen kişinin sürekli olarak anormal getiriler sağlayıp sağlamadığını ve takip edilmeye değer olup olmadığını anlamaya yardımcı olur. Bu analiz her işlemi takip eden bir yıllık süreyi kapsar ve sonuçlar teoriktir .
Aşağıdaki tablo, otomatik ticaret planının parçası olmayan en son açık piyasa alımlarını göstermektedir.
| İşlem Tarihi | Ticker | İçeriden Öğrenen | Bildirilmiş Hisseler |
Bildirilmiş Fiyat |
Düzeltilmiş Hisseler |
Düzeltilmiş Fiyat |
Maliyet Esası | Gün | Fiyat Maks |
Maks Kâr ($) |
Maks Getiri (%) |
|---|---|---|---|---|---|---|---|
| Bu içeriden öğrenilenler ve güvenlik kombinasyonu için bilinen planlanmamış açık piyasa ticareti yoktur. |
Düzeltilmiş Fiyat, bölünmüş olarak düzeltilmiş fiyattır. Düzeltilmiş Hisseler , bölünmüş olarak düzeltilmiş hisselerdir.
İçeriden Öğrenenlerin Satışları RUN / Sunrun Inc. - Kısa Vadeli Zarar Analizi
Bu bölümde, ANNX / Annexon, Inc. yılında yapılan her planlanmamış, açık piyasa içeriden öğrenen satışın kısa vadeli zarardan kaçınma yöntemini analiz ediyoruz. Tutarlı bir kayıptan kaçınma modeli gelecekteki satış işlemlerinin fiyattaki düşüşleri öngörebileceğini düşündürebilir. Bu analiz her işlemi takip eden bir yıllık süreyi kapsar ve sonuçlar teoriktir .
Aşağıdaki tablo, otomatik ticaret planının parçası olmayan en son açık piyasa satışlarını göstermektedir.
Düzeltilmiş Fiyat, bölünmüş olarak düzeltilmiş fiyattır. Düzeltilmiş Hisseler , bölünmüş olarak düzeltilmiş hisselerdir.
İçeriden Öğrenen Alımları SD / SandRidge Energy, Inc. - Kısa Vadeli Kâr Analizi
Bu bölümde, ANNX / Annexon, Inc. yılında yapılan her planlanmamış, açık piyasada içeriden öğrenen alımlarının kârlılığını analiz ediyoruz. Bu analiz, içeriden öğrenen kişinin sürekli olarak anormal getiriler sağlayıp sağlamadığını ve takip edilmeye değer olup olmadığını anlamaya yardımcı olur. Bu analiz her işlemi takip eden bir yıllık süreyi kapsar ve sonuçlar teoriktir .
Aşağıdaki tablo, otomatik ticaret planının parçası olmayan en son açık piyasa alımlarını göstermektedir.
| İşlem Tarihi | Ticker | İçeriden Öğrenen | Bildirilmiş Hisseler |
Bildirilmiş Fiyat |
Düzeltilmiş Hisseler |
Düzeltilmiş Fiyat |
Maliyet Esası | Gün | Fiyat Maks |
Maks Kâr ($) |
Maks Getiri (%) |
|---|---|---|---|---|---|---|---|
| Bu içeriden öğrenilenler ve güvenlik kombinasyonu için bilinen planlanmamış açık piyasa ticareti yoktur. |
Düzeltilmiş Fiyat, bölünmüş olarak düzeltilmiş fiyattır. Düzeltilmiş Hisseler , bölünmüş olarak düzeltilmiş hisselerdir.
İçeriden Öğrenenlerin Satışları SD / SandRidge Energy, Inc. - Kısa Vadeli Zarar Analizi
Bu bölümde, ANNX / Annexon, Inc. yılında yapılan her planlanmamış, açık piyasa içeriden öğrenen satışın kısa vadeli zarardan kaçınma yöntemini analiz ediyoruz. Tutarlı bir kayıptan kaçınma modeli gelecekteki satış işlemlerinin fiyattaki düşüşleri öngörebileceğini düşündürebilir. Bu analiz her işlemi takip eden bir yıllık süreyi kapsar ve sonuçlar teoriktir .
Aşağıdaki tablo, otomatik ticaret planının parçası olmayan en son açık piyasa satışlarını göstermektedir.
| İşlem Tarihi | Ticker | İçeriden Öğrenen | Bildirilmiş Hisseler |
Bildirilmiş Fiyat |
Düzeltilmiş Hisseler |
Düzeltilmiş Fiyat |
Maliyet Esası | Gün Min |
Fiyat Min |
Maks Kayıp Kaçınılan ($) |
Maks Kayıp Kaçınılan (%) |
|---|---|---|---|---|---|---|---|
| Bu içeriden öğrenilenler ve güvenlik kombinasyonu için bilinen planlanmamış açık piyasa ticareti yoktur. |
Düzeltilmiş Fiyat, bölünmüş olarak düzeltilmiş fiyattır. Düzeltilmiş Hisseler , bölünmüş olarak düzeltilmiş hisselerdir.
İçeriden Öğrenen Alımları SN / SharkNinja, Inc. - Kısa Vadeli Kâr Analizi
Bu bölümde, ANNX / Annexon, Inc. yılında yapılan her planlanmamış, açık piyasada içeriden öğrenen alımlarının kârlılığını analiz ediyoruz. Bu analiz, içeriden öğrenen kişinin sürekli olarak anormal getiriler sağlayıp sağlamadığını ve takip edilmeye değer olup olmadığını anlamaya yardımcı olur. Bu analiz her işlemi takip eden bir yıllık süreyi kapsar ve sonuçlar teoriktir .
Aşağıdaki tablo, otomatik ticaret planının parçası olmayan en son açık piyasa alımlarını göstermektedir.
| İşlem Tarihi | Ticker | İçeriden Öğrenen | Bildirilmiş Hisseler |
Bildirilmiş Fiyat |
Düzeltilmiş Hisseler |
Düzeltilmiş Fiyat |
Maliyet Esası | Gün | Fiyat Maks |
Maks Kâr ($) |
Maks Getiri (%) |
|---|---|---|---|---|---|---|---|
| Bu içeriden öğrenilenler ve güvenlik kombinasyonu için bilinen planlanmamış açık piyasa ticareti yoktur. |
Düzeltilmiş Fiyat, bölünmüş olarak düzeltilmiş fiyattır. Düzeltilmiş Hisseler , bölünmüş olarak düzeltilmiş hisselerdir.
İçeriden Öğrenenlerin Satışları SN / SharkNinja, Inc. - Kısa Vadeli Zarar Analizi
Bu bölümde, ANNX / Annexon, Inc. yılında yapılan her planlanmamış, açık piyasa içeriden öğrenen satışın kısa vadeli zarardan kaçınma yöntemini analiz ediyoruz. Tutarlı bir kayıptan kaçınma modeli gelecekteki satış işlemlerinin fiyattaki düşüşleri öngörebileceğini düşündürebilir. Bu analiz her işlemi takip eden bir yıllık süreyi kapsar ve sonuçlar teoriktir .
Aşağıdaki tablo, otomatik ticaret planının parçası olmayan en son açık piyasa satışlarını göstermektedir.
| İşlem Tarihi | Ticker | İçeriden Öğrenen | Bildirilmiş Hisseler |
Bildirilmiş Fiyat |
Düzeltilmiş Hisseler |
Düzeltilmiş Fiyat |
Maliyet Esası | Gün Min |
Fiyat Min |
Maks Kayıp Kaçınılan ($) |
Maks Kayıp Kaçınılan (%) |
|---|---|---|---|---|---|---|---|
| Bu içeriden öğrenilenler ve güvenlik kombinasyonu için bilinen planlanmamış açık piyasa ticareti yoktur. |
Düzeltilmiş Fiyat, bölünmüş olarak düzeltilmiş fiyattır. Düzeltilmiş Hisseler , bölünmüş olarak düzeltilmiş hisselerdir.
İçeriden Öğrenen Alımları TASK / TaskUs, Inc. - Kısa Vadeli Kâr Analizi
Bu bölümde, ANNX / Annexon, Inc. yılında yapılan her planlanmamış, açık piyasada içeriden öğrenen alımlarının kârlılığını analiz ediyoruz. Bu analiz, içeriden öğrenen kişinin sürekli olarak anormal getiriler sağlayıp sağlamadığını ve takip edilmeye değer olup olmadığını anlamaya yardımcı olur. Bu analiz her işlemi takip eden bir yıllık süreyi kapsar ve sonuçlar teoriktir .
Aşağıdaki tablo, otomatik ticaret planının parçası olmayan en son açık piyasa alımlarını göstermektedir.
| İşlem Tarihi | Ticker | İçeriden Öğrenen | Bildirilmiş Hisseler |
Bildirilmiş Fiyat |
Düzeltilmiş Hisseler |
Düzeltilmiş Fiyat |
Maliyet Esası | Gün | Fiyat Maks |
Maks Kâr ($) |
Maks Getiri (%) |
|---|---|---|---|---|---|---|---|
| Bu içeriden öğrenilenler ve güvenlik kombinasyonu için bilinen planlanmamış açık piyasa ticareti yoktur. |
Düzeltilmiş Fiyat, bölünmüş olarak düzeltilmiş fiyattır. Düzeltilmiş Hisseler , bölünmüş olarak düzeltilmiş hisselerdir.
İçeriden Öğrenenlerin Satışları TASK / TaskUs, Inc. - Kısa Vadeli Zarar Analizi
Bu bölümde, ANNX / Annexon, Inc. yılında yapılan her planlanmamış, açık piyasa içeriden öğrenen satışın kısa vadeli zarardan kaçınma yöntemini analiz ediyoruz. Tutarlı bir kayıptan kaçınma modeli gelecekteki satış işlemlerinin fiyattaki düşüşleri öngörebileceğini düşündürebilir. Bu analiz her işlemi takip eden bir yıllık süreyi kapsar ve sonuçlar teoriktir .
Aşağıdaki tablo, otomatik ticaret planının parçası olmayan en son açık piyasa satışlarını göstermektedir.
| İşlem Tarihi | Ticker | İçeriden Öğrenen | Bildirilmiş Hisseler |
Bildirilmiş Fiyat |
Düzeltilmiş Hisseler |
Düzeltilmiş Fiyat |
Maliyet Esası | Gün Min |
Fiyat Min |
Maks Kayıp Kaçınılan ($) |
Maks Kayıp Kaçınılan (%) |
|---|---|---|---|---|---|---|---|
| Bu içeriden öğrenilenler ve güvenlik kombinasyonu için bilinen planlanmamış açık piyasa ticareti yoktur. |
Düzeltilmiş Fiyat, bölünmüş olarak düzeltilmiş fiyattır. Düzeltilmiş Hisseler , bölünmüş olarak düzeltilmiş hisselerdir.
İçeriden Öğrenen Alımları TGE / The Generation Essentials Group - Kısa Vadeli Kâr Analizi
Bu bölümde, ANNX / Annexon, Inc. yılında yapılan her planlanmamış, açık piyasada içeriden öğrenen alımlarının kârlılığını analiz ediyoruz. Bu analiz, içeriden öğrenen kişinin sürekli olarak anormal getiriler sağlayıp sağlamadığını ve takip edilmeye değer olup olmadığını anlamaya yardımcı olur. Bu analiz her işlemi takip eden bir yıllık süreyi kapsar ve sonuçlar teoriktir .
Aşağıdaki tablo, otomatik ticaret planının parçası olmayan en son açık piyasa alımlarını göstermektedir.
| İşlem Tarihi | Ticker | İçeriden Öğrenen | Bildirilmiş Hisseler |
Bildirilmiş Fiyat |
Düzeltilmiş Hisseler |
Düzeltilmiş Fiyat |
Maliyet Esası | Gün | Fiyat Maks |
Maks Kâr ($) |
Maks Getiri (%) |
|---|---|---|---|---|---|---|---|
| Bu içeriden öğrenilenler ve güvenlik kombinasyonu için bilinen planlanmamış açık piyasa ticareti yoktur. |
Düzeltilmiş Fiyat, bölünmüş olarak düzeltilmiş fiyattır. Düzeltilmiş Hisseler , bölünmüş olarak düzeltilmiş hisselerdir.
İçeriden Öğrenenlerin Satışları TGE / The Generation Essentials Group - Kısa Vadeli Zarar Analizi
Bu bölümde, ANNX / Annexon, Inc. yılında yapılan her planlanmamış, açık piyasa içeriden öğrenen satışın kısa vadeli zarardan kaçınma yöntemini analiz ediyoruz. Tutarlı bir kayıptan kaçınma modeli gelecekteki satış işlemlerinin fiyattaki düşüşleri öngörebileceğini düşündürebilir. Bu analiz her işlemi takip eden bir yıllık süreyi kapsar ve sonuçlar teoriktir .
Aşağıdaki tablo, otomatik ticaret planının parçası olmayan en son açık piyasa satışlarını göstermektedir.
| İşlem Tarihi | Ticker | İçeriden Öğrenen | Bildirilmiş Hisseler |
Bildirilmiş Fiyat |
Düzeltilmiş Hisseler |
Düzeltilmiş Fiyat |
Maliyet Esası | Gün Min |
Fiyat Min |
Maks Kayıp Kaçınılan ($) |
Maks Kayıp Kaçınılan (%) |
|---|---|---|---|---|---|---|---|
| Bu içeriden öğrenilenler ve güvenlik kombinasyonu için bilinen planlanmamış açık piyasa ticareti yoktur. |
Düzeltilmiş Fiyat, bölünmüş olarak düzeltilmiş fiyattır. Düzeltilmiş Hisseler , bölünmüş olarak düzeltilmiş hisselerdir.
İçeriden Öğrenen Alımları TW / Tradeweb Markets Inc. - Kısa Vadeli Kâr Analizi
Bu bölümde, ANNX / Annexon, Inc. yılında yapılan her planlanmamış, açık piyasada içeriden öğrenen alımlarının kârlılığını analiz ediyoruz. Bu analiz, içeriden öğrenen kişinin sürekli olarak anormal getiriler sağlayıp sağlamadığını ve takip edilmeye değer olup olmadığını anlamaya yardımcı olur. Bu analiz her işlemi takip eden bir yıllık süreyi kapsar ve sonuçlar teoriktir .
Aşağıdaki tablo, otomatik ticaret planının parçası olmayan en son açık piyasa alımlarını göstermektedir.
| İşlem Tarihi | Ticker | İçeriden Öğrenen | Bildirilmiş Hisseler |
Bildirilmiş Fiyat |
Düzeltilmiş Hisseler |
Düzeltilmiş Fiyat |
Maliyet Esası | Gün | Fiyat Maks |
Maks Kâr ($) |
Maks Getiri (%) |
|---|---|---|---|---|---|---|---|
| Bu içeriden öğrenilenler ve güvenlik kombinasyonu için bilinen planlanmamış açık piyasa ticareti yoktur. |
Düzeltilmiş Fiyat, bölünmüş olarak düzeltilmiş fiyattır. Düzeltilmiş Hisseler , bölünmüş olarak düzeltilmiş hisselerdir.
İçeriden Öğrenenlerin Satışları TW / Tradeweb Markets Inc. - Kısa Vadeli Zarar Analizi
Bu bölümde, ANNX / Annexon, Inc. yılında yapılan her planlanmamış, açık piyasa içeriden öğrenen satışın kısa vadeli zarardan kaçınma yöntemini analiz ediyoruz. Tutarlı bir kayıptan kaçınma modeli gelecekteki satış işlemlerinin fiyattaki düşüşleri öngörebileceğini düşündürebilir. Bu analiz her işlemi takip eden bir yıllık süreyi kapsar ve sonuçlar teoriktir .
Aşağıdaki tablo, otomatik ticaret planının parçası olmayan en son açık piyasa satışlarını göstermektedir.
| İşlem Tarihi | Ticker | İçeriden Öğrenen | Bildirilmiş Hisseler |
Bildirilmiş Fiyat |
Düzeltilmiş Hisseler |
Düzeltilmiş Fiyat |
Maliyet Esası | Gün Min |
Fiyat Min |
Maks Kayıp Kaçınılan ($) |
Maks Kayıp Kaçınılan (%) |
|---|---|---|---|---|---|---|---|
| Bu içeriden öğrenilenler ve güvenlik kombinasyonu için bilinen planlanmamış açık piyasa ticareti yoktur. |
Düzeltilmiş Fiyat, bölünmüş olarak düzeltilmiş fiyattır. Düzeltilmiş Hisseler , bölünmüş olarak düzeltilmiş hisselerdir.
İçeriden Öğrenen Alımları UAN / CVR Partners, LP - Limited Partnership - Kısa Vadeli Kâr Analizi
Bu bölümde, ANNX / Annexon, Inc. yılında yapılan her planlanmamış, açık piyasada içeriden öğrenen alımlarının kârlılığını analiz ediyoruz. Bu analiz, içeriden öğrenen kişinin sürekli olarak anormal getiriler sağlayıp sağlamadığını ve takip edilmeye değer olup olmadığını anlamaya yardımcı olur. Bu analiz her işlemi takip eden bir yıllık süreyi kapsar ve sonuçlar teoriktir .
Aşağıdaki tablo, otomatik ticaret planının parçası olmayan en son açık piyasa alımlarını göstermektedir.
| İşlem Tarihi | Ticker | İçeriden Öğrenen | Bildirilmiş Hisseler |
Bildirilmiş Fiyat |
Düzeltilmiş Hisseler |
Düzeltilmiş Fiyat |
Maliyet Esası | Gün | Fiyat Maks |
Maks Kâr ($) |
Maks Getiri (%) |
|---|---|---|---|---|---|---|---|
| Bu içeriden öğrenilenler ve güvenlik kombinasyonu için bilinen planlanmamış açık piyasa ticareti yoktur. |
Düzeltilmiş Fiyat, bölünmüş olarak düzeltilmiş fiyattır. Düzeltilmiş Hisseler , bölünmüş olarak düzeltilmiş hisselerdir.
İçeriden Öğrenenlerin Satışları UAN / CVR Partners, LP - Limited Partnership - Kısa Vadeli Zarar Analizi
Bu bölümde, ANNX / Annexon, Inc. yılında yapılan her planlanmamış, açık piyasa içeriden öğrenen satışın kısa vadeli zarardan kaçınma yöntemini analiz ediyoruz. Tutarlı bir kayıptan kaçınma modeli gelecekteki satış işlemlerinin fiyattaki düşüşleri öngörebileceğini düşündürebilir. Bu analiz her işlemi takip eden bir yıllık süreyi kapsar ve sonuçlar teoriktir .
Aşağıdaki tablo, otomatik ticaret planının parçası olmayan en son açık piyasa satışlarını göstermektedir.
Düzeltilmiş Fiyat, bölünmüş olarak düzeltilmiş fiyattır. Düzeltilmiş Hisseler , bölünmüş olarak düzeltilmiş hisselerdir.
İçeriden Öğrenen Alımları VNOM / Viper Energy, Inc. - Kısa Vadeli Kâr Analizi
Bu bölümde, ANNX / Annexon, Inc. yılında yapılan her planlanmamış, açık piyasada içeriden öğrenen alımlarının kârlılığını analiz ediyoruz. Bu analiz, içeriden öğrenen kişinin sürekli olarak anormal getiriler sağlayıp sağlamadığını ve takip edilmeye değer olup olmadığını anlamaya yardımcı olur. Bu analiz her işlemi takip eden bir yıllık süreyi kapsar ve sonuçlar teoriktir .
Aşağıdaki tablo, otomatik ticaret planının parçası olmayan en son açık piyasa alımlarını göstermektedir.
| İşlem Tarihi | Ticker | İçeriden Öğrenen | Bildirilmiş Hisseler |
Bildirilmiş Fiyat |
Düzeltilmiş Hisseler |
Düzeltilmiş Fiyat |
Maliyet Esası | Gün | Fiyat Maks |
Maks Kâr ($) |
Maks Getiri (%) |
|---|---|---|---|---|---|---|---|
| Bu içeriden öğrenilenler ve güvenlik kombinasyonu için bilinen planlanmamış açık piyasa ticareti yoktur. |
Düzeltilmiş Fiyat, bölünmüş olarak düzeltilmiş fiyattır. Düzeltilmiş Hisseler , bölünmüş olarak düzeltilmiş hisselerdir.
İçeriden Öğrenenlerin Satışları VNOM / Viper Energy, Inc. - Kısa Vadeli Zarar Analizi
Bu bölümde, ANNX / Annexon, Inc. yılında yapılan her planlanmamış, açık piyasa içeriden öğrenen satışın kısa vadeli zarardan kaçınma yöntemini analiz ediyoruz. Tutarlı bir kayıptan kaçınma modeli gelecekteki satış işlemlerinin fiyattaki düşüşleri öngörebileceğini düşündürebilir. Bu analiz her işlemi takip eden bir yıllık süreyi kapsar ve sonuçlar teoriktir .
Aşağıdaki tablo, otomatik ticaret planının parçası olmayan en son açık piyasa satışlarını göstermektedir.
Düzeltilmiş Fiyat, bölünmüş olarak düzeltilmiş fiyattır. Düzeltilmiş Hisseler , bölünmüş olarak düzeltilmiş hisselerdir.
İçeriden Öğrenen Alımları WGSWW / GeneDx Holdings Corp. - Equity Warrant - Kısa Vadeli Kâr Analizi
Bu bölümde, ANNX / Annexon, Inc. yılında yapılan her planlanmamış, açık piyasada içeriden öğrenen alımlarının kârlılığını analiz ediyoruz. Bu analiz, içeriden öğrenen kişinin sürekli olarak anormal getiriler sağlayıp sağlamadığını ve takip edilmeye değer olup olmadığını anlamaya yardımcı olur. Bu analiz her işlemi takip eden bir yıllık süreyi kapsar ve sonuçlar teoriktir .
Aşağıdaki tablo, otomatik ticaret planının parçası olmayan en son açık piyasa alımlarını göstermektedir.
Düzeltilmiş Fiyat, bölünmüş olarak düzeltilmiş fiyattır. Düzeltilmiş Hisseler , bölünmüş olarak düzeltilmiş hisselerdir.
İçeriden Öğrenenlerin Satışları WGSWW / GeneDx Holdings Corp. - Equity Warrant - Kısa Vadeli Zarar Analizi
Bu bölümde, ANNX / Annexon, Inc. yılında yapılan her planlanmamış, açık piyasa içeriden öğrenen satışın kısa vadeli zarardan kaçınma yöntemini analiz ediyoruz. Tutarlı bir kayıptan kaçınma modeli gelecekteki satış işlemlerinin fiyattaki düşüşleri öngörebileceğini düşündürebilir. Bu analiz her işlemi takip eden bir yıllık süreyi kapsar ve sonuçlar teoriktir .
Aşağıdaki tablo, otomatik ticaret planının parçası olmayan en son açık piyasa satışlarını göstermektedir.
| İşlem Tarihi | Ticker | İçeriden Öğrenen | Bildirilmiş Hisseler |
Bildirilmiş Fiyat |
Düzeltilmiş Hisseler |
Düzeltilmiş Fiyat |
Maliyet Esası | Gün Min |
Fiyat Min |
Maks Kayıp Kaçınılan ($) |
Maks Kayıp Kaçınılan (%) |
|---|---|---|---|---|---|---|---|
| Bu içeriden öğrenilenler ve güvenlik kombinasyonu için bilinen planlanmamış açık piyasa ticareti yoktur. |
Düzeltilmiş Fiyat, bölünmüş olarak düzeltilmiş fiyattır. Düzeltilmiş Hisseler , bölünmüş olarak düzeltilmiş hisselerdir.
İçeriden Öğrenen Alımları WLKP / Westlake Chemical Partners LP - Limited Partnership - Kısa Vadeli Kâr Analizi
Bu bölümde, ANNX / Annexon, Inc. yılında yapılan her planlanmamış, açık piyasada içeriden öğrenen alımlarının kârlılığını analiz ediyoruz. Bu analiz, içeriden öğrenen kişinin sürekli olarak anormal getiriler sağlayıp sağlamadığını ve takip edilmeye değer olup olmadığını anlamaya yardımcı olur. Bu analiz her işlemi takip eden bir yıllık süreyi kapsar ve sonuçlar teoriktir .
Aşağıdaki tablo, otomatik ticaret planının parçası olmayan en son açık piyasa alımlarını göstermektedir.
| İşlem Tarihi | Ticker | İçeriden Öğrenen | Bildirilmiş Hisseler |
Bildirilmiş Fiyat |
Düzeltilmiş Hisseler |
Düzeltilmiş Fiyat |
Maliyet Esası | Gün | Fiyat Maks |
Maks Kâr ($) |
Maks Getiri (%) |
|---|---|---|---|---|---|---|---|
| Bu içeriden öğrenilenler ve güvenlik kombinasyonu için bilinen planlanmamış açık piyasa ticareti yoktur. |
Düzeltilmiş Fiyat, bölünmüş olarak düzeltilmiş fiyattır. Düzeltilmiş Hisseler , bölünmüş olarak düzeltilmiş hisselerdir.
İçeriden Öğrenenlerin Satışları WLKP / Westlake Chemical Partners LP - Limited Partnership - Kısa Vadeli Zarar Analizi
Bu bölümde, ANNX / Annexon, Inc. yılında yapılan her planlanmamış, açık piyasa içeriden öğrenen satışın kısa vadeli zarardan kaçınma yöntemini analiz ediyoruz. Tutarlı bir kayıptan kaçınma modeli gelecekteki satış işlemlerinin fiyattaki düşüşleri öngörebileceğini düşündürebilir. Bu analiz her işlemi takip eden bir yıllık süreyi kapsar ve sonuçlar teoriktir .
Aşağıdaki tablo, otomatik ticaret planının parçası olmayan en son açık piyasa satışlarını göstermektedir.
| İşlem Tarihi | Ticker | İçeriden Öğrenen | Bildirilmiş Hisseler |
Bildirilmiş Fiyat |
Düzeltilmiş Hisseler |
Düzeltilmiş Fiyat |
Maliyet Esası | Gün Min |
Fiyat Min |
Maks Kayıp Kaçınılan ($) |
Maks Kayıp Kaçınılan (%) |
|---|---|---|---|---|---|---|---|
| Bu içeriden öğrenilenler ve güvenlik kombinasyonu için bilinen planlanmamış açık piyasa ticareti yoktur. |
Düzeltilmiş Fiyat, bölünmüş olarak düzeltilmiş fiyattır. Düzeltilmiş Hisseler , bölünmüş olarak düzeltilmiş hisselerdir.
İçeriden Öğrenen Ticareti Geçmişi
Bu tablo, Blackstone Group Management L.L.C. tarafından Menkul Kıymetler Borsası Komisyonuna (SEC) açıklanan içeriden öğrenen ticaretinin tam listesini gösterir.
| Dosya Tarihi | İşlem Tarihi | Form | Ticker | Menkul Kıymet | Kod | Hisseler | Kalan Hisseler | Yüzde Değişimi |
Hisse Fiyatı |
İşlem Değeri |
Kalan Değer |
|
|---|---|---|---|---|---|---|---|---|---|---|---|---|
| 2026-06-04 | 3 | LFTO |
Liftoff Mobile, Inc.
Common Stock |
83.831.109 | ||||||||
| 2026-06-01 |
|
4 | MDLN |
Medline Inc.
Class A Common Stock |
J - Other | -438.214 | 1.990.467 | -18,04 | ||||
| 2026-06-01 |
|
4 | MDLN |
Medline Inc.
Class A Common Stock |
S - Sale | -1.489.924 | 1.539 | -99,90 | 36,54 | -54.438.098 | 56.231 | |
| 2026-06-01 |
|
4 | MDLN |
Medline Inc.
Class A Common Stock |
S - Sale | -2.256.800 | 10.250.904 | -18,04 | 36,54 | -82.457.830 | 374.542.405 | |
| 2026-06-01 |
|
4 | MDLN |
Medline Inc.
Class A Common Stock |
S - Sale | -9.858.774 | 10.185 | -99,90 | 36,54 | -360.214.955 | 372.134 | |
| 2026-06-01 |
|
4 | MDLN |
Medline Inc.
Class A Common Stock |
S - Sale | -19.712.326 | 89.537.913 | -18,04 | 36,54 | -720.239.111 | 3.271.491.496 | |
| 2026-05-26 |
|
4 | MDLN |
Medline Inc.
Class B Common Stock |
J - Other | -1.489.924 | 6.766.039 | -18,05 | ||||
| 2026-05-26 |
|
4 | MDLN |
Medline Inc.
Class B Common Stock |
J - Other | -9.858.774 | 44.770.628 | -18,05 | ||||
| 2026-05-26 |
|
4 | MDLN |
Medline Inc.
Class A Common Stock |
C - Conversion | 1.489.924 | 1.491.463 | 96.811,18 | ||||
| 2026-05-26 |
|
4 | MDLN |
Medline Inc.
Class A Common Stock |
C - Conversion | 9.858.774 | 9.868.959 | 96.797,00 | ||||
| 2026-05-19 |
|
4 | BXDC |
Blackstone Digital Infrastructure Trust Inc.
Common Stock |
P - Purchase | 9.111.795 | 9.111.800 | 182.235.900,00 | 20,00 | 182.235.900 | 182.236.000 | |
| 2026-05-19 |
|
4 | BXDC |
Blackstone Digital Infrastructure Trust Inc.
Common Stock |
P - Purchase | 375.000 | 375.000 | 20,00 | 7.500.000 | 7.500.000 | ||
| 2026-05-13 | 3 | BXDC |
Blackstone Digital Infrastructure Trust Inc.
Common Stock |
5 | ||||||||
| 2026-05-12 | 3 | APC |
ARKO Petroleum Corp.
Class A Common Stock |
0 | ||||||||
| 2026-05-12 | 3 | APC |
ARKO Petroleum Corp.
Class A Common Stock |
50.000 | ||||||||
| 2026-05-12 |
|
4 | APC |
ARKO Petroleum Corp.
Class A Common Stock |
S - Sale | -25.000 | 125.000 | -16,67 | 19,00 | -475.000 | 2.375.000 | |
| 2026-05-12 |
|
4 | APC |
ARKO Petroleum Corp.
Class A Common Stock |
P - Purchase | -100.000 | 150.000 | -40,00 | 17,66 | -1.766.000 | 2.649.000 | |
| 2026-04-09 |
|
4 | LGN |
Legence Corp.
Class A Common Stock |
S - Sale | -5.865.413 | 19.297.381 | -23,31 | 54,00 | -316.732.302 | 1.042.058.574 | |
| 2026-04-09 |
|
4 | LGN |
Legence Corp.
Class A Common Stock |
S - Sale | -9.528.699 | 178.571 | -98,16 | 54,00 | -514.549.746 | 9.642.834 | |
| 2026-04-09 |
|
4 | LGN |
Legence Corp.
Class B Common Stock |
C - Conversion | -9.528.699 | 31.171.134 | -23,41 | ||||
| 2026-04-09 |
|
4 | LGN |
Legence Corp.
Class A Common Stock |
C - Conversion | 9.528.699 | 9.707.270 | 5.336,08 | ||||
| 2026-03-23 |
|
4 | NONE |
Blackstone Private Real Estate Credit & Income Fund
Common Shares of Beneficial Interest |
P - Purchase | 956.023 | 7.117.034 | 15,52 | 26,15 | 25.000.000 | 186.110.430 | |
| 2026-03-23 |
|
4 | NONE |
Blackstone Private Real Estate Credit & Income Fund
Common Shares of Beneficial Interest |
P - Purchase | 1.912.046 | 18.628.295 | 11,44 | 26,15 | 50.000.000 | 487.129.904 | |
| 2026-03-19 |
|
4 | BMBL |
Bumble Inc.
Class A Common Stock |
S - Sale | -6.459 | 25.832 | -20,00 | 3,51 | -22.671 | 90.670 | |
| 2026-03-19 |
|
4 | BMBL |
Bumble Inc.
Class A Common Stock |
S - Sale | -29.575 | 118.296 | -20,00 | 3,51 | -103.808 | 415.219 | |
| 2026-03-19 |
|
4 | BMBL |
Bumble Inc.
Class A Common Stock |
S - Sale | -3.278.961 | 13.115.843 | -20,00 | 3,51 | -11.509.153 | 46.036.609 | |
| 2026-03-19 |
|
4 | BMBL |
Bumble Inc.
Class A Common Stock |
S - Sale | -1.080.903 | 4.323.608 | -20,00 | 3,51 | -3.793.970 | 15.175.864 | |
| 2026-03-19 |
|
4 | BMBL |
Bumble Inc.
Class A Common Stock |
S - Sale | -405.073 | 1.620.290 | -20,00 | 3,51 | -1.421.806 | 5.687.218 | |
| 2026-03-19 |
|
4 | BMBL |
Bumble Inc.
Class A Common Stock |
S - Sale | -2.495.189 | 9.980.754 | -20,00 | 3,51 | -8.758.113 | 35.032.447 | |
| 2026-03-19 |
|
4 | BMBL |
Bumble Inc.
Class A Common Stock |
S - Sale | -181.344 | 725.373 | -20,00 | 3,51 | -636.517 | 2.546.059 | |
| 2026-03-12 |
|
4 | MDLN |
Medline Inc.
Class A Common Stock |
J - Other | -366.337 | 2.428.681 | -13,11 | ||||
| 2026-03-12 |
|
4 | MDLN |
Medline Inc.
Class A Common Stock |
S - Sale | -1.245.544 | 1.539 | -99,88 | 40,51 | -50.454.496 | 62.342 | |
| 2026-03-12 |
|
4 | MDLN |
Medline Inc.
Class A Common Stock |
S - Sale | -1.886.636 | 12.507.704 | -13,11 | 40,51 | -76.423.851 | 506.662.074 | |
| 2026-03-12 |
|
4 | MDLN |
Medline Inc.
Class A Common Stock |
S - Sale | -8.241.723 | 10.185 | -99,88 | 40,51 | -333.855.715 | 412.574 | |
| 2026-03-12 |
|
4 | MDLN |
Medline Inc.
Class A Common Stock |
S - Sale | -16.479.083 | 109.250.239 | -13,11 | 40,51 | -667.534.694 | 4.425.508.681 | |
| 2026-03-06 |
|
4 | MDLN |
Medline Inc.
Class B Common Stock |
J - Other | -162.462 | 8.255.963 | -1,93 | ||||
| 2026-03-06 |
|
4 | MDLN |
Medline Inc.
Class B Common Stock |
J - Other | -1.075.007 | 54.629.402 | -1,93 | ||||
| 2026-03-06 |
|
4 | MDLN |
Medline Inc.
Class A Common Stock |
C - Conversion | 162.462 | 1.247.083 | 14,98 | ||||
| 2026-03-06 |
|
4 | MDLN |
Medline Inc.
Class A Common Stock |
C - Conversion | 1.075.007 | 8.251.908 | 14,98 | ||||
| 2026-03-06 |
|
4 | MDLN |
Medline Inc.
Class B Common Stock |
J - Other | -1.083.082 | 8.418.425 | -11,40 | ||||
| 2026-03-06 |
|
4 | MDLN |
Medline Inc.
Class B Common Stock |
J - Other | -7.166.716 | 55.704.409 | -11,40 | ||||
| 2026-03-06 |
|
4 | MDLN |
Medline Inc.
Class A Common Stock |
C - Conversion | 1.083.082 | 1.084.621 | 70.375,70 | ||||
| 2026-03-06 |
|
4 | MDLN |
Medline Inc.
Class A Common Stock |
C - Conversion | 7.166.716 | 7.176.901 | 70.365,40 | ||||
| 2026-03-03 |
|
4 | FOA |
Finance of America Companies Inc.
Class B Common Stock |
S - Sale | -1 | 0 | -100,00 | ||||
| 2026-03-03 |
|
4 | FOA |
Finance of America Companies Inc.
Class B Common Stock |
S - Sale | -1 | 0 | -100,00 | ||||
| 2026-03-03 |
|
4 | FOA |
Finance of America Companies Inc.
Class A Common Stock |
S - Sale | -1.208.126 | 0 | -100,00 | 10,00 | -12.081.260 | ||
| 2026-03-03 |
|
4 | FOA |
Finance of America Companies Inc.
Class A Common Stock |
S - Sale | -2.161 | 0 | -100,00 | 10,00 | -21.610 | ||
| 2026-03-03 |
|
4 | FOA |
Finance of America Companies Inc.
Class A Common Stock |
S - Sale | -385.855 | 0 | -100,00 | 10,00 | -3.858.550 | ||
| 2026-02-24 |
|
4 | NONE |
Blackstone Private Real Estate Credit & Income Fund
Common Shares of Beneficial Interest |
P - Purchase | 955.657 | 6.161.011 | 18,36 | 26,16 | 25.000.000 | 161.172.040 | |
| 2026-02-24 |
|
4 | NONE |
Blackstone Private Real Estate Credit & Income Fund
Common Shares of Beneficial Interest |
P - Purchase | 191.131 | 16.716.249 | 1,16 | 26,16 | 5.000.000 | 437.297.066 | |
| 2026-01-08 |
|
4 | LGN |
Legence Corp.
Class A Common Stock |
S - Sale | -480.205 | 25.162.794 | -1,87 | 45,00 | -21.609.225 | 1.132.325.730 | |
| 2026-01-08 |
|
4 | LGN |
Legence Corp.
Class A Common Stock |
S - Sale | -780.121 | 178.571 | -81,37 | 45,00 | -35.105.445 | 8.035.695 | |
| 2026-01-08 |
|
4 | LGN |
Legence Corp.
Class B Common Stock |
C - Conversion | -780.121 | 40.699.833 | -1,88 | ||||
| 2026-01-08 |
|
4 | LGN |
Legence Corp.
Class A Common Stock |
C - Conversion | 780.121 | 958.692 | 436,87 | ||||
| 2025-12-22 |
|
4 | MDLN |
Medline Inc.
Class A Common Stock |
J - Other | -268.536 | 142.918.680 | -0,19 | ||||
| 2025-12-22 |
|
4 | MDLN |
Medline Inc.
Class B Common Stock |
J - Other | -6.954.440 | 72.372.632 | -8,77 | ||||
| 2025-12-22 |
|
4 | MDLN |
Medline Inc.
Class A Common Stock |
S - Sale | -13.462.600 | 143.187.216 | -8,59 | 28,37 | -381.911.076 | 4.061.977.900 | |
| 2025-12-22 |
|
4 | NONE |
Blackstone Private Real Estate Credit & Income Fund
Common Shares of Beneficial Interest |
P - Purchase | 192.234 | 5.205.353 | 3,83 | 26,01 | 5.000.000 | 135.391.237 | |
| 2025-12-22 |
|
4 | NONE |
Blackstone Private Real Estate Credit & Income Fund
Common Shares of Beneficial Interest |
P - Purchase | 192.234 | 5.205.353 | 3,83 | 26,01 | 5.000.000 | 135.391.237 | |
| 2025-12-17 | 3 | MDLN |
Medline Inc.
Class A Common Stock |
156.649.816 | ||||||||
| 2025-12-17 | 3 | MDLN |
Medline Inc.
Class A Common Stock |
11.724 | ||||||||
| 2025-12-17 | 3 | MDLN |
Medline Inc.
Class B Common Stock |
79.327.072 | ||||||||
| 2025-12-16 |
|
4 | LGN |
Legence Corp.
Class A Common Stock |
S - Sale | -3.201.370 | 25.642.999 | -11,10 | 45,00 | -144.061.650 | 1.153.934.955 | |
| 2025-12-16 |
|
4 | LGN |
Legence Corp.
Class A Common Stock |
S - Sale | -5.200.808 | 178.571 | -96,68 | 45,00 | -234.036.360 | 8.035.695 | |
| 2025-12-16 |
|
4 | LGN |
Legence Corp.
Class B Common Stock |
C - Conversion | -5.200.808 | 41.479.954 | -11,14 | ||||
| 2025-12-16 |
|
4 | LGN |
Legence Corp.
Class A Common Stock |
C - Conversion | 5.200.808 | 5.379.379 | 2.912,46 | ||||
| 2025-12-08 |
|
4 | FOA |
Finance of America Companies Inc.
Class A Common Stock |
S - Sale | -1.208.126 | 1.208.126 | -50,00 | 10,00 | -12.081.260 | 12.081.260 | |
| 2025-12-08 |
|
4 | FOA |
Finance of America Companies Inc.
Class A Common Stock |
S - Sale | -2.161 | 2.161 | -50,00 | 10,00 | -21.610 | 21.610 | |
| 2025-12-08 |
|
4 | FOA |
Finance of America Companies Inc.
Class A Common Stock |
S - Sale | -385.855 | 385.855 | -50,00 | 10,00 | -3.858.550 | 3.858.550 | |
| 2025-11-24 |
|
4 | NONE |
Blackstone Private Real Estate Credit & Income Fund
Common Shares of Beneficial Interest |
P - Purchase | 192.604 | 5.013.119 | 4,00 | 25,96 | 5.000.000 | 130.140.581 | |
| 2025-11-24 |
|
4 | NONE |
Blackstone Private Real Estate Credit & Income Fund
Common Shares of Beneficial Interest |
P - Purchase | 192.604 | 5.013.119 | 4,00 | 25,96 | 5.000.000 | 130.140.581 | |
| 2025-11-05 |
|
4 | BMBL |
Bumble Inc.
Class B Common Stock |
J - Other | -1 | 0 | -100,00 | ||||
| 2025-11-05 |
|
4 | BMBL |
Bumble Inc.
Class B Common Stock |
J - Other | -1 | 0 | -100,00 | ||||
| 2025-11-05 |
|
4 | BMBL |
Bumble Inc.
Class B Common Stock |
J - Other | -1 | 0 | -100,00 | ||||
| 2025-11-05 |
|
4 | BMBL |
Bumble Inc.
Class A Common Stock |
C - Conversion | 32.291 | 32.291 | |||||
| 2025-11-05 |
|
4 | BMBL |
Bumble Inc.
Class A Common Stock |
C - Conversion | 147.871 | 147.871 | |||||
| 2025-11-05 |
|
4 | BMBL |
Bumble Inc.
Class A Common Stock |
C - Conversion | 16.385.953 | 16.394.804 | 185.131,09 | ||||
| 2025-10-21 |
|
4 | NONE |
Blackstone Private Real Estate Credit & Income Fund
Common Shares of Beneficial Interest |
P - Purchase | 679.084 | 4.820.515 | 16,40 | 25,77 | 17.500.000 | 124.224.683 | |
| 2025-10-21 |
|
4 | NONE |
Blackstone Private Real Estate Credit & Income Fund
Common Shares of Beneficial Interest |
P - Purchase | 8.634.071 | 16.140.279 | 115,03 | 25,77 | 222.500.000 | 415.935.001 | |
| 2025-09-22 |
|
4 | NONE |
Blackstone Private Real Estate Credit & Income Fund
Common Shares of Beneficial Interest |
P - Purchase | 1.171.417 | 4.141.431 | 39,44 | 25,61 | 30.000.000 | 106.062.054 | |
| 2025-09-22 |
|
4 | NONE |
Blackstone Private Real Estate Credit & Income Fund
Common Shares of Beneficial Interest |
P - Purchase | 1.366.654 | 7.506.209 | 22,26 | 25,61 | 35.000.000 | 192.234.008 | |
| 2025-09-11 | 3 | LGN |
Legence Corp.
Class A Common Stock |
178.571 | ||||||||
| 2025-09-11 | 3 | LGN |
Legence Corp.
Class A Common Stock |
28.844.369 | ||||||||
| 2025-09-11 | 3 | LGN |
Legence Corp.
Class B Common Stock |
46.680.762 | ||||||||
| 2025-08-22 |
|
4 | NONE |
Blackstone Private Real Estate Credit & Income Fund
Common Shares of Beneficial Interest |
P - Purchase | 1.176.471 | 2.970.014 | 65,59 | 25,50 | 30.000.000 | 75.735.353 | |
| 2025-08-22 |
|
4 | NONE |
Blackstone Private Real Estate Credit & Income Fund
Common Shares of Beneficial Interest |
P - Purchase | 1.960.784 | 6.139.555 | 46,92 | 25,50 | 50.000.000 | 156.558.657 | |
| 2025-08-21 |
|
4 | STR |
Sitio Royalties Corp.
Class C Common Stock |
J - Other | -11.400.218 | 0 | -100,00 | ||||
| 2025-08-21 |
|
4 | STR |
Sitio Royalties Corp.
Class C Common Stock |
J - Other | -8.637.727 | 0 | -100,00 | ||||
| 2025-08-15 |
|
4 | BMBL |
Bumble Inc.
Class A Common Stock |
S - Sale | -2.412.589 | 5.404.511 | -30,86 | 6,26 | -15.102.807 | 33.832.239 | |
| 2025-08-15 |
|
4 | BMBL |
Bumble Inc.
Class A Common Stock |
S - Sale | -904.128 | 2.025.363 | -30,86 | 6,26 | -5.659.841 | 12.678.772 | |
| 2025-08-15 |
|
4 | BMBL |
Bumble Inc.
Class A Common Stock |
S - Sale | -5.569.296 | 12.475.943 | -30,86 | 6,26 | -34.863.793 | 78.099.403 | |
| 2025-08-15 |
|
4 | BMBL |
Bumble Inc.
Class A Common Stock |
S - Sale | -404.761 | 906.717 | -30,86 | 6,26 | -2.533.804 | 5.676.048 | |
| 2025-08-15 |
|
4 | BMBL |
Bumble Inc.
Class A Common Stock |
S - Sale | -14.415 | 0 | -100,00 | 6,26 | -90.238 | ||
| 2025-08-15 |
|
4 | BMBL |
Bumble Inc.
Class A Common Stock |
S - Sale | -66.010 | 0 | -100,00 | 6,26 | -413.223 | ||
| 2025-08-15 |
|
4 | BMBL |
Bumble Inc.
Class A Common Stock |
S - Sale | -7.318.685 | 8.851 | -99,88 | 6,26 | -45.814.968 | 55.407 | |
| 2025-08-15 |
|
4 | BMBL |
Bumble Inc.
Class A Common Stock |
C - Conversion | 14.415 | 14.415 | |||||
| 2025-08-15 |
|
4 | BMBL |
Bumble Inc.
Class A Common Stock |
C - Conversion | 66.010 | 66.010 | |||||
| 2025-08-15 |
|
4 | BMBL |
Bumble Inc.
Class A Common Stock |
C - Conversion | 7.314.734 | 7.327.536 | 57.137,43 | ||||
| 2025-07-18 |
|
4 | NONE |
Blackstone Private Real Estate Credit & Income Fund
Common Shares of Beneficial Interest |
P - Purchase | 1.189.532 | 4.178.771 | 39,79 | 25,22 | 30.000.000 | 105.388.601 | |
| 2025-06-27 | 3 | NONE |
Blackstone Private Real Estate Credit & Income Fund
Common Shares of Beneficial Interest |
2.989.239 | ||||||||
| 2025-06-27 | 3 | NONE |
Blackstone Private Real Estate Credit & Income Fund
Common Shares of Beneficial Interest |
1.793.543 | ||||||||
| 2025-06-11 |
|
4 | LOAR |
Loar Holdings Inc.
Common Stock, par value $0.01 per share |
S - Sale | -81.621 | 209.042 | -28,08 | 82,61 | -6.742.711 | 17.268.960 | |
| 2025-06-11 |
|
4 | LOAR |
Loar Holdings Inc.
Common Stock, par value $0.01 per share |
S - Sale | -49.134 | 125.840 | -28,08 | 82,61 | -4.058.960 | 10.395.642 | |
| 2025-06-11 |
|
4 | LOAR |
Loar Holdings Inc.
Common Stock, par value $0.01 per share |
S - Sale | -113.327 | 290.246 | -28,08 | 82,61 | -9.361.943 | 23.977.222 | |
| 2025-06-11 |
|
4 | LOAR |
Loar Holdings Inc.
Common Stock, par value $0.01 per share |
S - Sale | -99.858 | 255.750 | -28,08 | 82,61 | -8.249.269 | 21.127.508 | |
| 2025-06-11 |
|
4 | LOAR |
Loar Holdings Inc.
Common Stock, par value $0.01 per share |
S - Sale | -2.656.060 | 6.802.527 | -28,08 | 82,61 | -219.417.117 | 561.956.755 | |
| 2025-05-28 |
|
4 | TASK |
TaskUs, Inc.
Class A Common Stock |
C - Conversion | 10.094.674 | 10.094.674 | |||||
| 2025-05-20 |
|
4 | LOAR |
Loar Holdings Inc.
Common Stock, par value $0.01 per share |
S - Sale | -6.382 | 290.663 | -2,15 | 80,91 | -516.353 | 23.516.875 | |
| 2025-05-20 |
|
4 | LOAR |
Loar Holdings Inc.
Common Stock, par value $0.01 per share |
S - Sale | -3.842 | 174.974 | -2,15 | 80,91 | -310.847 | 14.156.744 | |
| 2025-05-20 |
|
4 | LOAR |
Loar Holdings Inc.
Common Stock, par value $0.01 per share |
S - Sale | -8.861 | 403.573 | -2,15 | 80,91 | -716.923 | 32.652.163 | |
| 2025-05-20 |
|
4 | LOAR |
Loar Holdings Inc.
Common Stock, par value $0.01 per share |
S - Sale | -7.808 | 355.608 | -2,15 | 80,91 | -631.727 | 28.771.425 | |
| 2025-05-20 |
|
4 | LOAR |
Loar Holdings Inc.
Common Stock, par value $0.01 per share |
S - Sale | -207.670 | 9.458.587 | -2,15 | 80,91 | -16.802.102 | 765.272.519 | |
| 2025-05-20 |
|
4 | LOAR |
Loar Holdings Inc.
Common Stock, par value $0.01 per share |
S - Sale | -42.388 | 297.045 | -12,49 | 80,91 | -3.429.516 | 24.033.228 | |
| 2025-05-20 |
|
4 | LOAR |
Loar Holdings Inc.
Common Stock, par value $0.01 per share |
S - Sale | -25.517 | 178.816 | -12,49 | 80,91 | -2.064.522 | 14.467.591 | |
| 2025-05-20 |
|
4 | LOAR |
Loar Holdings Inc.
Common Stock, par value $0.01 per share |
S - Sale | -58.854 | 412.434 | -12,49 | 80,91 | -4.761.742 | 33.369.086 | |
| 2025-05-20 |
|
4 | LOAR |
Loar Holdings Inc.
Common Stock, par value $0.01 per share |
S - Sale | -51.860 | 363.416 | -12,49 | 80,91 | -4.195.873 | 29.403.153 | |
| 2025-05-20 |
|
4 | LOAR |
Loar Holdings Inc.
Common Stock, par value $0.01 per share |
S - Sale | -1.379.375 | 9.666.257 | -12,49 | 80,91 | -111.602.059 | 782.074.621 | |
| 2025-05-02 |
|
4 | BMACX |
Blackstone Private Multi-Asset Credit & Income Fund
Class I Common Shares of Beneficial Interest |
P - Purchase | 1.660.000 | 1.666.667 | 24.900,00 | 15,00 | 24.900.000 | 25.000.000 | |
| 2025-05-02 |
|
4 | NONE |
Blackstone Private Real Estate Credit & Income Fund
Common Shares of Beneficial Interest |
J - Other | -100 | 0 | -100,00 | ||||
| 2025-04-18 |
|
4 | AMPS |
Altus Power, Inc.
Class A Common Stock |
D - Sale to Issuer | -21.116.125 | 0 | -100,00 | 5,00 | -105.580.625 | ||
| 2025-04-15 | 3 | NONE |
Blackstone Private Real Estate Credit & Income Fund
Common Shares of Beneficial Interest |
100 | ||||||||
| 2025-03-10 | 3 | BMACX |
Blackstone Private Multi-Asset Credit & Income Fund
Class I Common Shares of Beneficial Interest |
6.667 | ||||||||
| 2024-12-16 |
|
4 | LOAR |
Loar Holdings Inc.
Common Stock, par value $0.01 per share |
S - Sale | -9.128 | 339.433 | -2,62 | 81,18 | -740.965 | 27.553.474 | |
| 2024-12-16 |
|
4 | LOAR |
Loar Holdings Inc.
Common Stock, par value $0.01 per share |
S - Sale | -5.495 | 204.333 | -2,62 | 81,18 | -446.057 | 16.586.731 | |
| 2024-12-16 |
|
4 | LOAR |
Loar Holdings Inc.
Common Stock, par value $0.01 per share |
S - Sale | -12.673 | 471.288 | -2,62 | 81,18 | -1.028.731 | 38.256.803 | |
| 2024-12-16 |
|
4 | LOAR |
Loar Holdings Inc.
Common Stock, par value $0.01 per share |
S - Sale | -11.167 | 415.276 | -2,62 | 81,18 | -906.481 | 33.710.029 | |
| 2024-12-16 |
|
4 | LOAR |
Loar Holdings Inc.
Common Stock, par value $0.01 per share |
S - Sale | -297.024 | 11.045.632 | -2,62 | 81,18 | -24.110.923 | 896.629.178 | |
| 2024-10-28 |
|
4 | KNTK |
Kinetik Holdings Inc.
Class A Common Stock |
C - Conversion | 78 | 1.658.066 | 0,00 | ||||
| 2024-10-28 |
|
4 | KNTK |
Kinetik Holdings Inc.
Class A Common Stock |
C - Conversion | 481 | 10.256.208 | 0,00 | ||||
| 2024-08-23 |
|
4 | GTES |
Gates Industrial Corp plc
Ordinary Shares |
S - Sale | -646.199 | 451.496 | -58,87 | 16,58 | -10.713.979 | 7.485.804 | |
| 2024-08-23 |
|
4 | GTES |
Gates Industrial Corp plc
Ordinary Shares |
S - Sale | -2.804.217 | 1.959.298 | -58,87 | 16,58 | -46.493.918 | 32.485.161 | |
| 2024-08-23 |
|
4 | GTES |
Gates Industrial Corp plc
Ordinary Shares |
S - Sale | -45.521 | 31.805 | -58,87 | 16,58 | -754.738 | 527.327 | |
| 2024-08-23 |
|
4 | GTES |
Gates Industrial Corp plc
Ordinary Shares |
S - Sale | -13.294.543 | 9.288.859 | -58,87 | 16,58 | -220.423.523 | 154.009.282 | |
| 2024-08-23 |
|
4 | GTES |
Gates Industrial Corp plc
Ordinary Shares |
S - Sale | -13.748.723 | 9.606.196 | -58,87 | 16,58 | -227.953.827 | 159.270.730 | |
| 2024-05-23 |
|
4 | GTES |
Gates Industrial Corp plc
Ordinary Shares |
S - Sale | -425.837 | 1.097.695 | -27,95 | 16,33 | -6.953.918 | 17.925.359 | |
| 2024-05-23 |
|
4 | GTES |
Gates Industrial Corp plc
Ordinary Shares |
S - Sale | -1.847.949 | 4.763.515 | -27,95 | 16,33 | -30.177.007 | 77.788.200 | |
| 2024-05-23 |
|
4 | GTES |
Gates Industrial Corp plc
Ordinary Shares |
S - Sale | -29.998 | 77.326 | -27,95 | 16,33 | -489.867 | 1.262.734 | |
| 2024-05-23 |
|
4 | GTES |
Gates Industrial Corp plc
Ordinary Shares |
S - Sale | -8.760.958 | 22.583.402 | -27,95 | 16,33 | -143.066.444 | 368.786.955 | |
| 2024-05-23 |
|
4 | GTES |
Gates Industrial Corp plc
Ordinary Shares |
S - Sale | -9.060.258 | 23.354.919 | -27,95 | 16,33 | -147.954.013 | 381.385.827 | |
| 2024-05-10 | 3 | CRBG |
Corebridge Financial, Inc.
Common stock, par value $0.01 per share |
61.962.123 | ||||||||
| 2024-04-29 |
|
4 | KNTK |
Kinetik Holdings Inc.
Class A Common Stock |
C - Conversion | 78 | 1.657.988 | 0,00 | ||||
| 2024-04-29 |
|
4 | KNTK |
Kinetik Holdings Inc.
Class A Common Stock |
C - Conversion | 481 | 10.255.727 | 0,00 | ||||
| 2024-04-24 | 3 | LOAR |
Loar Holdings Inc.
Common Stock, par value $0.01 per share |
11.342.656 | ||||||||
| 2024-04-24 | 3 | LOAR |
Loar Holdings Inc.
Common Stock, par value $0.01 per share |
426.443 | ||||||||
| 2024-04-24 | 3 | LOAR |
Loar Holdings Inc.
Common Stock, par value $0.01 per share |
483.961 | ||||||||
| 2024-04-24 | 3 | LOAR |
Loar Holdings Inc.
Common Stock, par value $0.01 per share |
209.828 | ||||||||
| 2024-04-24 | 3 | LOAR |
Loar Holdings Inc.
Common Stock, par value $0.01 per share |
348.561 | ||||||||
| 2024-04-03 |
|
4 | FOA |
Finance of America Companies Inc.
Class A Common Stock |
J - Other | -172.491 | 24.162.521 | -0,71 | ||||
| 2024-04-03 |
|
4 | FOA |
Finance of America Companies Inc.
Class A Common Stock |
J - Other | -2.262 | 43.228 | -4,97 | ||||
| 2024-04-03 |
|
4 | FOA |
Finance of America Companies Inc.
Class A Common Stock |
C - Conversion | 2.262 | 45.490 | 5,23 | ||||
| 2024-04-03 |
|
4 | FOA |
Finance of America Companies Inc.
Class A Common Stock |
J - Other | -394.081 | 7.717.103 | -4,86 | ||||
| 2024-04-03 |
|
4 | FOA |
Finance of America Companies Inc.
Class A Common Stock |
C - Conversion | 394.081 | 8.111.184 | 5,11 | ||||
| 2024-03-12 |
|
4 | FOA |
Finance of America Companies Inc.
Class A Common Stock |
J - Other | -14.913 | 24.335.012 | -0,06 | ||||
| 2024-03-12 |
|
4 | FOA |
Finance of America Companies Inc.
Class A Common Stock |
J - Other | -196 | 43.228 | -0,45 | ||||
| 2024-03-12 |
|
4 | FOA |
Finance of America Companies Inc.
Class A Common Stock |
C - Conversion | 196 | 43.424 | 0,45 | ||||
| 2024-03-12 |
|
4 | FOA |
Finance of America Companies Inc.
Class A Common Stock |
J - Other | -34.071 | 7.717.103 | -0,44 | ||||
| 2024-03-12 |
|
4 | FOA |
Finance of America Companies Inc.
Class A Common Stock |
C - Conversion | 34.071 | 7.751.174 | 0,44 | ||||
| 2024-03-05 |
|
4 | BMBL |
Bumble Inc.
Class A Common Stock |
S - Sale | -1.067 | 12.802 | -7,69 | 11,10 | -11.840 | 142.061 | |
| 2024-03-05 |
|
4 | BMBL |
Bumble Inc.
Class A Common Stock |
S - Sale | -651.332 | 7.817.100 | -7,69 | 11,10 | -7.227.701 | 86.744.795 | |
| 2024-03-05 |
|
4 | BMBL |
Bumble Inc.
Class A Common Stock |
S - Sale | -244.089 | 2.929.491 | -7,69 | 11,10 | -2.708.607 | 32.507.976 | |
| 2024-03-05 |
|
4 | BMBL |
Bumble Inc.
Class A Common Stock |
S - Sale | -1.503.554 | 18.045.239 | -7,69 | 11,10 | -16.684.638 | 200.244.408 | |
| 2024-03-05 |
|
4 | BMBL |
Bumble Inc.
Class A Common Stock |
S - Sale | -109.274 | 1.311.478 | -7,69 | 11,10 | -1.212.592 | 14.553.209 | |
| 2024-02-21 |
|
4 | GTES |
Gates Industrial Corp plc
Ordinary Shares |
S - Sale | -513.673 | 1.523.532 | -25,21 | 12,04 | -6.187.191 | 18.350.943 | |
| 2024-02-21 |
|
4 | GTES |
Gates Industrial Corp plc
Ordinary Shares |
S - Sale | -2.229.118 | 6.611.464 | -25,21 | 12,04 | -26.849.726 | 79.635.084 | |
| 2024-02-21 |
|
4 | GTES |
Gates Industrial Corp plc
Ordinary Shares |
S - Sale | -36.186 | 107.324 | -25,21 | 12,04 | -435.860 | 1.292.718 | |
| 2024-02-21 |
|
4 | GTES |
Gates Industrial Corp plc
Ordinary Shares |
S - Sale | -10.568.044 | 31.344.360 | -25,21 | 12,04 | -127.292.090 | 377.542.816 | |
| 2024-02-21 |
|
4 | GTES |
Gates Industrial Corp plc
Ordinary Shares |
S - Sale | -10.929.079 | 32.415.177 | -25,21 | 12,04 | -131.640.757 | 390.440.807 | |
| 2023-12-15 |
|
4 | GTES |
Gates Industrial Corp plc
Ordinary Shares |
S - Sale | -365.003 | 2.037.205 | -15,19 | 11,15 | -4.069.783 | 22.714.836 | |
| 2023-12-15 |
|
4 | GTES |
Gates Industrial Corp plc
Ordinary Shares |
S - Sale | -1.583.956 | 8.840.582 | -15,19 | 11,15 | -17.661.109 | 98.572.489 | |
| 2023-12-15 |
|
4 | GTES |
Gates Industrial Corp plc
Ordinary Shares |
S - Sale | -25.713 | 143.510 | -15,19 | 11,15 | -286.700 | 1.600.136 | |
| 2023-12-15 |
|
4 | GTES |
Gates Industrial Corp plc
Ordinary Shares |
S - Sale | -7.509.392 | 41.912.404 | -15,19 | 11,15 | -83.729.721 | 467.323.305 | |
| 2023-12-15 |
|
4 | GTES |
Gates Industrial Corp plc
Ordinary Shares |
S - Sale | -7.765.936 | 43.344.256 | -15,19 | 11,15 | -86.590.186 | 483.288.454 | |
| 2023-12-05 |
|
4 | BMBL |
Bumble Inc.
Class A Common Stock |
S - Sale | -1.706 | 13.869 | -10,95 | 13,88 | -23.680 | 192.511 | |
| 2023-12-05 |
|
4 | BMBL |
Bumble Inc.
Class A Common Stock |
S - Sale | -1.041.402 | 8.468.432 | -10,95 | 13,88 | -14.455.389 | 117.547.764 | |
| 2023-12-05 |
|
4 | BMBL |
Bumble Inc.
Class A Common Stock |
S - Sale | -390.270 | 3.173.580 | -10,95 | 13,88 | -5.417.221 | 44.051.512 | |
| 2023-12-05 |
|
4 | BMBL |
Bumble Inc.
Class A Common Stock |
S - Sale | -2.404.006 | 19.548.793 | -10,95 | 13,88 | -33.369.286 | 271.350.931 | |
| 2023-12-05 |
|
4 | BMBL |
Bumble Inc.
Class A Common Stock |
S - Sale | -174.717 | 1.420.752 | -10,95 | 13,88 | -2.425.194 | 19.721.032 | |
| 2023-11-16 |
|
4 | HG |
Hamilton Insurance Group, Ltd.
Class B Common Stock |
S - Sale | -53.182 | 0 | -100,00 | 14,06 | -747.872 | ||
| 2023-11-16 |
|
4 | HG |
Hamilton Insurance Group, Ltd.
Class B Common Stock |
S - Sale | -918.789 | 0 | -100,00 | 14,06 | -12.920.470 | ||
| 2023-11-14 |
|
4 | FOA |
Finance of America Companies Inc.
Class A Common Stock |
J - Other | -5.965 | 24.349.925 | -0,02 | ||||
| 2023-11-14 |
|
4 | FOA |
Finance of America Companies Inc.
Class A Common Stock |
J - Other | -78 | 43.228 | -0,18 | ||||
| 2023-11-14 |
|
4 | FOA |
Finance of America Companies Inc.
Class A Common Stock |
C - Conversion | 78 | 43.306 | 0,18 | ||||
| 2023-11-14 |
|
4 | FOA |
Finance of America Companies Inc.
Class A Common Stock |
J - Other | -13.628 | 7.717.103 | -0,18 | ||||
| 2023-11-14 |
|
4 | FOA |
Finance of America Companies Inc.
Class A Common Stock |
C - Conversion | 13.628 | 7.730.731 | 0,18 | ||||
| 2023-11-13 |
|
4 | KNTK |
Kinetik Holdings Inc.
Class A Common Stock |
C - Conversion | 78 | 1.257.706 | 0,01 | ||||
| 2023-11-13 |
|
4 | KNTK |
Kinetik Holdings Inc.
Class A Common Stock |
C - Conversion | 481 | 7.779.738 | 0,01 | ||||
| 2023-11-09 | 3 | HG |
Hamilton Insurance Group, Ltd.
Class B Common Stock |
918.789 | ||||||||
| 2023-11-09 | 3 | HG |
Hamilton Insurance Group, Ltd.
Class B Common Stock |
53.182 | ||||||||
| 2023-08-22 |
|
4 | ALIT |
Alight, Inc. / Delaware
Class A common stock |
S - Sale | -388.049 | 43.602 | -89,90 | 7,98 | -3.096.631 | 347.944 | |
| 2023-08-22 |
|
4 | ALIT |
Alight, Inc. / Delaware
Class A common stock |
S - Sale | -387.714 | 23.865.454 | -1,60 | 7,98 | -3.093.958 | 190.446.323 | |
| 2023-08-22 |
|
4 | ALIT |
Alight, Inc. / Delaware
Class A common stock |
S - Sale | -6.967.419 | 431.651 | -94,17 | 7,98 | -55.600.004 | 3.444.575 | |
| 2023-08-22 |
|
4 | ALIT |
Alight, Inc. / Delaware
Class A common stock |
C - Conversion | 7.342.042 | 7.399.070 | 12.874,45 | ||||
| 2023-08-22 |
|
4 | ALIT |
Alight, Inc. / Delaware
Class V common stock |
J - Other | -7.342.042 | 23.842.419 | -23,54 | ||||
| 2023-08-22 |
|
4 | ALIT |
Alight, Inc. / Delaware
Class A common stock |
S - Sale | -6.961.421 | 24.253.168 | -22,30 | 7,98 | -55.552.140 | 193.540.281 | |
| 2023-08-17 | 3 | PTEN |
PATTERSON UTI ENERGY INC
Common Stock |
34.900.000 | ||||||||
| 2023-08-16 |
|
4 | GTES |
Gates Industrial Corp plc
Ordinary Shares |
S - Sale | -1.618.196 | 10.424.538 | -13,44 | 11,57 | -18.722.528 | 120.611.905 | |
| 2023-08-16 |
|
4 | GTES |
Gates Industrial Corp plc
Ordinary Shares |
S - Sale | -26.268 | 169.223 | -13,44 | 11,57 | -303.921 | 1.957.910 | |
| 2023-08-16 |
|
4 | GTES |
Gates Industrial Corp plc
Ordinary Shares |
S - Sale | -7.671.724 | 49.421.796 | -13,44 | 11,57 | -88.761.847 | 571.810.180 | |
| 2023-08-16 |
|
4 | GTES |
Gates Industrial Corp plc
Ordinary Shares |
S - Sale | -7.933.812 | 51.110.192 | -13,44 | 11,57 | -91.794.205 | 591.344.921 | |
| 2023-08-16 |
|
4 | APG |
APi Group Corp
Common Stock |
S - Sale | -32.004 | 0 | -100,00 | 27,80 | -889.711 | ||
| 2023-08-16 |
|
4 | APG |
APi Group Corp
Common Stock |
S - Sale | -2.566.605 | 0 | -100,00 | 27,80 | -71.351.619 | ||
| 2023-08-14 |
|
4 | FOA |
Finance of America Companies Inc.
Class A Common Stock |
J - Other | -30.820 | 24.355.890 | -0,13 | ||||
| 2023-08-14 |
|
4 | FOA |
Finance of America Companies Inc.
Class A Common Stock |
J - Other | -404 | 43.228 | -0,93 | ||||
| 2023-08-14 |
|
4 | FOA |
Finance of America Companies Inc.
Class A Common Stock |
C - Conversion | 404 | 43.632 | 0,93 | ||||
| 2023-08-14 |
|
4 | FOA |
Finance of America Companies Inc.
Class A Common Stock |
J - Other | -70.412 | 7.717.103 | -0,90 | ||||
| 2023-08-14 |
|
4 | FOA |
Finance of America Companies Inc.
Class A Common Stock |
C - Conversion | 70.412 | 7.787.515 | 0,91 | ||||
| 2023-08-02 |
|
4 | KNTK |
Kinetik Holdings Inc.
Class A Common Stock |
C - Conversion | 442 | 1.060.094 | 0,04 | ||||
| 2023-08-02 |
|
4 | KNTK |
Kinetik Holdings Inc.
Class A Common Stock |
C - Conversion | 2.738 | 6.557.389 | 0,04 | ||||
| 2023-06-16 |
|
4 | AMPS |
Altus Power, Inc.
Class A Common Stock |
P - Purchase | 45.000 | 21.116.125 | 0,21 | 5,47 | 246.177 | 115.517.873 | |
| 2023-06-15 |
|
4 | CVT |
CVENT HOLDING CORP.
Common Stock |
S - Sale | -3.000.000 | 0 | -100,00 | 8,50 | -25.500.000 | ||
| 2023-06-12 |
|
4 | AMPS |
Altus Power, Inc.
Class A Common Stock |
P - Purchase | 57.000 | 21.071.125 | 0,27 | 5,25 | 299.301 | 110.642.370 | |
| 2023-06-08 |
|
4 | AMPS |
Altus Power, Inc.
Class A Common Stock |
P - Purchase | 224.000 | 21.014.125 | 1,08 | 5,53 | 1.237.869 | 116.128.258 | |
| 2023-06-08 |
|
4 | AMPS |
Altus Power, Inc.
Class A Common Stock |
P - Purchase | 15.000 | 20.790.125 | 0,07 | 5,17 | 77.548 | 107.482.867 | |
| 2023-05-25 |
|
4 | GTES |
Gates Industrial Corp plc
Ordinary Shares |
S - Sale | -4.484.950 | 12.042.734 | -27,14 | 11,40 | -51.117.218 | 137.257.061 | |
| 2023-05-25 |
|
4 | GTES |
Gates Industrial Corp plc
Ordinary Shares |
S - Sale | -72.804 | 195.491 | -27,14 | 11,40 | -829.784 | 2.228.109 | |
| 2023-05-25 |
|
4 | GTES |
Gates Industrial Corp plc
Ordinary Shares |
S - Sale | -21.262.740 | 57.093.520 | -27,14 | 11,40 | -242.342.079 | 650.723.394 | |
| 2023-05-25 |
|
4 | GTES |
Gates Industrial Corp plc
Ordinary Shares |
S - Sale | -21.989.140 | 59.044.004 | -27,14 | 11,40 | -250.621.223 | 672.954.036 | |
| 2023-05-05 |
|
4 | KNTK |
Kinetik Holdings Inc.
Class A Common Stock |
C - Conversion | 1.696 | 824.445 | 0,21 | ||||
| 2023-05-05 |
|
4 | KNTK |
Kinetik Holdings Inc.
Class A Common Stock |
C - Conversion | 10.498 | 5.099.743 | 0,21 | ||||
| 2023-04-20 |
|
4 | VNOM |
Viper Energy Partners LP
Common Units |
S - Sale | -1.700.000 | 7.002.347 | -19,53 | 30,00 | -51.000.000 | 210.070.410 | |
| 2023-04-20 |
|
4 | VNOM |
Viper Energy Partners LP
Common Units |
S - Sale | -110.400 | 8.702.347 | -1,25 | 30,43 | -3.360.013 | 264.855.061 | |
| 2023-04-18 |
|
4 | VNOM |
Viper Energy Partners LP
Common Units |
S - Sale | -180.000 | 8.812.747 | -2,00 | 30,63 | -5.512.752 | 269.902.715 | |
| 2023-04-18 |
|
4 | VNOM |
Viper Energy Partners LP
Common Units |
S - Sale | -91.100 | 8.992.747 | -1,00 | 30,53 | -2.781.046 | 274.525.185 | |
| 2023-04-14 |
|
4 | VNOM |
Viper Energy Partners LP
Common Units |
S - Sale | -656.381 | 9.083.847 | -6,74 | 30,63 | -20.107.050 | 278.267.302 | |
| 2023-04-14 |
|
4 | VNOM |
Viper Energy Partners LP
Common Units |
S - Sale | -40.000 | 9.740.228 | -0,41 | 30,58 | -1.223.152 | 297.844.484 | |
| 2023-04-12 |
|
4 | VNOM |
Viper Energy Partners LP
Common Units |
S - Sale | -28.000 | 9.780.228 | -0,29 | 30,42 | -851.838 | 297.541.920 | |
| 2023-04-12 |
|
4 | VNOM |
Viper Energy Partners LP
Common Units |
S - Sale | -34.000 | 9.808.228 | -0,35 | 30,15 | -1.025.018 | 295.694.534 | |
| 2023-04-04 |
|
4 | FOA |
Finance of America Companies Inc.
Class A Common Stock |
J - Other | -340.506 | 24.386.710 | -1,38 | ||||
| 2023-04-04 |
|
4 | FOA |
Finance of America Companies Inc.
Class A Common Stock |
J - Other | -4.466 | 43.228 | -9,36 | ||||
| 2023-04-04 |
|
4 | FOA |
Finance of America Companies Inc.
Class A Common Stock |
C - Conversion | 4.466 | 47.694 | 10,33 | ||||
| 2023-04-04 |
|
4 | FOA |
Finance of America Companies Inc.
Class A Common Stock |
J - Other | -777.935 | 7.717.103 | -9,16 | ||||
| 2023-04-04 |
|
4 | FOA |
Finance of America Companies Inc.
Class A Common Stock |
C - Conversion | 777.935 | 8.495.038 | 10,08 | ||||
| 2023-04-04 |
|
4 | FOA |
Finance of America Companies Inc.
Class A Common Stock |
P - Purchase | 43.228 | 43.228 | 1,38 | 59.655 | 59.655 | ||
| 2023-04-04 |
|
4 | FOA |
Finance of America Companies Inc.
Class A Common Stock |
P - Purchase | 3.109.235 | 24.727.216 | 14,38 | 1,38 | 4.290.744 | 34.123.558 | |
| 2023-04-04 |
|
4 | FOA |
Finance of America Companies Inc.
Class A Common Stock |
P - Purchase | 7.717.103 | 7.717.103 | 1,38 | 10.649.602 | 10.649.602 | ||
| 2023-04-04 |
|
4 | CQP |
Cheniere Energy Partners, L.P.
Common Units |
J - Other | 2.453 | 123.848 | 2,02 | ||||
| 2023-04-04 |
|
4 | CQP |
Cheniere Energy Partners, L.P.
Common Units |
J - Other | 6.319 | 338.242 | 1,90 | ||||
| 2023-04-04 |
|
4 | CQP |
Cheniere Energy Partners, L.P.
Common Units |
J - Other | -6.004 | 0 | -100,00 | ||||
| 2023-04-04 |
|
4 | CQP |
Cheniere Energy Partners, L.P.
Common Units |
P - Purchase | 6.004 | 6.004 | 47,46 | 284.934 | 284.934 | ||
| 2023-04-04 |
|
4 | CQP |
Cheniere Energy Partners, L.P.
Common Units |
J - Other | -2.768 | 0 | -100,00 | ||||
| 2023-04-04 |
|
4 | CQP |
Cheniere Energy Partners, L.P.
Common Units |
P - Purchase | 2.768 | 2.768 | 47,46 | 131.362 | 131.362 | ||
| 2023-04-04 |
|
4 | CQP |
Cheniere Energy Partners, L.P.
Common Units |
J - Other | 5.295 | 121.395 | 4,56 | ||||
| 2023-04-04 |
|
4 | CQP |
Cheniere Energy Partners, L.P.
Common Units |
J - Other | 13.639 | 331.923 | 4,29 | ||||
| 2023-04-04 |
|
4 | CQP |
Cheniere Energy Partners, L.P.
Common Units |
J - Other | -12.959 | 0 | -100,00 | ||||
| 2023-04-04 |
|
4 | CQP |
Cheniere Energy Partners, L.P.
Common Units |
P - Purchase | 12.959 | 12.959 | 47,26 | 612.433 | 612.433 | ||
| 2023-04-04 |
|
4 | CQP |
Cheniere Energy Partners, L.P.
Common Units |
J - Other | -5.975 | 0 | -100,00 | ||||
| 2023-04-04 |
|
4 | CQP |
Cheniere Energy Partners, L.P.
Common Units |
P - Purchase | 5.975 | 5.975 | 47,26 | 282.374 | 282.374 | ||
| 2023-03-31 |
|
4 | CQP |
Cheniere Energy Partners, L.P.
Common Units |
J - Other | 19.403 | 116.100 | 20,07 | ||||
| 2023-03-31 |
|
4 | CQP |
Cheniere Energy Partners, L.P.
Common Units |
J - Other | 49.985 | 318.284 | 18,63 | ||||
| 2023-03-31 |
|
4 | CQP |
Cheniere Energy Partners, L.P.
Common Units |
J - Other | -47.490 | 0 | -100,00 | ||||
| 2023-03-31 |
|
4 | CQP |
Cheniere Energy Partners, L.P.
Common Units |
P - Purchase | 47.490 | 47.490 | 47,14 | 2.238.527 | 2.238.527 | ||
| 2023-03-31 |
|
4 | CQP |
Cheniere Energy Partners, L.P.
Common Units |
J - Other | -21.898 | 0 | -100,00 | ||||
| 2023-03-31 |
|
4 | CQP |
Cheniere Energy Partners, L.P.
Common Units |
P - Purchase | 21.898 | 21.898 | 47,14 | 1.032.202 | 1.032.202 | ||
| 2023-03-31 |
|
4 | CQP |
Cheniere Energy Partners, L.P.
Common Units |
J - Other | 7.573 | 96.697 | 8,50 | ||||
| 2023-03-31 |
|
4 | CQP |
Cheniere Energy Partners, L.P.
Common Units |
J - Other | 19.509 | 268.299 | 7,84 | ||||
| 2023-03-31 |
|
4 | CQP |
Cheniere Energy Partners, L.P.
Common Units |
J - Other | -18.535 | 0 | -100,00 | ||||
| 2023-03-31 |
|
4 | CQP |
Cheniere Energy Partners, L.P.
Common Units |
P - Purchase | 18.535 | 18.535 | 47,11 | 873.184 | 873.184 | ||
| 2023-03-31 |
|
4 | CQP |
Cheniere Energy Partners, L.P.
Common Units |
J - Other | -8.547 | 0 | -100,00 | ||||
| 2023-03-31 |
|
4 | CQP |
Cheniere Energy Partners, L.P.
Common Units |
P - Purchase | 8.547 | 8.547 | 47,11 | 402.649 | 402.649 | ||
| 2023-03-29 |
|
4 | CQP |
Cheniere Energy Partners, L.P.
Common Units |
J - Other | 6.249 | 89.124 | 7,54 | ||||
| 2023-03-29 |
|
4 | CQP |
Cheniere Energy Partners, L.P.
Common Units |
J - Other | 16.097 | 248.790 | 6,92 | ||||
| 2023-03-29 |
|
4 | CQP |
Cheniere Energy Partners, L.P.
Common Units |
J - Other | -15.294 | 0 | -100,00 | ||||
| 2023-03-29 |
|
4 | CQP |
Cheniere Energy Partners, L.P.
Common Units |
P - Purchase | 3.398 | 15.294 | 28,56 | 47,02 | 159.788 | 719.185 | |
| 2023-03-29 |
|
4 | CQP |
Cheniere Energy Partners, L.P.
Common Units |
P - Purchase | 11.896 | 11.896 | 46,84 | 557.197 | 557.197 | ||
| 2023-03-29 |
|
4 | CQP |
Cheniere Energy Partners, L.P.
Common Units |
J - Other | -7.052 | 0 | -100,00 | ||||
| 2023-03-29 |
|
4 | CQP |
Cheniere Energy Partners, L.P.
Common Units |
P - Purchase | 1.567 | 7.052 | 28,57 | 47,02 | 73.687 | 331.613 | |
| 2023-03-29 |
|
4 | CQP |
Cheniere Energy Partners, L.P.
Common Units |
P - Purchase | 5.485 | 5.485 | 46,84 | 256.912 | 256.912 | ||
| 2023-03-29 |
|
4 | CQP |
Cheniere Energy Partners, L.P.
Common Units |
J - Other | 14.936 | 82.875 | 21,98 | ||||
| 2023-03-29 |
|
4 | CQP |
Cheniere Energy Partners, L.P.
Common Units |
J - Other | 38.477 | 232.693 | 19,81 | ||||
| 2023-03-29 |
|
4 | CQP |
Cheniere Energy Partners, L.P.
Common Units |
J - Other | -36.557 | 0 | -100,00 | ||||
| 2023-03-29 |
|
4 | CQP |
Cheniere Energy Partners, L.P.
Common Units |
P - Purchase | 30.289 | 36.557 | 483,23 | 45,87 | 1.389.296 | 1.676.796 | |
| 2023-03-29 |
|
4 | CQP |
Cheniere Energy Partners, L.P.
Common Units |
P - Purchase | 6.268 | 6.268 | 45,06 | 282.417 | 282.417 | ||
| 2023-03-29 |
|
4 | CQP |
Cheniere Energy Partners, L.P.
Common Units |
J - Other | -16.856 | 0 | -100,00 | ||||
| 2023-03-29 |
|
4 | CQP |
Cheniere Energy Partners, L.P.
Common Units |
P - Purchase | 13.966 | 16.856 | 483,25 | 45,87 | 640.592 | 773.151 | |
| 2023-03-29 |
|
4 | CQP |
Cheniere Energy Partners, L.P.
Common Units |
P - Purchase | 2.890 | 2.890 | 45,06 | 130.215 | 130.215 | ||
| 2023-03-16 | 3 | CVT |
CVENT HOLDING CORP.
Common Stock |
3.000.000 | ||||||||
| 2023-03-14 |
|
4 | VVNT |
Vivint Smart Home, Inc.
Class A Common Stock |
S - Sale | -4.216 | 0 | -100,00 | 12,00 | -50.592 | ||
| 2023-03-14 |
|
4 | VVNT |
Vivint Smart Home, Inc.
Class A Common Stock |
S - Sale | -9.995.784 | 0 | -100,00 | 12,00 | -119.949.408 | ||
| 2023-03-14 |
|
4 | VVNT |
Vivint Smart Home, Inc.
Class A Common Stock |
S - Sale | -89.889.464 | 0 | -100,00 | 12,00 | -1.078.673.568 | ||
| 2023-03-08 |
|
4 | BMBL |
Bumble Inc.
Class A Common Stock |
S - Sale | -10.149 | 0 | -100,00 | 22,17 | -225.034 | ||
| 2023-03-08 |
|
4 | BMBL |
Bumble Inc.
Class A Common Stock |
C - Conversion | 10.149 | 10.149 | |||||
| 2023-03-08 |
|
4 | BMBL |
Bumble Inc.
Class A Common Stock |
S - Sale | -46.472 | 0 | -100,00 | 22,17 | -1.030.424 | ||
| 2023-03-08 |
|
4 | BMBL |
Bumble Inc.
Class A Common Stock |
C - Conversion | 46.472 | 46.472 | |||||
| 2023-03-08 |
|
4 | BMBL |
Bumble Inc.
Class A Common Stock |
S - Sale | -5.152.496 | 15.575 | -99,70 | 22,17 | -114.246.294 | 345.344 | |
| 2023-03-08 |
|
4 | BMBL |
Bumble Inc.
Class A Common Stock |
C - Conversion | 5.149.714 | 5.168.071 | 28.053,14 | ||||
| 2023-03-08 |
|
4 | BMBL |
Bumble Inc.
Class A Common Stock |
S - Sale | -1.698.508 | 9.509.834 | -15,15 | 22,17 | -37.661.018 | 210.861.549 | |
| 2023-03-08 |
|
4 | BMBL |
Bumble Inc.
Class A Common Stock |
S - Sale | -636.523 | 3.563.850 | -15,15 | 22,17 | -14.113.624 | 79.021.246 | |
| 2023-03-08 |
|
4 | BMBL |
Bumble Inc.
Class A Common Stock |
S - Sale | -3.920.892 | 21.952.799 | -15,15 | 22,17 | -86.937.938 | 486.759.412 | |
| 2023-03-08 |
|
4 | BMBL |
Bumble Inc.
Class A Common Stock |
S - Sale | -284.960 | 1.595.469 | -15,15 | 22,17 | -6.318.418 | 35.376.334 | |
| 2023-03-06 |
|
4 | ALIT |
Alight, Inc. / Delaware
Class A common stock |
S - Sale | -303.584 | 57.028 | -84,19 | 8,71 | -2.644.217 | 496.714 | |
| 2023-03-06 |
|
4 | ALIT |
Alight, Inc. / Delaware
Class A common stock |
S - Sale | -303.323 | 31.214.589 | -0,96 | 8,71 | -2.641.943 | 271.879.070 | |
| 2023-03-06 |
|
4 | ALIT |
Alight, Inc. / Delaware
Class A common stock |
S - Sale | -13.983.894 | 360.612 | -97,49 | 8,71 | -121.799.717 | 3.140.931 | |
| 2023-03-06 |
|
4 | ALIT |
Alight, Inc. / Delaware
Class A common stock |
C - Conversion | 14.261.397 | 14.344.506 | 17.159,87 | ||||
| 2023-03-06 |
|
4 | ALIT |
Alight, Inc. / Delaware
Class V common stock |
J - Other | -14.261.397 | 31.184.461 | -31,38 | ||||
| 2023-03-06 |
|
4 | ALIT |
Alight, Inc. / Delaware
Class A common stock |
S - Sale | -13.971.851 | 31.517.912 | -30,71 | 8,71 | -121.694.822 | 274.521.014 | |
| 2023-02-02 |
|
4 | KNTK |
Kinetik Holdings Inc.
Class A Common Stock |
C - Conversion | 554 | 583.812 | 0,09 | ||||
| 2023-02-02 |
|
4 | KNTK |
Kinetik Holdings Inc.
Class A Common Stock |
C - Conversion | 3.433 | 3.611.272 | 0,10 | ||||
| 2023-01-30 |
|
4 | VNOM |
Viper Energy Partners LP
Common Units |
S - Sale | -2.000 | 9.842.228 | -0,02 | 33,05 | -66.094 | 325.257.093 | |
| 2023-01-30 |
|
4 | VNOM |
Viper Energy Partners LP
Common Units |
S - Sale | -205.500 | 9.844.228 | -2,04 | 33,00 | -6.781.952 | 324.881.181 | |
| 2023-01-24 | 3 | BAER |
Wildfire New PubCo, Inc.
Common Stock |
9.389.895 | ||||||||
| 2023-01-24 | 3 | BAER |
Wildfire New PubCo, Inc.
Common Stock |
162.194 | ||||||||
| 2023-01-24 | 3 | BAER |
Wildfire New PubCo, Inc.
Common Stock |
72.521 | ||||||||
| 2023-01-17 |
|
4 | FOA |
Finance of America Companies Inc.
Class A Common Stock |
J - Other | -98.424 | 21.617.981 | -0,45 | ||||
| 2023-01-17 |
|
4 | FOA |
Finance of America Companies Inc.
Class A Common Stock |
J - Other | -1.291 | 0 | -100,00 | ||||
| 2023-01-17 |
|
4 | FOA |
Finance of America Companies Inc.
Class A Common Stock |
C - Conversion | 1.291 | 1.291 | |||||
| 2023-01-17 |
|
4 | FOA |
Finance of America Companies Inc.
Class A Common Stock |
J - Other | -224.864 | 0 | -100,00 | ||||
| 2023-01-17 |
|
4 | FOA |
Finance of America Companies Inc.
Class A Common Stock |
C - Conversion | 224.864 | 224.864 | |||||
| 2022-12-29 |
|
4 | STR |
STR Sub Inc.
Class C Common Stock |
J - Other | -11.400.218 | 0 | -100,00 | ||||
| 2022-12-29 |
|
4 | STR |
STR Sub Inc.
Class C Common Stock |
J - Other | -8.637.727 | 0 | -100,00 | ||||
| 2022-12-29 | 3 | STR |
Sitio Royalties Corp.
Class C Common Stock |
8.637.727 | ||||||||
| 2022-12-29 | 3 | STR |
Sitio Royalties Corp.
Class C Common Stock |
11.400.218 | ||||||||
| 2022-12-16 |
|
4 | ALIT |
Alight, Inc. / Delaware
Class A common stock |
S - Sale | -3.172.150 | 83.109 | -97,45 | 8,00 | -25.377.200 | 664.872 | |
| 2022-12-16 |
|
4 | ALIT |
Alight, Inc. / Delaware
Class A common stock |
C - Conversion | 3.166.358 | 3.255.259 | 3.561,67 | ||||
| 2022-12-16 |
|
4 | ALIT |
Alight, Inc. / Delaware
Class V common stock |
J - Other | -3.166.358 | 45.445.858 | -6,51 | ||||
| 2022-12-16 |
|
4 | ALIT |
Alight, Inc. / Delaware
Class A common stock |
S - Sale | -3.169.418 | 45.489.763 | -6,51 | 8,00 | -25.355.344 | 363.918.104 | |
| 2022-12-14 |
|
4 | SARA |
SARATOGA RESOURCES INC /TX
Common Stock |
J - Other | -4.800.000 | 0 | -100,00 | ||||
| 2022-11-17 |
|
4 | ALIT |
Alight, Inc. / Delaware
Class V Common Stock |
J - Other | -619.388 | 4.961.364 | -11,10 | ||||
| 2022-11-17 |
|
4 | ALIT |
Alight, Inc. / Delaware
Class V Common Stock |
J - Other | -58.078 | 465.213 | -11,10 | ||||
| 2022-11-17 |
|
4 | ALIT |
Alight, Inc. / Delaware
Class V Common Stock |
J - Other | -20.152 | 161.420 | -11,10 | ||||
| 2022-11-17 |
|
4 | ALIT |
Alight, Inc. / Delaware
Class V Common Stock |
J - Other | -5.371.237 | 43.024.219 | -11,10 | ||||
| 2022-11-17 |
|
4 | ALIT |
Alight, Inc. / Delaware
Class A Common Stock |
S - Sale | -6.074.717 | 48.659.181 | -11,10 | 7,46 | -45.317.389 | 362.997.490 | |
| 2022-11-17 |
|
4 | ALIT |
Alight, Inc. / Delaware
Class A Common Stock |
S - Sale | -620.521 | 9.073 | -98,56 | 7,46 | -4.629.087 | 67.685 | |
| 2022-11-17 |
|
4 | ALIT |
Alight, Inc. / Delaware
Class A Common Stock |
S - Sale | -58.184 | 851 | -98,56 | 7,46 | -434.053 | 6.348 | |
| 2022-11-17 |
|
4 | ALIT |
Alight, Inc. / Delaware
Class A Common Stock |
S - Sale | -20.189 | 295 | -98,56 | 7,46 | -150.610 | 2.201 | |
| 2022-11-17 |
|
4 | ALIT |
Alight, Inc. / Delaware
Class A Common Stock |
S - Sale | -5.381.060 | 78.682 | -98,56 | 7,46 | -40.142.708 | 586.968 | |
| 2022-11-17 |
|
4 | ALIT |
Alight, Inc. / Delaware
Class A Common Stock |
C - Conversion | 619.388 | 629.594 | 6.068,86 | ||||
| 2022-11-17 |
|
4 | ALIT |
Alight, Inc. / Delaware
Class A Common Stock |
C - Conversion | 58.078 | 59.035 | 6.068,76 | ||||
| 2022-11-17 |
|
4 | ALIT |
Alight, Inc. / Delaware
Class A Common Stock |
C - Conversion | 20.152 | 20.484 | 6.069,88 | ||||
| 2022-11-17 |
|
4 | ALIT |
Alight, Inc. / Delaware
Class A Common Stock |
C - Conversion | 5.371.237 | 5.459.742 | 6.068,85 | ||||
| 2022-11-16 |
|
4 | VNOM |
Viper Energy Partners LP
Common Units |
S - Sale | -85.000 | 10.049.728 | -0,84 | 33,45 | -2.842.978 | 336.131.242 | |
| 2022-11-16 |
|
4 | VNOM |
Viper Energy Partners LP
Common Units |
S - Sale | -128.200 | 10.134.728 | -1,25 | 33,83 | -4.337.173 | 342.871.023 | |
| 2022-11-14 | 3 | APG |
APi Group Corp
Common Stock |
1.440.739 | ||||||||
| 2022-11-14 | 3 | APG |
APi Group Corp
Common Stock |
17.966 | ||||||||
| 2022-11-10 |
|
4 | VNOM |
Viper Energy Partners LP
Common Units |
S - Sale | -32.072 | 10.262.928 | -0,31 | 35,52 | -1.139.287 | 364.567.939 | |
| 2022-11-07 |
|
4 | VNOM |
Viper Energy Partners LP
Common Units |
S - Sale | -2.773 | 10.295.000 | -0,03 | 35,81 | -99.301 | 368.662.920 | |
| 2022-11-07 |
|
4 | VNOM |
Viper Energy Partners LP
Common Units |
S - Sale | -177.227 | 10.297.773 | -1,69 | 35,47 | -6.286.490 | 365.276.425 | |
| 2022-11-07 |
|
4 | VNOM |
Viper Energy Partners LP
Common Units |
S - Sale | -205.000 | 10.475.000 | -1,92 | 34,36 | -7.044.784 | 359.971.280 | |
| 2022-11-07 |
|
4 | VNOM |
Viper Energy Partners LP
Common Units |
S - Sale | -262.870 | 10.680.000 | -2,40 | 34,33 | -9.023.801 | 366.623.040 | |
| 2022-11-07 |
|
4 | VNOM |
Viper Energy Partners LP
Common Units |
S - Sale | -77.130 | 10.942.870 | -0,70 | 33,86 | -2.611.306 | 370.480.712 | |
| 2022-11-04 |
|
4 | KNTK |
Kinetik Holdings Inc.
Class A Common Stock |
C - Conversion | 131 | 380.870 | 0,03 | ||||
| 2022-11-04 |
|
4 | KNTK |
Kinetik Holdings Inc.
Class A Common Stock |
C - Conversion | 813 | 2.355.942 | 0,03 | ||||
| 2022-11-03 |
|
4 | VNOM |
Viper Energy Partners LP
Common Units |
S - Sale | -728 | 11.020.000 | -0,01 | 34,25 | -24.937 | 377.481.284 | |
| 2022-11-03 |
|
4 | VNOM |
Viper Energy Partners LP
Common Units |
S - Sale | -124.272 | 11.020.728 | -1,12 | 33,73 | -4.191.682 | 371.728.053 | |
| 2022-11-03 |
|
4 | VNOM |
Viper Energy Partners LP
Common Units |
S - Sale | -60.000 | 11.145.000 | -0,54 | 33,59 | -2.015.370 | 374.354.978 | |
| 2022-11-01 |
|
4 | VNOM |
Viper Energy Partners LP
Common Units |
S - Sale | -65.000 | 11.205.000 | -0,58 | 33,42 | -2.172.521 | 374.509.197 | |
| 2022-11-01 |
|
4 | VNOM |
Viper Energy Partners LP
Common Units |
S - Sale | -30.000 | 11.270.000 | -0,27 | 33,15 | -994.389 | 373.558.801 | |
| 2022-11-01 |
|
4 | VNOM |
Viper Energy Partners LP
Common Units |
S - Sale | -17.846 | 0 | -100,00 | 33,13 | -591.154 | ||
| 2022-10-28 |
|
4 | VNOM |
Viper Energy Partners LP
Common Units |
S - Sale | -6.601 | 17.846 | -27,00 | 34,11 | -225.191 | 608.811 | |
| 2022-10-28 |
|
4 | VNOM |
Viper Energy Partners LP
Common Units |
S - Sale | -59.399 | 24.447 | -70,84 | 33,61 | -1.996.192 | 821.578 | |
| 2022-10-28 |
|
4 | VNOM |
Viper Energy Partners LP
Common Units |
S - Sale | -85.000 | 83.846 | -50,34 | 33,69 | -2.863.250 | 2.824.378 | |
| 2022-10-26 |
|
4 | VNOM |
Viper Energy Partners LP
Common Units |
S - Sale | -15.000 | 168.846 | -8,16 | 33,04 | -495.602 | 5.578.689 | |
| 2022-10-26 |
|
4 | VNOM |
Viper Energy Partners LP
Common Units |
S - Sale | -45.000 | 183.846 | -19,66 | 33,07 | -1.488.208 | 6.080.026 | |
| 2022-10-24 |
|
4 | VNOM |
Viper Energy Partners LP
Common Units |
S - Sale | -47.000 | 228.846 | -17,04 | 33,00 | -1.551.056 | 7.552.193 | |
| 2022-10-24 |
|
4 | VNOM |
Viper Energy Partners LP
Common Units |
S - Sale | -104.600 | 275.846 | -27,49 | 32,65 | -3.415.023 | 9.005.931 | |
| 2022-10-20 |
|
4 | VNOM |
Viper Energy Partners LP
Common Units |
S - Sale | -315.000 | 380.446 | -45,29 | 32,74 | -10.313.824 | 12.456.677 | |
| 2022-10-20 |
|
4 | VNOM |
Viper Energy Partners LP
Common Units |
S - Sale | -4.200 | 695.446 | -0,60 | 32,62 | -137.011 | 22.686.631 | |
| 2022-10-14 |
|
4 | VNOM |
Viper Energy Partners LP
Common Units |
S - Sale | -122.500 | 699.646 | -14,90 | 32,77 | -4.013.896 | 22.924.951 | |
| 2022-10-14 |
|
4 | VNOM |
Viper Energy Partners LP
Common Units |
S - Sale | -4.410 | 822.146 | -0,53 | 32,54 | -143.481 | 26.748.849 | |
| 2022-10-12 |
|
4 | AMPS |
Altus Power, Inc.
Class A Common Stock |
S - Sale | -1.050.000 | 20.775.125 | -4,81 | 11,01 | -11.560.500 | 228.734.126 | |
| 2022-10-12 |
|
4 | VNOM |
Viper Energy Partners LP
Common Units |
S - Sale | -31.500 | 826.556 | -3,67 | 32,57 | -1.025.983 | 26.921.673 | |
| 2022-10-12 |
|
4 | VNOM |
Viper Energy Partners LP
Common Units |
S - Sale | -4.744 | 858.056 | -0,55 | 32,53 | -154.334 | 27.914.707 | |
| 2022-10-05 |
|
4 | CHNG |
Change Healthcare Inc.
Common Stock |
D - Sale to Issuer | -574.151 | 0 | -100,00 | 25,75 | -14.784.388 | ||
| 2022-10-05 |
|
4 | CHNG |
Change Healthcare Inc.
Common Stock |
D - Sale to Issuer | -5.434 | 0 | -100,00 | 25,75 | -139.926 | ||
| 2022-10-05 |
|
4 | CHNG |
Change Healthcare Inc.
Common Stock |
D - Sale to Issuer | -59.040.668 | 0 | -100,00 | 25,75 | -1.520.297.201 | ||
| 2022-10-03 |
|
4 | AMPS |
Altus Power, Inc.
Class A Common Stock |
S - Sale | -7.000.000 | 21.825.125 | -24,28 | 11,01 | -77.070.000 | 240.294.626 | |
| 2022-08-29 |
|
4 | VNOM |
Viper Energy Partners LP
Common Units |
S - Sale | -7.200 | 862.800 | -0,83 | 32,68 | -235.321 | 28.199.324 | |
| 2022-08-25 |
|
4 | VNOM |
Viper Energy Partners LP
Common Units |
S - Sale | -28.993 | 870.000 | -3,23 | 32,63 | -946.015 | 28.387.317 | |
| 2022-08-25 |
|
4 | VNOM |
Viper Energy Partners LP
Common Units |
S - Sale | -5.179 | 898.993 | -0,57 | 33,66 | -174.311 | 30.257.587 | |
| 2022-08-25 |
|
4 | VNOM |
Viper Energy Partners LP
Common Units |
S - Sale | -36.321 | 904.172 | -3,86 | 32,84 | -1.192.800 | 29.693.461 | |
| 2022-08-10 |
|
4 | FOA |
Finance of America Companies Inc.
Class A Common Stock |
J - Other | -97.429 | 21.716.405 | -0,45 | ||||
| 2022-08-10 |
|
4 | FOA |
Finance of America Companies Inc.
Class A Common Stock |
J - Other | -1.278 | 0 | -100,00 | ||||
| 2022-08-10 |
|
4 | FOA |
Finance of America Companies Inc.
Class A Common Stock |
C - Conversion | 1.278 | 1.278 | |||||
| 2022-08-10 |
|
4 | FOA |
Finance of America Companies Inc.
Class A Common Stock |
J - Other | -222.591 | 0 | -100,00 | ||||
| 2022-08-10 |
|
4 | FOA |
Finance of America Companies Inc.
Class A Common Stock |
C - Conversion | 222.591 | 222.591 | |||||
| 2022-08-08 | 3 | CHK |
CHESAPEAKE ENERGY CORP
Common Stock |
1.165.899 | ||||||||
| 2022-08-08 | 3 | CHK |
CHESAPEAKE ENERGY CORP
Common Stock |
11.500.000 | ||||||||
| 2022-08-05 |
|
4 | KNTK |
Kinetik Holdings Inc.
Class A Common Stock |
C - Conversion | 854 | 197.380 | 0,43 | ||||
| 2022-08-05 |
|
4 | KNTK |
Kinetik Holdings Inc.
Class A Common Stock |
C - Conversion | 5.289 | 1.220.939 | 0,44 | ||||
| 2022-06-10 |
|
4 | VNOM |
Viper Energy Partners LP
Common Units |
S - Sale | -50.000 | 940.493 | -5,05 | 35,39 | -1.769.360 | 33.281.414 | |
| 2022-06-09 |
|
4 | STR |
Sitio Royalties Corp.
Class C Common Stock |
J - Other | 12.165.172 | 12.165.172 | |||||
| 2022-06-08 |
|
4 | VNOM |
Viper Energy Partners LP
Common Units |
S - Sale | -80.000 | 990.493 | -7,47 | 35,32 | -2.825.528 | 34.983.321 | |
| 2022-06-08 |
|
4 | VNOM |
Viper Energy Partners LP
Common Units |
S - Sale | -6.692 | 1.070.493 | -0,62 | 35,05 | -234.538 | 37.518.103 | |
| 2022-06-06 |
|
4 | VNOM |
Viper Energy Partners LP
Common Units |
S - Sale | -75.000 | 1.077.185 | -6,51 | 34,41 | -2.580.525 | 37.062.704 | |
| 2022-06-06 |
|
4 | VNOM |
Viper Energy Partners LP
Common Units |
S - Sale | -9.550 | 1.152.185 | -0,82 | 34,02 | -324.847 | 39.192.034 | |
| 2022-06-03 |
|
4 | VVNT |
Vivint Smart Home, Inc.
Class A Common Stock |
J - Other | -149.385 | 89.889.464 | -0,17 | ||||
| 2022-06-02 |
|
4 | VNOM |
Viper Energy Partners LP
Common Units |
S - Sale | -64.253 | 1.161.735 | -5,24 | 33,21 | -2.133.983 | 38.583.775 | |
| 2022-05-27 |
|
4 | CHK |
CHESAPEAKE ENERGY CORP
Common Stock |
S - Sale | -5.045 | 1.165.899 | -0,43 | 101,02 | -509.622 | 117.773.637 | |
| 2022-05-27 |
|
4 | CHK |
CHESAPEAKE ENERGY CORP
Common Stock |
S - Sale | -140.719 | 1.170.944 | -10,73 | 100,53 | -14.146.129 | 117.712.073 | |
| 2022-05-27 |
|
4 | CHK |
CHESAPEAKE ENERGY CORP
Common Stock |
S - Sale | -4.236 | 1.311.663 | -0,32 | 100,11 | -424.054 | 131.306.779 | |
| 2022-05-09 |
|
4 | CHK |
CHESAPEAKE ENERGY CORP
Common Stock |
S - Sale | -8.700 | 1.315.899 | -0,66 | 95,08 | -827.181 | 125.113.440 | |
| 2022-05-05 |
|
4 | KNTK |
Kinetik Holdings Inc.
Consideration Allocation Rights |
C - Conversion | -585 | 269.350 | -0,22 | ||||
| 2022-05-05 |
|
4 | KNTK |
Kinetik Holdings Inc.
Consideration Allocation Rights |
C - Conversion | -3.624 | 1.667.780 | -0,22 | ||||
| 2022-05-05 |
|
4 | KNTK |
Kinetik Holdings Inc.
Class A Common Stock |
C - Conversion | 585 | 585 | |||||
| 2022-05-05 |
|
4 | KNTK |
Kinetik Holdings Inc.
Class A Common Stock |
C - Conversion | 3.624 | 3.624 | |||||
| 2022-05-03 |
|
4 | SMFR |
Sema4 Holdings Corp.
Class A Common Stock |
P - Purchase | 14.735 | 162.309 | 9,98 | 4,00 | 58.940 | 649.236 | |
| 2022-05-03 |
|
4 | SMFR |
Sema4 Holdings Corp.
Class A Common Stock |
P - Purchase | 50.402 | 555.497 | 9,98 | 4,00 | 201.608 | 2.221.988 | |
| 2022-05-03 |
|
4 | SMFR |
Sema4 Holdings Corp.
Class A Common Stock |
P - Purchase | 2.434.863 | 26.839.187 | 9,98 | 4,00 | 9.739.452 | 107.356.748 | |
| 2022-04-22 |
|
4 | VNOM |
Viper Energy Partners LP
Common Units |
S - Sale | -5.643 | 12.525.988 | -0,05 | 32,13 | -181.321 | 402.486.299 | |
| 2022-04-22 |
|
4 | VNOM |
Viper Energy Partners LP
Common Units |
S - Sale | -33.000 | 12.531.631 | -0,26 | 31,96 | -1.054.700 | 400.518.446 | |
| 2022-04-20 |
|
4 | CHK |
CHESAPEAKE ENERGY CORP
Common Stock |
S - Sale | -4.223 | 4.156.830 | -0,10 | 97,29 | -410.840 | 404.402.195 | |
| 2022-04-20 |
|
4 | CHK |
CHESAPEAKE ENERGY CORP
Common Stock |
S - Sale | -41.787 | 4.161.053 | -0,99 | 96,37 | -4.027.122 | 401.011.496 | |
| 2022-04-20 |
|
4 | CHK |
CHESAPEAKE ENERGY CORP
Common Stock |
S - Sale | -14.306 | 4.202.840 | -0,34 | 95,60 | -1.367.671 | 401.796.547 | |
| 2022-04-20 |
|
4 | CHK |
CHESAPEAKE ENERGY CORP
Common Stock |
S - Sale | -8.805 | 8.667.769 | -0,10 | 97,29 | -856.605 | 843.254.308 | |
| 2022-04-20 |
|
4 | CHK |
CHESAPEAKE ENERGY CORP
Common Stock |
S - Sale | -87.132 | 8.676.574 | -0,99 | 96,37 | -8.397.137 | 836.183.995 | |
| 2022-04-20 |
|
4 | CHK |
CHESAPEAKE ENERGY CORP
Common Stock |
S - Sale | -29.832 | 8.763.706 | -0,34 | 95,60 | -2.851.975 | 837.820.810 | |
| 2022-04-20 |
|
4 | VNOM |
Viper Energy Partners LP
Common Units |
S - Sale | -20.000 | 12.564.631 | -0,16 | 31,37 | -627.498 | 394.214.041 | |
| 2022-04-20 |
|
4 | VNOM |
Viper Energy Partners LP
Common Units |
S - Sale | -38.000 | 12.584.631 | -0,30 | 31,84 | -1.210.110 | 400.757.574 | |
| 2022-04-19 |
|
4 | CPE |
Callon Petroleum Co
Common Stock |
S - Sale | -23.280 | 5.935.002 | -0,39 | 63,18 | -1.470.816 | 374.969.865 | |
| 2022-04-19 |
|
4 | CPE |
Callon Petroleum Co
Common Stock |
S - Sale | -87.629 | 5.958.282 | -1,45 | 62,36 | -5.464.439 | 371.551.316 | |
| 2022-04-19 |
|
4 | CPE |
Callon Petroleum Co
Common Stock |
S - Sale | -89.091 | 6.045.911 | -1,45 | 61,33 | -5.463.782 | 370.784.234 | |
| 2022-04-18 |
|
4 | VNOM |
Viper Energy Partners LP
Common Units |
S - Sale | -32.000 | 12.622.631 | -0,25 | 31,55 | -1.009.715 | 398.289.450 | |
| 2022-04-18 |
|
4 | CPE |
Callon Petroleum Co
Common Stock |
S - Sale | -40.712 | 6.135.002 | -0,66 | 62,25 | -2.534.196 | 381.884.856 | |
| 2022-04-18 |
|
4 | CPE |
Callon Petroleum Co
Common Stock |
S - Sale | -152.387 | 6.175.714 | -2,41 | 61,43 | -9.361.667 | 379.395.726 | |
| 2022-04-18 |
|
4 | CHK |
CHESAPEAKE ENERGY CORP
Common Stock |
S - Sale | -2.258 | 4.217.146 | -0,05 | 95,05 | -214.629 | 400.851.114 | |
| 2022-04-18 |
|
4 | CHK |
CHESAPEAKE ENERGY CORP
Common Stock |
S - Sale | -4.707 | 8.793.538 | -0,05 | 95,05 | -447.413 | 835.849.529 | |
| 2022-04-14 |
|
4 | VNOM |
Viper Energy Partners LP
Common Units |
S - Sale | -32.000 | 12.654.631 | -0,25 | 31,24 | -999.664 | 395.324.345 | |
| 2022-04-14 |
|
4 | VNOM |
Viper Energy Partners LP
Common Units |
S - Sale | -2.168 | 12.686.631 | -0,02 | 31,09 | -67.413 | 394.484.448 | |
| 2022-04-14 |
|
4 | CPE |
Callon Petroleum Co
Common Stock |
S - Sale | -4.477 | 6.328.101 | -0,07 | 62,19 | -278.411 | 393.524.984 | |
| 2022-04-14 |
|
4 | CPE |
Callon Petroleum Co
Common Stock |
S - Sale | -147.898 | 6.332.578 | -2,28 | 61,37 | -9.076.855 | 388.645.510 | |
| 2022-04-14 |
|
4 | CPE |
Callon Petroleum Co
Common Stock |
S - Sale | -11.601 | 6.480.476 | -0,18 | 63,07 | -731.675 | 408.723.621 | |
| 2022-04-14 |
|
4 | CPE |
Callon Petroleum Co
Common Stock |
S - Sale | -86.024 | 6.492.077 | -1,31 | 62,46 | -5.373.455 | 405.524.993 | |
| 2022-04-11 |
|
4 | CPE |
Callon Petroleum Co
Common Stock |
S - Sale | -144.913 | 6.578.101 | -2,16 | 62,25 | -9.021.254 | 409.505.864 | |
| 2022-04-11 |
|
4 | CPE |
Callon Petroleum Co
Common Stock |
S - Sale | -64.598 | 6.723.014 | -0,95 | 61,78 | -3.990.877 | 415.349.150 | |
| 2022-04-11 |
|
4 | CPE |
Callon Petroleum Co
Common Stock |
S - Sale | -5.853 | 6.787.612 | -0,09 | 62,11 | -363.511 | 421.556.182 | |
| 2022-04-11 |
|
4 | CPE |
Callon Petroleum Co
Common Stock |
S - Sale | -7.500 | 6.793.465 | -0,11 | 61,10 | -458.266 | 415.094.978 | |
| 2022-04-11 |
|
4 | VNOM |
Viper Energy Partners LP
Common Units |
S - Sale | -40.000 | 12.688.799 | -0,31 | 31,38 | -1.255.188 | 398.170.706 | |
| 2022-04-11 |
|
4 | VNOM |
Viper Energy Partners LP
Common Units |
S - Sale | -15.000 | 12.728.799 | -0,12 | 31,24 | -468.648 | 397.688.413 | |
| 2022-04-07 |
|
4 | VNOM |
Viper Energy Partners LP
Common Units |
S - Sale | -75.000 | 12.743.799 | -0,59 | 31,19 | -2.339.168 | 397.465.073 | |
| 2022-04-07 |
|
4 | VNOM |
Viper Energy Partners LP
Common Units |
S - Sale | -48.000 | 12.818.799 | -0,37 | 30,80 | -1.478.184 | 394.761.325 | |
| 2022-04-07 |
|
4 | CPE |
Callon Petroleum Co
Common Stock |
S - Sale | -300 | 6.800.965 | 0,00 | 62,00 | -18.601 | 421.682.273 | |
| 2022-04-07 |
|
4 | CPE |
Callon Petroleum Co
Common Stock |
S - Sale | -14.309 | 6.801.265 | -0,21 | 63,88 | -913.996 | 434.434.883 | |
| 2022-04-07 |
|
4 | CPE |
Callon Petroleum Co
Common Stock |
S - Sale | -4.120 | 6.815.574 | -0,06 | 62,54 | -257.682 | 426.274.623 | |
| 2022-04-05 |
|
4 | FOA |
Finance of America Companies Inc.
LLC Units of Finance of America Equity Capital LLC |
C - Conversion | -4.816 | 286.090 | -1,66 | ||||
| 2022-04-05 |
|
4 | FOA |
Finance of America Companies Inc.
LLC Units of Finance of America Equity Capital LLC |
C - Conversion | -839.115 | 49.836.805 | -1,66 | ||||
| 2022-04-05 |
|
4 | FOA |
Finance of America Companies Inc.
Class A Common Stock |
J - Other | -639.752 | 21.813.834 | -2,85 | ||||
| 2022-04-05 |
|
4 | FOA |
Finance of America Companies Inc.
Class A Common Stock |
J - Other | -8.390 | 0 | -100,00 | ||||
| 2022-04-05 |
|
4 | FOA |
Finance of America Companies Inc.
Class A Common Stock |
C - Conversion | 4.816 | 8.390 | 134,75 | ||||
| 2022-04-05 |
|
4 | FOA |
Finance of America Companies Inc.
Class A Common Stock |
J - Other | -1.461.604 | 0 | -100,00 | ||||
| 2022-04-05 |
|
4 | FOA |
Finance of America Companies Inc.
Class A Common Stock |
C - Conversion | 839.115 | 1.461.604 | 134,80 | ||||
| 2022-04-05 |
|
4 | VNOM |
Viper Energy Partners LP
Common Units |
S - Sale | -6.200 | 12.866.799 | -0,05 | 30,06 | -186.376 | 386.784.985 | |
| 2022-04-05 |
|
4 | CPE |
Callon Petroleum Co
Common Stock |
J - Other | -1.862.327 | 0 | -100,00 | ||||
| 2022-04-05 |
|
4 | CPE |
Callon Petroleum Co
Common Stock |
J - Other | -5.433.817 | 0 | -100,00 | ||||
| 2022-04-05 |
|
4 | CPE |
Callon Petroleum Co
Common Stock |
S - Sale | -6.735 | 1.862.327 | -0,36 | 61,38 | -413.427 | 114.318.570 | |
| 2022-04-05 |
|
4 | CPE |
Callon Petroleum Co
Common Stock |
S - Sale | -18.465 | 5.433.817 | -0,34 | 61,38 | -1.133.470 | 333.553.770 | |
| 2022-04-01 |
|
4 | GTES |
Gates Industrial Corp plc
Ordinary Shares |
S - Sale | -1.289.867 | 16.527.684 | -7,24 | 15,14 | -19.528.586 | 250.229.136 | |
| 2022-04-01 |
|
4 | GTES |
Gates Industrial Corp plc
Ordinary Shares |
S - Sale | -20.938 | 268.295 | -7,24 | 15,14 | -317.001 | 4.061.986 | |
| 2022-04-01 |
|
4 | GTES |
Gates Industrial Corp plc
Ordinary Shares |
S - Sale | -6.115.142 | 78.356.260 | -7,24 | 15,14 | -92.583.250 | 1.186.313.776 | |
| 2022-04-01 |
|
4 | GTES |
Gates Industrial Corp plc
Ordinary Shares |
S - Sale | -6.324.053 | 81.033.144 | -7,24 | 15,14 | -95.746.162 | 1.226.841.800 | |
| 2022-04-01 |
|
4 | IMGO |
Imago BioSciences, Inc.
Common Stock |
J - Other | -1.000.000 | 2.375.037 | -29,63 | ||||
| 2022-03-29 |
|
4 | APR |
Apria, Inc.
Common Stock |
S - Sale | -14.187.515 | 0 | -100,00 | 37,50 | -532.031.812 | ||
| 2022-03-29 |
|
4 | VNOM |
Viper Energy Partners LP
Common Units |
S - Sale | -45.000 | 12.872.999 | -0,35 | 31,31 | -1.408.774 | 403.003.394 | |
| 2022-03-29 |
|
4 | CPE |
Callon Petroleum Co
Common Stock |
S - Sale | -18.882 | 1.869.062 | -1,00 | 62,20 | -1.174.498 | 116.259.395 | |
| 2022-03-29 |
|
4 | CPE |
Callon Petroleum Co
Common Stock |
S - Sale | -15.860 | 1.887.944 | -0,83 | 61,51 | -975.542 | 116.126.680 | |
| 2022-03-29 |
|
4 | CPE |
Callon Petroleum Co
Common Stock |
S - Sale | -51.771 | 5.452.282 | -0,94 | 62,20 | -3.220.260 | 339.142.845 | |
| 2022-03-29 |
|
4 | CPE |
Callon Petroleum Co
Common Stock |
S - Sale | -43.487 | 5.504.053 | -0,78 | 61,51 | -2.674.868 | 338.552.098 | |
| 2022-03-23 |
|
4 | VNOM |
Viper Energy Partners LP
Common Units |
S - Sale | -16.496 | 12.917.999 | -0,13 | 30,07 | -496.088 | 388.485.568 | |
| 2022-03-21 |
|
4 | VNOM |
Viper Energy Partners LP
Common Units |
S - Sale | -20.000 | 12.934.495 | -0,15 | 29,67 | -593.402 | 383.767.760 | |
| 2022-03-14 |
|
4 | CPE |
Callon Petroleum Co
Common Stock |
S - Sale | -2.573 | 1.903.804 | -0,13 | 60,21 | -154.925 | 114.631.656 | |
| 2022-03-14 |
|
4 | CPE |
Callon Petroleum Co
Common Stock |
S - Sale | -7.056 | 5.547.540 | -0,13 | 60,21 | -424.855 | 334.027.924 | |
| 2022-03-14 |
|
4 | CPE |
Callon Petroleum Co
Common Stock |
S - Sale | -12.026 | 1.906.377 | -0,63 | 60,32 | -725.373 | 114.987.132 | |
| 2022-03-14 |
|
4 | CPE |
Callon Petroleum Co
Common Stock |
S - Sale | -32.974 | 5.554.596 | -0,59 | 60,32 | -1.988.896 | 335.037.122 | |
| 2022-03-10 |
|
4 | CPE |
Callon Petroleum Co
Common Stock |
S - Sale | -3.335 | 1.918.403 | -0,17 | 60,15 | -200.608 | 115.396.545 | |
| 2022-03-10 |
|
4 | CPE |
Callon Petroleum Co
Common Stock |
S - Sale | -9.144 | 5.587.570 | -0,16 | 60,15 | -550.034 | 336.105.746 | |
| 2022-03-10 |
|
4 | CPE |
Callon Petroleum Co
Common Stock |
S - Sale | -27 | 1.921.738 | 0,00 | 66,01 | -1.782 | 126.853.925 | |
| 2022-03-10 |
|
4 | CPE |
Callon Petroleum Co
Common Stock |
S - Sale | -48.003 | 1.921.765 | -2,44 | 65,32 | -3.135.786 | 125.538.914 | |
| 2022-03-10 |
|
4 | CPE |
Callon Petroleum Co
Common Stock |
S - Sale | -55.043 | 1.969.768 | -2,72 | 64,61 | -3.556.191 | 127.261.786 | |
| 2022-03-10 |
|
4 | CPE |
Callon Petroleum Co
Common Stock |
S - Sale | -14.515 | 2.024.811 | -0,71 | 63,47 | -921.283 | 128.516.981 | |
| 2022-03-10 |
|
4 | CPE |
Callon Petroleum Co
Common Stock |
S - Sale | -4.627 | 2.039.326 | -0,23 | 62,48 | -289.079 | 127.409.951 | |
| 2022-03-10 |
|
4 | CPE |
Callon Petroleum Co
Common Stock |
S - Sale | -9.926 | 2.043.953 | -0,48 | 61,32 | -608.626 | 125.327.635 | |
| 2022-03-10 |
|
4 | CPE |
Callon Petroleum Co
Common Stock |
S - Sale | -5.493 | 2.053.879 | -0,27 | 60,51 | -332.394 | 124.284.737 | |
| 2022-03-10 |
|
4 | CPE |
Callon Petroleum Co
Common Stock |
S - Sale | -73 | 5.596.714 | 0,00 | 66,01 | -4.819 | 369.439.091 | |
| 2022-03-10 |
|
4 | CPE |
Callon Petroleum Co
Common Stock |
S - Sale | -131.613 | 5.596.787 | -2,30 | 65,32 | -8.597.593 | 365.608.991 | |
| 2022-03-10 |
|
4 | CPE |
Callon Petroleum Co
Common Stock |
S - Sale | -150.919 | 5.728.400 | -2,57 | 64,61 | -9.750.499 | 370.097.603 | |
| 2022-03-10 |
|
4 | CPE |
Callon Petroleum Co
Common Stock |
S - Sale | -39.796 | 5.879.319 | -0,67 | 63,47 | -2.525.896 | 373.166.844 | |
| 2022-03-10 |
|
4 | CPE |
Callon Petroleum Co
Common Stock |
S - Sale | -12.687 | 5.919.115 | -0,21 | 62,48 | -792.639 | 369.805.588 | |
| 2022-03-10 |
|
4 | CPE |
Callon Petroleum Co
Common Stock |
S - Sale | -27.216 | 5.931.802 | -0,46 | 61,32 | -1.668.784 | 363.716.151 | |
| 2022-03-10 |
|
4 | CPE |
Callon Petroleum Co
Common Stock |
S - Sale | -15.062 | 5.959.018 | -0,25 | 60,51 | -911.435 | 360.593.289 | |
| 2022-03-10 |
|
4 | VNOM |
Viper Energy Partners LP
Common Units |
S - Sale | -13.139 | 12.954.495 | -0,10 | 30,07 | -395.048 | 389.500.210 | |
| 2022-03-08 |
|
4 | FOA |
Finance of America Companies Inc.
Class A Common Stock |
J - Other | -2.983 | 22.453.586 | -0,01 | ||||
| 2022-03-08 |
|
4 | FOA |
Finance of America Companies Inc.
Class A Common Stock |
J - Other | -39 | 3.574 | -1,08 | ||||
| 2022-03-08 |
|
4 | FOA |
Finance of America Companies Inc.
Class A Common Stock |
J - Other | -6.814 | 622.489 | -1,08 | ||||
| 2022-03-08 |
|
4 | CPE |
Callon Petroleum Co
Common Stock |
S - Sale | -53.158 | 2.059.372 | -2,52 | 61,38 | -3.262.780 | 126.401.988 | |
| 2022-03-08 |
|
4 | CPE |
Callon Petroleum Co
Common Stock |
S - Sale | -73.786 | 2.112.530 | -3,37 | 60,37 | -4.454.298 | 127.528.789 | |
| 2022-03-08 |
|
4 | CPE |
Callon Petroleum Co
Common Stock |
S - Sale | -145.749 | 5.974.080 | -2,38 | 61,38 | -8.945.913 | 366.682.459 | |
| 2022-03-08 |
|
4 | CPE |
Callon Petroleum Co
Common Stock |
S - Sale | -202.307 | 6.119.829 | -3,20 | 60,37 | -12.212.829 | 369.440.613 | |
| 2022-03-08 |
|
4 | CPE |
Callon Petroleum Co
Common Stock |
S - Sale | -1.396 | 2.186.316 | -0,06 | 60,02 | -83.788 | 131.222.030 | |
| 2022-03-08 |
|
4 | CPE |
Callon Petroleum Co
Common Stock |
S - Sale | -3.829 | 6.322.136 | -0,06 | 60,02 | -229.815 | 379.452.706 | |
| 2022-03-08 |
|
4 | VNOM |
Viper Energy Partners LP
Common Units |
S - Sale | -1.230 | 12.967.624 | -0,01 | 30,69 | -37.746 | 397.947.852 | |
| 2022-03-08 |
|
4 | VNOM |
Viper Energy Partners LP
Common Units |
S - Sale | -21.363 | 12.968.864 | -0,16 | 30,09 | -642.802 | 390.226.633 | |
| 2022-03-08 |
|
4 | VNOM |
Viper Energy Partners LP
Common Units |
S - Sale | -125.336 | 12.990.227 | -0,96 | 29,92 | -3.750.166 | 388.679.283 | |
| 2022-03-07 |
|
4 | CPLG |
CorePoint Lodging Inc.
Common Stock |
S - Sale | -444.298 | 0 | -100,00 | 15,99 | -7.104.325 | ||
| 2022-03-07 |
|
4 | CPLG |
CorePoint Lodging Inc.
Common Stock |
S - Sale | -88.291 | 0 | -100,00 | 15,99 | -1.411.773 | ||
| 2022-03-07 |
|
4 | CPLG |
CorePoint Lodging Inc.
Common Stock |
S - Sale | -2.817.965 | 0 | -100,00 | 15,99 | -45.059.260 | ||
| 2022-03-07 |
|
4 | CPLG |
CorePoint Lodging Inc.
Common Stock |
S - Sale | -1.096.835 | 0 | -100,00 | 15,99 | -17.538.392 | ||
| 2022-03-07 |
|
4 | CPLG |
CorePoint Lodging Inc.
Common Stock |
S - Sale | -770.527 | 0 | -100,00 | 15,99 | -12.320.727 | ||
| 2022-03-07 |
|
4 | CPLG |
CorePoint Lodging Inc.
Common Stock |
S - Sale | -3.045.672 | 0 | -100,00 | 15,99 | -48.700.295 | ||
| 2022-03-07 |
|
4 | CPLG |
CorePoint Lodging Inc.
Common Stock |
S - Sale | -89.162 | 0 | -100,00 | 15,99 | -1.425.700 | ||
| 2022-03-07 |
|
4 | CPLG |
CorePoint Lodging Inc.
Common Stock |
S - Sale | -304.078 | 0 | -100,00 | 15,99 | -4.862.207 | ||
| 2022-03-07 |
|
4 | CPLG |
CorePoint Lodging Inc.
Common Stock |
S - Sale | -262.018 | 0 | -100,00 | 15,99 | -4.189.668 | ||
| 2022-03-07 |
|
4 | CPLG |
CorePoint Lodging Inc.
Common Stock |
S - Sale | -190.751 | 0 | -100,00 | 15,99 | -3.050.108 | ||
| 2022-03-07 |
|
4 | CPLG |
CorePoint Lodging Inc.
Common Stock |
S - Sale | -71.631 | 0 | -100,00 | 15,99 | -1.145.380 | ||
| 2022-03-07 |
|
4 | CPLG |
CorePoint Lodging Inc.
Common Stock |
S - Sale | -177.047 | 0 | -100,00 | 15,99 | -2.830.982 | ||
| 2022-03-07 |
|
4 | CPLG |
CorePoint Lodging Inc.
Common Stock |
S - Sale | -526.436 | 0 | -100,00 | 15,99 | -8.417.712 | ||
| 2022-03-07 |
|
4 | CPLG |
CorePoint Lodging Inc.
Common Stock |
S - Sale | -932.172 | 0 | -100,00 | 15,99 | -14.905.430 | ||
| 2022-03-07 |
|
4 | CPLG |
CorePoint Lodging Inc.
Common Stock |
S - Sale | -6.769.655 | 0 | -100,00 | 15,99 | -108.246.783 | ||
| 2022-03-04 |
|
4 | VNOM |
Viper Energy Partners LP
Common Units |
S - Sale | -8.664 | 13.115.563 | -0,07 | 29,55 | -256.011 | 387.549.148 | |
| 2022-03-04 |
|
4 | VNOM |
Viper Energy Partners LP
Common Units |
S - Sale | -80.000 | 13.124.227 | -0,61 | 29,89 | -2.391.480 | 392.329.080 | |
| 2022-03-03 |
|
4 | CPE |
Callon Petroleum Co
Common Stock |
S - Sale | -21.743 | 2.187.712 | -0,98 | 60,40 | -1.313.323 | 132.142.399 | |
| 2022-03-03 |
|
4 | CPE |
Callon Petroleum Co
Common Stock |
S - Sale | -59.614 | 6.325.965 | -0,93 | 60,40 | -3.600.811 | 382.101.571 | |
| 2022-03-03 |
|
4 | CPE |
Callon Petroleum Co
Common Stock |
S - Sale | -8.385 | 2.209.455 | -0,38 | 61,42 | -515.040 | 135.713.564 | |
| 2022-03-03 |
|
4 | CPE |
Callon Petroleum Co
Common Stock |
S - Sale | -5.753 | 2.217.840 | -0,26 | 60,96 | -350.682 | 135.191.320 | |
| 2022-03-03 |
|
4 | CPE |
Callon Petroleum Co
Common Stock |
S - Sale | -22.989 | 6.385.579 | -0,36 | 61,42 | -1.412.076 | 392.227.804 | |
| 2022-03-03 |
|
4 | CPE |
Callon Petroleum Co
Common Stock |
S - Sale | -15.773 | 6.408.568 | -0,25 | 60,96 | -961.464 | 390.642.594 | |
| 2022-03-02 |
|
4 | VNOM |
Viper Energy Partners LP
Common Units |
S - Sale | -65.000 | 13.204.227 | -0,49 | 29,70 | -1.930.312 | 392.127.250 | |
| 2022-03-02 |
|
4 | VNOM |
Viper Energy Partners LP
Common Units |
S - Sale | -19.202 | 13.269.227 | -0,14 | 29,57 | -567.788 | 392.360.427 | |
| 2022-03-02 |
|
4 | VNOM |
Viper Energy Partners LP
Common Units |
S - Sale | -190.798 | 13.288.429 | -1,42 | 29,36 | -5.602.268 | 390.178.839 | |
| 2022-02-28 |
|
4 | VNOM |
Viper Energy Partners LP
Common Units |
S - Sale | -600 | 13.479.227 | 0,00 | 28,04 | -16.823 | 377.934.610 | |
| 2022-02-28 |
|
4 | VNOM |
Viper Energy Partners LP
Common Units |
S - Sale | -104.400 | 13.479.827 | -0,77 | 28,52 | -2.977.217 | 384.409.618 | |
| 2022-02-28 |
|
4 | VNOM |
Viper Energy Partners LP
Common Units |
S - Sale | -123.000 | 13.584.227 | -0,90 | 28,38 | -3.490.654 | 385.510.853 | |
| 2022-02-25 |
|
4 | VVNT |
Vivint Smart Home, Inc.
Class A Common Stock |
J - Other | -14.497.780 | 90.038.849 | -13,87 | ||||
| 2022-02-18 |
|
4 | CTOS |
Custom Truck One Source, Inc.
Common Stock |
S - Sale | -2.264 | 0 | -100,00 | 8,07 | -18.270 | ||
| 2022-02-18 |
|
4 | CTOS |
Custom Truck One Source, Inc.
Common Stock |
S - Sale | -466.472 | 0 | -100,00 | 8,07 | -3.764.429 | ||
| 2022-02-18 |
|
4 | CTOS |
Custom Truck One Source, Inc.
Common Stock |
S - Sale | -455.487 | 0 | -100,00 | 8,07 | -3.675.780 | ||
| 2022-02-18 |
|
4 | CTOS |
Custom Truck One Source, Inc.
Common Stock |
S - Sale | -23.457 | 0 | -100,00 | 8,07 | -189.298 | ||
| 2022-02-18 |
|
4 | CTOS |
Custom Truck One Source, Inc.
Common Stock |
S - Sale | -45.860 | 0 | -100,00 | 8,07 | -370.090 | ||
| 2022-02-18 |
|
4 | CTOS |
Custom Truck One Source, Inc.
Common Stock |
S - Sale | -472.446 | 0 | -100,00 | 8,07 | -3.812.639 | ||
| 2022-02-18 |
|
4 | CTOS |
Custom Truck One Source, Inc.
Common Stock |
S - Sale | -382.460 | 0 | -100,00 | 8,07 | -3.086.452 | ||
| 2022-02-10 |
|
4 | ALTM |
Altus Midstream Co
Class A Common Stock |
J - Other | 0 | 0 | |||||
| 2022-01-21 | 3 | ALTM |
Altus Midstream Co
Class A Common Stock |
0 | ||||||||
| 2022-01-11 |
|
4 | VNOM |
Viper Energy Partners LP
Common Units |
S - Sale | -1.500.000 | 13.707.227 | -9,86 | 24,88 | -37.320.000 | 341.035.808 | |
| 2021-12-17 | 3 | AMPS |
Altus Power, Inc.
Class A Common Stock |
28.825.125 | ||||||||
| 2021-12-14 |
|
4 | APR |
Apria, Inc.
Common Stock |
S - Sale | -349.527 | 14.187.515 | -2,40 | 29,92 | -10.459.595 | 424.561.386 | |
| 2021-12-08 |
|
4 | N/A |
Blackstone Real Estate Income Fund
Common Shares of Beneficial Interest |
J - Other | -412 | 0 | -100,00 | 926,58 | -381.711 | ||
| 2021-12-08 |
|
4 | N/A |
Blackstone Real Estate Income Fund
Common Shares of Beneficial Interest |
J - Other | -6.167 | 412 | -93,74 | 910,05 | -5.612.593 | 374.901 | |
| 2021-12-08 |
|
4 | N/A |
Blackstone Real Estate Income Fund II
Advisor Class I Common Shares of Beneficial Interest |
J - Other | -1 | 0 | -100,00 | 898,36 | -651 | ||
| 2021-12-08 |
|
4 | N/A |
Blackstone Real Estate Income Fund II
Institutional Class II Common Shares of Beneficial Interest |
J - Other | -264 | 0 | -100,00 | 908,60 | -239.999 | ||
| 2021-12-08 |
|
4 | N/A |
Blackstone Real Estate Income Fund II
Advisor Class I Common Shares of Beneficial Interest |
J - Other | -26 | 1 | -97,27 | 877,07 | -22.621 | 636 | |
| 2021-12-08 |
|
4 | N/A |
Blackstone Real Estate Income Fund II
Institutional Class II Common Shares of Beneficial Interest |
J - Other | -6.524 | 264 | -96,11 | 887,60 | -5.790.692 | 234.452 | |
| 2021-11-22 |
|
4 | CTOS |
Custom Truck One Source, Inc.
Common Stock |
S - Sale | -15.096 | 2.264 | -86,96 | 8,20 | -123.825 | 18.570 | |
| 2021-11-22 |
|
4 | CTOS |
Custom Truck One Source, Inc.
Common Stock |
S - Sale | -3.109.809 | 466.472 | -86,96 | 8,20 | -25.508.208 | 3.826.237 | |
| 2021-11-22 |
|
4 | CTOS |
Custom Truck One Source, Inc.
Common Stock |
S - Sale | -3.036.582 | 455.487 | -86,96 | 8,20 | -24.907.564 | 3.736.132 | |
| 2021-11-22 |
|
4 | CTOS |
Custom Truck One Source, Inc.
Common Stock |
S - Sale | -156.378 | 23.457 | -86,96 | 8,20 | -1.282.691 | 192.406 | |
| 2021-11-22 |
|
4 | CTOS |
Custom Truck One Source, Inc.
Common Stock |
S - Sale | -305.733 | 45.860 | -86,96 | 8,20 | -2.507.775 | 376.167 | |
| 2021-11-22 |
|
4 | CTOS |
Custom Truck One Source, Inc.
Common Stock |
S - Sale | -3.149.642 | 472.446 | -86,96 | 8,20 | -25.834.939 | 3.875.238 | |
| 2021-11-22 |
|
4 | CTOS |
Custom Truck One Source, Inc.
Common Stock |
S - Sale | -2.549.735 | 382.460 | -86,96 | 8,20 | -20.914.201 | 3.137.128 | |
| 2021-11-18 |
|
4 | CYRX |
Cryoport, Inc.
Common Stock |
S - Sale | -11.400 | 10.339 | -52,44 | 76,00 | -866.400 | 785.764 | |
| 2021-11-18 |
|
4 | CYRX |
Cryoport, Inc.
Common Stock |
S - Sale | -488.600 | 443.057 | -52,44 | 76,00 | -37.133.600 | 33.672.332 | |
| 2021-11-17 |
|
4 | APR |
Apria, Inc.
Common Stock |
S - Sale | -4.500.000 | 14.537.042 | -23,64 | 29,92 | -134.662.500 | 435.020.982 | |
| 2021-11-03 |
|
4 | VEI |
VINE ENERGY INC.
Common Units of Vine Energy Holdings LLC |
C - Conversion | -242.663 | 0 | -100,00 | ||||
| 2021-11-03 |
|
4 | VEI |
VINE ENERGY INC.
Common Units of Vine Energy Holdings LLC |
C - Conversion | -16.588.860 | 0 | -100,00 | ||||
| 2021-11-03 |
|
4 | VEI |
VINE ENERGY INC.
Common Units of Vine Energy Holdings LLC |
C - Conversion | -17.387.012 | 0 | -100,00 | ||||
| 2021-11-03 |
|
4 | VEI |
VINE ENERGY INC.
Class B Common Stock |
J - Other | -242.663 | 0 | -100,00 | ||||
| 2021-11-03 |
|
4 | VEI |
VINE ENERGY INC.
Class B Common Stock |
J - Other | -16.588.860 | 0 | -100,00 | ||||
| 2021-11-03 |
|
4 | VEI |
VINE ENERGY INC.
Class B Common Stock |
J - Other | -17.387.012 | 0 | -100,00 | ||||
| 2021-11-03 |
|
4 | VEI |
VINE ENERGY INC.
Class A Common Stock |
J - Other | -104.547 | 0 | -100,00 | ||||
| 2021-11-03 |
|
4 | VEI |
VINE ENERGY INC.
Class A Common Stock |
J - Other | -265.488 | 0 | -100,00 | ||||
| 2021-11-03 |
|
4 | VEI |
VINE ENERGY INC.
Class A Common Stock |
J - Other | -7.129.295 | 0 | -100,00 | ||||
| 2021-11-03 |
|
4 | VEI |
VINE ENERGY INC.
Class A Common Stock |
J - Other | -18.068.757 | 0 | -100,00 | ||||
| 2021-11-03 |
|
4 | VEI |
VINE ENERGY INC.
Class A Common Stock |
J - Other | -10.312.823 | 0 | -100,00 | ||||
| 2021-11-03 |
|
4 | VEI |
VINE ENERGY INC.
Class A Common Stock |
J - Other | -18.938.346 | 0 | -100,00 | ||||
| 2021-11-03 |
|
4 | VEI |
VINE ENERGY INC.
Class A Common Stock |
C - Conversion | 242.663 | 265.488 | 1.063,15 | ||||
| 2021-11-03 |
|
4 | VEI |
VINE ENERGY INC.
Class A Common Stock |
C - Conversion | 16.588.860 | 18.068.757 | 1.120,95 | ||||
| 2021-11-03 |
|
4 | VEI |
VINE ENERGY INC.
Class A Common Stock |
C - Conversion | 17.387.012 | 18.938.346 | 1.120,78 | ||||
| 2021-11-03 | 3 | CHK |
CHESAPEAKE ENERGY CORP
Common Stock |
4.642.228 | ||||||||
| 2021-11-03 | 3 | CHK |
CHESAPEAKE ENERGY CORP
Common Stock |
2.563.751 | ||||||||
| 2021-11-03 | 3 | CHK |
CHESAPEAKE ENERGY CORP
Common Stock |
4.069.275 | ||||||||
| 2021-11-03 | 3 | CHK |
CHESAPEAKE ENERGY CORP
Common Stock |
1.656.957 | ||||||||
| 2021-11-03 | 3 | CHK |
CHESAPEAKE ENERGY CORP
Common Stock |
59.931 | ||||||||
| 2021-11-03 | 3 | CHK |
CHESAPEAKE ENERGY CORP
Common Stock |
25.511 | ||||||||
| 2021-10-27 |
|
4 | TASK |
TaskUs, Inc.
Class B Common Stock |
C - Conversion | -8.127.882 | 47.130.480 | -14,71 | ||||
| 2021-10-27 |
|
4 | TASK |
TaskUs, Inc.
Class A Common Stock |
S - Sale | -8.127.882 | 0 | -100,00 | 61,44 | -499.346.997 | ||
| 2021-10-27 |
|
4 | TASK |
TaskUs, Inc.
Class A Common Stock |
C - Conversion | 8.127.882 | 8.127.882 | |||||
| 2021-10-25 |
|
4 | OPFI |
OppFi Inc.
Warrant (right to buy) |
S - Sale | -494.281 | 0 | -100,00 | 1,18 | -581.818 | ||
| 2021-10-25 |
|
4 | OPFI |
OppFi Inc.
Warrant (right to buy) |
S - Sale | -61.223 | 494.281 | -11,02 | 1,38 | -84.665 | 683.541 | |
| 2021-10-25 |
|
4 | OPFI |
OppFi Inc.
Warrant (right to buy) |
S - Sale | -4.496 | 555.504 | -0,80 | 1,51 | -6.789 | 838.811 | |
| 2021-10-25 |
|
4 | OPFI |
OppFi Inc.
Class A Common Stock |
S - Sale | 7.600 | 1.074.134 | 0,71 | 7,00 | 53.205 | 7.519.690 | |
| 2021-10-25 |
|
4 | OPFI |
OppFi Inc.
Class A Common Stock |
S - Sale | 31.366 | 1.081.734 | 2,99 | 7,04 | 220.820 | 7.615.516 | |
| 2021-10-25 |
|
4 | OPFI |
OppFi Inc.
Class A Common Stock |
S - Sale | 6.900 | 1.113.100 | 0,62 | 7,14 | 49.258 | 7.946.310 | |
| 2021-10-21 |
|
4 | VNOM |
Viper Energy Partners LP
Common Units |
J - Other | -12.815.808 | 0 | -100,00 | ||||
| 2021-10-21 |
|
4 | VNOM |
Viper Energy Partners LP
Common Units |
J - Other | -2.434.192 | 0 | -100,00 | ||||
| 2021-10-12 | 3 | CPE |
Callon Petroleum Co
Common Stock |
6.424.341 | ||||||||
| 2021-10-12 | 3 | CPE |
Callon Petroleum Co
Common Stock |
2.417.198 | ||||||||
| 2021-10-12 | 3 | VNOM |
Viper Energy Partners LP
Common Units |
2.434.192 | ||||||||
| 2021-10-12 | 3 | VNOM |
Viper Energy Partners LP
Common Units |
12.815.808 | ||||||||
| 2021-10-08 |
|
4 | PRAX |
Praxis Precision Medicines, Inc.
Common Stock |
S - Sale | -400.000 | 0 | -100,00 | 17,50 | -7.000.000 | ||
| 2021-10-05 |
|
4 | PRAX |
Praxis Precision Medicines, Inc.
Common Stock |
S - Sale | -23.946 | 400.000 | -5,65 | 19,15 | -458.566 | 7.660.000 | |
| 2021-10-05 |
|
4 | PRAX |
Praxis Precision Medicines, Inc.
Common Stock |
S - Sale | -22.600 | 423.946 | -5,06 | 19,13 | -432.338 | 8.110.087 | |
| 2021-10-04 |
|
4 | CQP |
Cheniere Energy Partners, L.P.
Common Units |
J - Other | 2.455 | 67.939 | 3,75 | ||||
| 2021-10-04 |
|
4 | CQP |
Cheniere Energy Partners, L.P.
Common Units |
J - Other | 7.018 | 194.216 | 3,75 | ||||
| 2021-10-04 |
|
4 | CQP |
Cheniere Energy Partners, L.P.
Common Units |
J - Other | -9.473 | 0 | -100,00 | ||||
| 2021-10-04 |
|
4 | CQP |
Cheniere Energy Partners, L.P.
Common Units |
P - Purchase | 9.473 | 9.473 | 40,96 | 387.986 | 387.986 | ||
| 2021-10-04 |
|
4 | CQP |
Cheniere Energy Partners, L.P.
Common Units |
J - Other | 9.082 | 65.484 | 16,10 | ||||
| 2021-10-04 |
|
4 | CQP |
Cheniere Energy Partners, L.P.
Common Units |
J - Other | 25.962 | 187.198 | 16,10 | ||||
| 2021-10-04 |
|
4 | CQP |
Cheniere Energy Partners, L.P.
Common Units |
J - Other | -35.044 | 0 | -100,00 | ||||
| 2021-10-04 |
|
4 | CQP |
Cheniere Energy Partners, L.P.
Common Units |
P - Purchase | 35.044 | 35.044 | 40,93 | 1.434.351 | 1.434.351 | ||
| 2021-10-04 |
|
4 | CQP |
Cheniere Energy Partners, L.P.
Common Units |
J - Other | 1 | 56.402 | 0,00 | ||||
| 2021-10-04 |
|
4 | CQP |
Cheniere Energy Partners, L.P.
Common Units |
J - Other | 1 | 56.402 | 0,00 | ||||
| 2021-10-04 |
|
4 | CQP |
Cheniere Energy Partners, L.P.
Common Units |
J - Other | -2 | 0 | -100,00 | ||||
| 2021-10-04 |
|
4 | CQP |
Cheniere Energy Partners, L.P.
Common Units |
L - Other | 2 | 2 | 40,90 | 82 | 82 | ||
| 2021-10-01 |
|
4 | FOA |
Finance of America Companies Inc.
Class A Common Stock |
J - Other | -609.926 | 22.456.569 | -2,64 | ||||
| 2021-10-01 |
|
4 | FOA |
Finance of America Companies Inc.
Class A Common Stock |
J - Other | -7.999 | 3.613 | -68,89 | ||||
| 2021-10-01 |
|
4 | FOA |
Finance of America Companies Inc.
Class A Common Stock |
J - Other | -1.393.463 | 629.303 | -68,89 | ||||
| 2021-09-28 |
|
4 | CQP |
Cheniere Energy Partners, L.P.
Common Units |
J - Other | 26 | 56.401 | 0,05 | ||||
| 2021-09-28 |
|
4 | CQP |
Cheniere Energy Partners, L.P.
Common Units |
J - Other | 74 | 161.235 | 0,05 | ||||
| 2021-09-28 |
|
4 | CQP |
Cheniere Energy Partners, L.P.
Common Units |
J - Other | -100 | 0 | -100,00 | ||||
| 2021-09-28 |
|
4 | CQP |
Cheniere Energy Partners, L.P.
Common Units |
P - Purchase | 100 | 100 | 40,90 | 4.090 | 4.090 | ||
| 2021-09-28 |
|
4 | CQP |
Cheniere Energy Partners, L.P.
Common Units |
J - Other | 29 | 56.375 | 0,05 | ||||
| 2021-09-28 |
|
4 | CQP |
Cheniere Energy Partners, L.P.
Common Units |
J - Other | 84 | 161.161 | 0,05 | ||||
| 2021-09-28 |
|
4 | CQP |
Cheniere Energy Partners, L.P.
Common Units |
J - Other | -113 | 0 | -100,00 | ||||
| 2021-09-28 |
|
4 | CQP |
Cheniere Energy Partners, L.P.
Common Units |
P - Purchase | 113 | 113 | 40,00 | 4.520 | 4.520 | ||
| 2021-09-24 |
|
4 | CQP |
Cheniere Energy Partners, L.P.
Common Units |
J - Other | 7.785 | 56.329 | 16,04 | ||||
| 2021-09-24 |
|
4 | CQP |
Cheniere Energy Partners, L.P.
Common Units |
J - Other | 22.255 | 161.027 | 16,04 | ||||
| 2021-09-24 |
|
4 | CQP |
Cheniere Energy Partners, L.P.
Common Units |
J - Other | -30.400 | 0 | -100,00 | ||||
| 2021-09-24 |
|
4 | CQP |
Cheniere Energy Partners, L.P.
Common Units |
P - Purchase | 30.400 | 30.400 | 39,60 | 1.203.937 | 1.203.937 | ||
| 2021-09-15 |
|
4 | BMBL |
Bumble Inc.
Common Units of Buzz Holdings L.P. |
C - Conversion | -17.879 | 66.969 | -21,07 | ||||
| 2021-09-15 |
|
4 | BMBL |
Bumble Inc.
Common Units of Buzz Holdings L.P. |
C - Conversion | -81.871 | 306.667 | -21,07 | ||||
| 2021-09-15 |
|
4 | BMBL |
Bumble Inc.
Common Units of Buzz Holdings L.P. |
C - Conversion | -9.072.260 | 33.982.606 | -21,07 | ||||
| 2021-09-15 |
|
4 | BMBL |
Bumble Inc.
Class A Common Stock |
S - Sale | -17.879 | 0 | -100,00 | 52,38 | -936.502 | ||
| 2021-09-15 |
|
4 | BMBL |
Bumble Inc.
Class A Common Stock |
C - Conversion | 17.879 | 17.879 | |||||
| 2021-09-15 |
|
4 | BMBL |
Bumble Inc.
Class A Common Stock |
S - Sale | -81.871 | 0 | -100,00 | 52,38 | -4.288.403 | ||
| 2021-09-15 |
|
4 | BMBL |
Bumble Inc.
Class A Common Stock |
C - Conversion | 81.871 | 81.871 | |||||
| 2021-09-15 |
|
4 | BMBL |
Bumble Inc.
Class A Common Stock |
S - Sale | -9.077.161 | 18.357 | -99,80 | 52,38 | -475.461.693 | 961.540 | |
| 2021-09-15 |
|
4 | BMBL |
Bumble Inc.
Class A Common Stock |
C - Conversion | 9.072.260 | 9.095.518 | 39.007,05 | ||||
| 2021-09-15 |
|
4 | BMBL |
Bumble Inc.
Class A Common Stock |
S - Sale | -2.992.267 | 11.208.342 | -21,07 | 52,38 | -156.734.945 | 587.092.954 | |
| 2021-09-15 |
|
4 | BMBL |
Bumble Inc.
Class A Common Stock |
S - Sale | -1.121.365 | 4.200.373 | -21,07 | 52,38 | -58.737.099 | 220.015.538 | |
| 2021-09-15 |
|
4 | BMBL |
Bumble Inc.
Class A Common Stock |
S - Sale | -6.907.443 | 25.873.691 | -21,07 | 52,38 | -361.811.864 | 1.355.263.935 | |
| 2021-09-15 |
|
4 | BMBL |
Bumble Inc.
Class A Common Stock |
S - Sale | -502.014 | 1.880.429 | -21,07 | 52,38 | -26.295.493 | 98.496.871 | |
| 2021-08-30 | 3 | SMFR |
Sema4 Holdings Corp.
Class A Common Stock |
24.404.324 | ||||||||
| 2021-08-30 | 3 | SMFR |
Sema4 Holdings Corp.
Class A Common Stock |
505.095 | ||||||||
| 2021-08-30 | 3 | SMFR |
Sema4 Holdings Corp.
Class A Common Stock |
147.574 | ||||||||
| 2021-08-30 | 3 | SMFR |
Sema4 Holdings Corp.
Class A Common Stock |
100.000 | ||||||||
| 2021-08-26 |
|
4 | CYRX |
Cryoport, Inc.
Common Stock |
S - Sale | -7.638 | 21.739 | -26,00 | 60,00 | -458.280 | 1.304.340 | |
| 2021-08-26 |
|
4 | CYRX |
Cryoport, Inc.
Common Stock |
S - Sale | -327.362 | 931.657 | -26,00 | 60,00 | -19.641.720 | 55.899.420 | |
| 2021-08-25 |
|
4 | PRAX |
Praxis Precision Medicines, Inc.
Common Stock |
S - Sale | -771 | 446.546 | -0,17 | 20,04 | -15.451 | 8.948.782 | |
| 2021-08-25 |
|
4 | PRAX |
Praxis Precision Medicines, Inc.
Common Stock |
S - Sale | -351.625 | 447.317 | -44,01 | 19,00 | -6.680.875 | 8.499.023 | |
| 2021-08-20 |
|
4 | PRAX |
Praxis Precision Medicines, Inc.
Common Stock |
S - Sale | -3.000 | 798.942 | -0,37 | 15,88 | -47.640 | 12.687.199 | |
| 2021-08-18 |
|
4 | GTES |
Gates Industrial Corp plc
Ordinary Shares |
S - Sale | -43.780 | 289.233 | -13,15 | 15,36 | -672.461 | 4.442.619 | |
| 2021-08-18 |
|
4 | GTES |
Gates Industrial Corp plc
Ordinary Shares |
S - Sale | -12.786.205 | 84.471.402 | -13,15 | 15,36 | -196.396.109 | 1.297.480.735 | |
| 2021-08-18 |
|
4 | GTES |
Gates Industrial Corp plc
Ordinary Shares |
S - Sale | -13.223.021 | 87.357.197 | -13,15 | 15,36 | -203.105.603 | 1.341.806.546 | |
| 2021-08-18 |
|
4 | GTES |
Gates Industrial Corp plc
Ordinary Shares |
S - Sale | -2.696.994 | 17.817.551 | -13,15 | 15,36 | -41.425.828 | 273.677.583 | |
| 2021-08-13 | 3 | OPFI |
OppFi Inc.
Class A Common Stock |
1.120.000 | ||||||||
| 2021-08-13 |
|
4 | PRAX |
Praxis Precision Medicines, Inc.
Common Stock |
S - Sale | -10.060 | 801.942 | -1,24 | 13,92 | -140.035 | 11.163.033 | |
| 2021-08-13 |
|
4 | PRAX |
Praxis Precision Medicines, Inc.
Common Stock |
S - Sale | -17.222 | 812.002 | -2,08 | 15,03 | -258.847 | 12.204.390 | |
| 2021-08-05 |
|
4 | PRAX |
Praxis Precision Medicines, Inc.
Common Stock |
S - Sale | -22.300 | 829.224 | -2,62 | 14,99 | -334.277 | 12.430.068 | |
| 2021-08-03 |
|
4 | PRAX |
Praxis Precision Medicines, Inc.
Common Stock |
S - Sale | -40.000 | 851.524 | -4,49 | 15,78 | -631.200 | 13.437.049 | |
| 2021-08-03 |
|
4 | PRAX |
Praxis Precision Medicines, Inc.
Common Stock |
S - Sale | -15.854 | 891.524 | -1,75 | 15,68 | -248.591 | 13.979.096 | |
| 2021-07-20 |
|
4 | IMGO |
Imago BioSciences, Inc.
Series C convertible Preferred Stock |
C - Conversion | -197.131 | 0 | -100,00 | ||||
| 2021-07-20 |
|
4 | IMGO |
Imago BioSciences, Inc.
Series B convertible Preferred Stock |
C - Conversion | -1.155.689 | 0 | -100,00 | ||||
| 2021-07-20 |
|
4 | IMGO |
Imago BioSciences, Inc.
Series A convertible Preferred Stock |
C - Conversion | -1.872.217 | 0 | -100,00 | ||||
| 2021-07-20 |
|
4 | IMGO |
Imago BioSciences, Inc.
Common Stock |
P - Purchase | 150.000 | 3.375.037 | 4,65 | 16,00 | 2.400.000 | 54.000.592 | |
| 2021-07-20 |
|
4 | IMGO |
Imago BioSciences, Inc.
Common Stock |
C - Conversion | 197.131 | 3.225.037 | 6,51 | ||||
| 2021-07-20 |
|
4 | IMGO |
Imago BioSciences, Inc.
Common Stock |
C - Conversion | 1.155.689 | 3.027.906 | 61,73 | ||||
| 2021-07-20 |
|
4 | IMGO |
Imago BioSciences, Inc.
Common Stock |
C - Conversion | 1.872.217 | 1.872.217 | |||||
| 2021-07-12 | 3 | ALIT |
Alight Group, Inc.
Class A common stock |
88.505 | ||||||||
| 2021-07-12 | 3 | ALIT |
Alight Group, Inc.
Class A common stock |
332 | ||||||||
| 2021-07-12 | 3 | ALIT |
Alight Group, Inc.
Class A common stock |
957 | ||||||||
| 2021-07-12 | 3 | ALIT |
Alight Group, Inc.
Class A common stock |
10.206 | ||||||||
| 2021-07-12 | 3 | ALIT |
Alight Group, Inc.
Class A common stock |
54.733.898 | ||||||||
| 2021-07-12 | 3 | ALIT |
Alight Group, Inc.
Class V common stock |
48.395.456 | ||||||||
| 2021-07-12 | 3 | ALIT |
Alight Group, Inc.
Class V common stock |
181.572 | ||||||||
| 2021-07-12 | 3 | ALIT |
Alight Group, Inc.
Class V common stock |
523.291 | ||||||||
| 2021-07-12 | 3 | ALIT |
Alight Group, Inc.
Class V common stock |
5.580.752 | ||||||||
| 2021-06-21 |
|
4 | EARN |
Ellington Residential Mortgage REIT
Common Stock |
S - Sale | -2.675.000 | 628.578 | -80,97 | 12,80 | -34.240.000 | 8.045.798 | |
| 2021-06-17 |
|
4 | CYRX |
Cryoport, Inc.
Common Stock |
S - Sale | -4.560 | 29.377 | -13,44 | 60,00 | -273.600 | 1.762.620 | |
| 2021-06-17 |
|
4 | CYRX |
Cryoport, Inc.
Common Stock |
S - Sale | -195.440 | 1.259.019 | -13,44 | 60,00 | -11.726.400 | 75.541.140 | |
| 2021-06-17 |
|
4 | TASK |
TaskUs, Inc.
Class B Common Stock |
C - Conversion | -6.478.658 | 55.258.362 | -10,49 | ||||
| 2021-06-17 |
|
4 | TASK |
TaskUs, Inc.
Class A Common Stock |
S - Sale | -6.478.658 | 0 | -100,00 | 21,74 | -140.813.632 | ||
| 2021-06-17 |
|
4 | TASK |
TaskUs, Inc.
Class A Common Stock |
C - Conversion | 6.478.658 | 6.478.658 | |||||
| 2021-06-16 |
|
4 | APR |
Apria, Inc.
Common Stock |
S - Sale | -5.175.000 | 19.037.042 | -21,37 | 25,38 | -131.341.500 | 483.160.126 | |
| 2021-06-11 |
|
4 | CYRX |
Cryoport, Inc.
Common Stock |
S - Sale | -11.401 | 33.937 | -25,15 | 60,00 | -684.060 | 2.036.220 | |
| 2021-06-11 |
|
4 | CYRX |
Cryoport, Inc.
Common Stock |
S - Sale | -488.599 | 1.454.459 | -25,15 | 60,00 | -29.315.940 | 87.267.540 | |
| 2021-06-09 |
|
4 | CQP |
Cheniere Energy Partners, L.P.
Common Units |
J - Other | -215 | 2.011.447 | -0,01 | ||||
| 2021-06-09 |
|
4 | CQP |
Cheniere Energy Partners, L.P.
Common Units |
J - Other | -19.868 | 185.808.450 | -0,01 | ||||
| 2021-06-09 |
|
4 | CQP |
Cheniere Energy Partners, L.P.
Common Units |
J - Other | -241 | 2.250.419 | -0,01 | ||||
| 2021-06-08 |
|
4 | VVNT |
Vivint Smart Home, Inc.
Class A Common Stock |
J - Other | -153.213 | 104.536.629 | -0,15 | ||||
| 2021-05-14 |
|
4 | TALS |
Talaris Therapeutics, Inc.
Series B Convertible Preferred Stock |
C - Conversion | -135.334 | 0 | -100,00 | ||||
| 2021-05-14 |
|
4 | TALS |
Talaris Therapeutics, Inc.
Series B Convertible Preferred Stock |
C - Conversion | -676.774 | 0 | -100,00 | ||||
| 2021-05-14 |
|
4 | TALS |
Talaris Therapeutics, Inc.
Series B Convertible Preferred Stock |
C - Conversion | -366.918 | 0 | -100,00 | ||||
| 2021-05-14 |
|
4 | TALS |
Talaris Therapeutics, Inc.
Series B Convertible Preferred Stock |
C - Conversion | -562.891 | 0 | -100,00 | ||||
| 2021-05-14 |
|
4 | TALS |
Talaris Therapeutics, Inc.
Series B Convertible Preferred Stock |
C - Conversion | -278.707 | 0 | -100,00 | ||||
| 2021-05-14 |
|
4 | TALS |
Talaris Therapeutics, Inc.
Series B Convertible Preferred Stock |
C - Conversion | -696.767 | 0 | -100,00 | ||||
| 2021-05-14 |
|
4 | TALS |
Talaris Therapeutics, Inc.
Series A-1 Convertible Preferred Stock |
C - Conversion | -717.160 | 0 | -100,00 | ||||
| 2021-05-14 |
|
4 | TALS |
Talaris Therapeutics, Inc.
Series A-1 Convertible Preferred Stock |
C - Conversion | -3.586.364 | 0 | -100,00 | ||||
| 2021-05-14 |
|
4 | TALS |
Talaris Therapeutics, Inc.
Series A-1 Convertible Preferred Stock |
C - Conversion | -1.944.371 | 0 | -100,00 | ||||
| 2021-05-14 |
|
4 | TALS |
Talaris Therapeutics, Inc.
Series A-1 Convertible Preferred Stock |
C - Conversion | -2.982.874 | 0 | -100,00 | ||||
| 2021-05-14 |
|
4 | TALS |
Talaris Therapeutics, Inc.
Series A-1 Convertible Preferred Stock |
C - Conversion | -1.476.924 | 0 | -100,00 | ||||
| 2021-05-14 |
|
4 | TALS |
Talaris Therapeutics, Inc.
Series A-1 Convertible Preferred Stock |
C - Conversion | -3.692.307 | 0 | -100,00 | ||||
| 2021-05-14 |
|
4 | TALS |
Talaris Therapeutics, Inc.
Series A Convertible Preferred Stock |
C - Conversion | -26.000.000 | 0 | -100,00 | ||||
| 2021-05-14 |
|
4 | TALS |
Talaris Therapeutics, Inc.
Common Stock |
P - Purchase | 701 | 160.044 | 0,44 | 17,00 | 11.917 | 2.720.748 | |
| 2021-05-14 |
|
4 | TALS |
Talaris Therapeutics, Inc.
Common Stock |
P - Purchase | 3.507 | 800.353 | 0,44 | 17,00 | 59.619 | 13.606.001 | |
| 2021-05-14 |
|
4 | TALS |
Talaris Therapeutics, Inc.
Common Stock |
P - Purchase | 1.902 | 433.917 | 0,44 | 17,00 | 32.334 | 7.376.589 | |
| 2021-05-14 |
|
4 | TALS |
Talaris Therapeutics, Inc.
Common Stock |
P - Purchase | 2.917 | 665.676 | 0,44 | 17,00 | 49.589 | 11.316.492 | |
| 2021-05-14 |
|
4 | TALS |
Talaris Therapeutics, Inc.
Common Stock |
P - Purchase | 1.444 | 329.598 | 0,44 | 17,00 | 24.548 | 5.603.166 | |
| 2021-05-14 |
|
4 | TALS |
Talaris Therapeutics, Inc.
Common Stock |
P - Purchase | 3.611 | 823.997 | 0,44 | 17,00 | 61.387 | 14.007.949 | |
| 2021-05-14 |
|
4 | TALS |
Talaris Therapeutics, Inc.
Common Stock |
P - Purchase | 15.918 | 4.875.730 | 0,33 | 17,00 | 270.606 | 82.887.410 | |
| 2021-05-14 |
|
4 | TALS |
Talaris Therapeutics, Inc.
Common Stock |
C - Conversion | 25.296 | 159.343 | 18,87 | ||||
| 2021-05-14 |
|
4 | TALS |
Talaris Therapeutics, Inc.
Common Stock |
C - Conversion | 126.499 | 796.846 | 18,87 | ||||
| 2021-05-14 |
|
4 | TALS |
Talaris Therapeutics, Inc.
Common Stock |
C - Conversion | 68.582 | 432.015 | 18,87 | ||||
| 2021-05-14 |
|
4 | TALS |
Talaris Therapeutics, Inc.
Common Stock |
C - Conversion | 105.213 | 662.759 | 18,87 | ||||
| 2021-05-14 |
|
4 | TALS |
Talaris Therapeutics, Inc.
Common Stock |
C - Conversion | 52.094 | 328.154 | 18,87 | ||||
| 2021-05-14 |
|
4 | TALS |
Talaris Therapeutics, Inc.
Common Stock |
C - Conversion | 130.236 | 820.386 | 18,87 | ||||
| 2021-05-14 |
|
4 | TALS |
Talaris Therapeutics, Inc.
Common Stock |
C - Conversion | 134.047 | 134.047 | |||||
| 2021-05-14 |
|
4 | TALS |
Talaris Therapeutics, Inc.
Common Stock |
C - Conversion | 670.347 | 670.347 | |||||
| 2021-05-14 |
|
4 | TALS |
Talaris Therapeutics, Inc.
Common Stock |
C - Conversion | 363.433 | 363.433 | |||||
| 2021-05-14 |
|
4 | TALS |
Talaris Therapeutics, Inc.
Common Stock |
C - Conversion | 557.546 | 557.546 | |||||
| 2021-05-14 |
|
4 | TALS |
Talaris Therapeutics, Inc.
Common Stock |
C - Conversion | 276.060 | 276.060 | |||||
| 2021-05-14 |
|
4 | TALS |
Talaris Therapeutics, Inc.
Common Stock |
C - Conversion | 690.150 | 690.150 | |||||
| 2021-05-14 |
|
4 | TALS |
Talaris Therapeutics, Inc.
Common Stock |
C - Conversion | 4.859.812 | 4.859.812 | |||||
| 2021-04-28 | 3/A | BMBL |
Bumble Inc.
Class A Common Stock |
48.965.240 | ||||||||
| 2021-04-28 | 3/A | BMBL |
Bumble Inc.
Class A Common Stock |
21.211.476 | ||||||||
| 2021-04-28 | 3/A | BMBL |
Bumble Inc.
Class A Common Stock |
3.558.660 | ||||||||
| 2021-04-28 | 3/A | BMBL |
Bumble Inc.
Class A Common Stock |
7.949.090 | ||||||||
| 2021-04-28 | 3/A | BMBL |
Bumble Inc.
Class A Common Stock |
23.258 | ||||||||
| 2021-04-28 | 3/A | BMBL |
Bumble Inc.
Class B Common Stock |
1 | ||||||||
| 2021-04-28 | 3/A | BMBL |
Bumble Inc.
Class B Common Stock |
1 | ||||||||
| 2021-04-28 | 3/A | BMBL |
Bumble Inc.
Class B Common Stock |
1 | ||||||||
| 2021-04-28 |
|
4/A | BMBL |
Bumble Inc.
Common Units of Buzz Holdings L.P. |
S - Sale | -41.890 | 84.848 | -33,05 | 41,06 | -1.720.213 | 3.484.283 | |
| 2021-04-28 |
|
4/A | BMBL |
Bumble Inc.
Common Units of Buzz Holdings L.P. |
S - Sale | -191.822 | 388.538 | -33,05 | 41,06 | -7.877.170 | 15.955.313 | |
| 2021-04-28 |
|
4/A | BMBL |
Bumble Inc.
Common Units of Buzz Holdings L.P. |
S - Sale | -21.267.747 | 43.054.866 | -33,06 | 41,06 | -873.360.031 | 1.768.048.072 | |
| 2021-04-28 |
|
4/A | BMBL |
Bumble Inc.
Class A Common Stock |
S - Sale | -2.627.352 | 5.321.738 | -33,05 | 41,06 | -107.892.210 | 218.537.171 | |
| 2021-04-28 |
|
4/A | BMBL |
Bumble Inc.
Class A Common Stock |
S - Sale | -1.176.217 | 2.382.443 | -33,05 | 41,06 | -48.301.351 | 97.835.022 | |
| 2021-04-28 |
|
4/A | BMBL |
Bumble Inc.
Class A Common Stock |
S - Sale | -7.010.867 | 14.200.609 | -33,05 | 41,06 | -287.901.253 | 583.148.009 | |
| 2021-04-28 |
|
4/A | BMBL |
Bumble Inc.
Class A Common Stock |
S - Sale | -16.184.106 | 32.781.134 | -33,05 | 41,06 | -664.600.313 | 1.346.157.268 | |
| 2021-04-28 |
|
4 | N/A |
Blackstone Real Estate Income Fund II
Advisor Class I Common Shares of Beneficial Interest |
J - Other | -34 | 27 | -56,04 | 841,92 | -28.457 | 22.325 | |
| 2021-04-28 |
|
4 | N/A |
Blackstone Real Estate Income Fund II
Institutional Class II Common Shares of Beneficial Interest |
J - Other | -8.422 | 6.788 | -55,37 | 852,05 | -7.175.848 | 5.783.832 | |
| 2021-04-28 |
|
4 | N/A |
Blackstone Real Estate Income Fund
Common Shares of Beneficial Interest |
J - Other | -7.728 | 6.579 | -54,01 | 873,44 | -6.750.020 | 5.746.638 | |
| 2021-04-12 | 3 | NSCO |
Custom Truck One Source, Inc.
Common Stock |
2.932.195 | ||||||||
| 2021-04-12 | 3 | NSCO |
Custom Truck One Source, Inc.
Common Stock |
3.622.088 | ||||||||
| 2021-04-12 | 3 | NSCO |
Custom Truck One Source, Inc.
Common Stock |
351.593 | ||||||||
| 2021-04-12 | 3 | NSCO |
Custom Truck One Source, Inc.
Common Stock |
179.835 | ||||||||
| 2021-04-12 | 3 | NSCO |
Custom Truck One Source, Inc.
Common Stock |
3.492.069 | ||||||||
| 2021-04-12 | 3 | NSCO |
Custom Truck One Source, Inc.
Common Stock |
3.576.281 | ||||||||
| 2021-04-12 | 3 | NSCO |
Custom Truck One Source, Inc.
Common Stock |
17.360 | ||||||||
| 2021-04-05 |
|
4 | PACK |
Ranpak Holdings Corp.
Warrant (right to buy) |
P - Purchase | 39.200 | 2.380.800 | 1,67 | 1,31 | 51.368 | 3.119.800 | |
| 2021-04-05 |
|
4 | PACK |
Ranpak Holdings Corp.
Warrant (right to buy) |
S - Sale | -39.200 | 179.200 | -17,95 | 1,31 | -51.368 | 234.824 | |
| 2021-04-05 |
|
4 | PACK |
Ranpak Holdings Corp.
Warrant (right to buy) |
P - Purchase | 140.000 | 2.341.600 | 6,36 | 0,94 | 132.300 | 2.212.812 | |
| 2021-04-05 |
|
4 | PACK |
Ranpak Holdings Corp.
Warrant (right to buy) |
S - Sale | -140.000 | 218.400 | -39,06 | 0,94 | -132.300 | 206.388 | |
| 2021-04-05 |
|
4 | PACK |
Ranpak Holdings Corp.
Class A Common Stock |
P - Purchase | 36.750 | 4.208.250 | 0,88 | 6,82 | 250.484 | 28.683.011 | |
| 2021-04-05 |
|
4 | PACK |
Ranpak Holdings Corp.
Class A Common Stock |
S - Sale | -36.750 | 316.750 | -10,40 | 6,82 | -250.484 | 2.158.936 | |
| 2021-04-05 |
|
4 | PACK |
Ranpak Holdings Corp.
Class A Common Stock |
P - Purchase | 280.000 | 4.171.500 | 7,20 | 7,49 | 2.097.200 | 31.244.535 | |
| 2021-04-05 |
|
4 | PACK |
Ranpak Holdings Corp.
Class A Common Stock |
S - Sale | -280.000 | 353.500 | -44,20 | 7,49 | -2.097.200 | 2.647.715 | |
| 2021-04-05 |
|
4/A | PACK |
Ranpak Holdings Corp.
Warrant (right to buy) |
J - Other | -179.200 | 0 | -100,00 | ||||
| 2021-04-05 |
|
4/A | PACK |
Ranpak Holdings Corp.
Warrant (right to buy) |
J - Other | -2.380.800 | 0 | -100,00 | ||||
| 2021-04-05 |
|
4/A | PACK |
Ranpak Holdings Corp.
Class A Common Stock |
J - Other | 39.424 | 356.174 | 12,45 | ||||
| 2021-04-05 |
|
4/A | PACK |
Ranpak Holdings Corp.
Class A Common Stock |
J - Other | 523.776 | 4.732.026 | 12,45 | ||||
| 2021-04-05 | 3 | FOA |
Finance of America Companies Inc.
Class A Common Stock |
2.022.766 | ||||||||
| 2021-04-05 | 3 | FOA |
Finance of America Companies Inc.
Class A Common Stock |
11.612 | ||||||||
| 2021-04-05 | 3 | FOA |
Finance of America Companies Inc.
Class A Common Stock |
23.066.495 | ||||||||
| 2021-04-05 | 3 | FOA |
Finance of America Companies Inc.
Class B Common Stock |
1 | ||||||||
| 2021-04-05 | 3 | FOA |
Finance of America Companies Inc.
Class B Common Stock |
1 | ||||||||
| 2021-03-26 |
|
4 | CQP |
Cheniere Energy Partners, L.P.
Common Units |
S - Sale | -462.922 | 0 | -100,00 | 37,00 | -17.128.114 | ||
| 2021-03-26 |
|
4 | CQP |
Cheniere Energy Partners, L.P.
Common Units |
S - Sale | -953.855 | 0 | -100,00 | 37,00 | -35.292.635 | ||
| 2021-03-26 |
|
4 | CQP |
Cheniere Energy Partners, L.P.
Common Units |
S - Sale | -953.855 | 0 | -100,00 | 37,00 | -35.292.635 | ||
| 2021-03-24 |
|
4 | VEI |
VINE ENERGY INC.
Class A Common Stock |
P - Purchase | 8.152 | 145.715 | 5,93 | 13,30 | 108.422 | 1.938.010 | |
| 2021-03-24 |
|
4 | VEI |
VINE ENERGY INC.
Class A Common Stock |
P - Purchase | 21.787 | 22.468 | 3.199,27 | 13,30 | 289.767 | 298.824 | |
| 2021-03-24 |
|
4 | VEI |
VINE ENERGY INC.
Class A Common Stock |
P - Purchase | 556.887 | 7.082.421 | 8,53 | 13,30 | 7.406.597 | 94.196.199 | |
| 2021-03-24 |
|
4 | VEI |
VINE ENERGY INC.
Class A Common Stock |
P - Purchase | 1.409.507 | 1.465.969 | 2.496,38 | 13,30 | 18.746.443 | 19.497.388 | |
| 2021-03-24 |
|
4 | VEI |
VINE ENERGY INC.
Class A Common Stock |
P - Purchase | 808.762 | 10.276.529 | 8,54 | 13,30 | 10.756.535 | 136.677.836 | |
| 2021-03-24 |
|
4 | VEI |
VINE ENERGY INC.
Class A Common Stock |
P - Purchase | 1.479.905 | 1.537.048 | 2.589,83 | 13,30 | 19.682.736 | 20.442.738 | |
| 2021-03-17 | 3 | VEI |
VINE ENERGY INC.
Class A Common Stock |
57.143 | ||||||||
| 2021-03-17 | 3 | VEI |
VINE ENERGY INC.
Class A Common Stock |
9.467.767 | ||||||||
| 2021-03-17 | 3 | VEI |
VINE ENERGY INC.
Class A Common Stock |
56.462 | ||||||||
| 2021-03-17 | 3 | VEI |
VINE ENERGY INC.
Class A Common Stock |
6.525.534 | ||||||||
| 2021-03-17 | 3 | VEI |
VINE ENERGY INC.
Class A Common Stock |
681 | ||||||||
| 2021-03-17 | 3 | VEI |
VINE ENERGY INC.
Class A Common Stock |
137.563 | ||||||||
| 2021-03-17 | 3 | VEI |
VINE ENERGY INC.
Class B Common Stock |
17.437.592 | ||||||||
| 2021-03-17 | 3 | VEI |
VINE ENERGY INC.
Class B Common Stock |
16.649.664 | ||||||||
| 2021-03-17 | 3 | VEI |
VINE ENERGY INC.
Class B Common Stock |
201.852 | ||||||||
| 2021-03-04 |
|
4 | GTES |
Gates Industrial Corp plc
Ordinary Shares |
S - Sale | -38.527 | 333.013 | -10,37 | 14,40 | -554.789 | 4.795.387 | |
| 2021-03-04 |
|
4 | GTES |
Gates Industrial Corp plc
Ordinary Shares |
S - Sale | -11.251.860 | 97.257.607 | -10,37 | 14,40 | -162.026.784 | 1.400.509.541 | |
| 2021-03-04 |
|
4 | GTES |
Gates Industrial Corp plc
Ordinary Shares |
S - Sale | -11.636.258 | 100.580.217 | -10,37 | 14,40 | -167.562.115 | 1.448.355.125 | |
| 2021-03-04 |
|
4 | GTES |
Gates Industrial Corp plc
Ordinary Shares |
S - Sale | -2.373.355 | 20.514.545 | -10,37 | 14,40 | -34.176.312 | 295.409.448 | |
| 2021-02-18 |
|
4 | BMBL |
Bumble Inc.
Common Units of Buzz Holdings L.P. |
S - Sale | -20.852 | 42.217 | -33,06 | 41,06 | -856.287 | 1.733.641 | |
| 2021-02-18 |
|
4 | BMBL |
Bumble Inc.
Common Units of Buzz Holdings L.P. |
S - Sale | -191.822 | 388.538 | -33,05 | 41,06 | -7.877.170 | 15.955.313 | |
| 2021-02-18 |
|
4 | BMBL |
Bumble Inc.
Common Units of Buzz Holdings L.P. |
S - Sale | -23.488.478 | 47.553.007 | -33,06 | 41,06 | -964.554.349 | 1.952.764.232 | |
| 2021-02-18 |
|
4 | BMBL |
Bumble Inc.
Class A Common Stock |
S - Sale | -2.589.946 | 5.245.973 | -33,05 | 41,06 | -106.356.132 | 215.425.881 | |
| 2021-02-18 |
|
4 | BMBL |
Bumble Inc.
Class A Common Stock |
S - Sale | -1.457.332 | 2.951.847 | -33,05 | 41,06 | -59.845.339 | 121.217.597 | |
| 2021-02-18 |
|
4 | BMBL |
Bumble Inc.
Class A Common Stock |
S - Sale | -6.426.070 | 13.016.095 | -33,05 | 41,06 | -263.886.565 | 534.505.941 | |
| 2021-02-18 |
|
4 | BMBL |
Bumble Inc.
Class A Common Stock |
S - Sale | -14.325.500 | 29.016.501 | -33,05 | 41,06 | -588.276.658 | 1.191.562.614 | |
| 2021-02-18 |
|
4 | APR |
Apria, Inc.
Common Stock |
S - Sale | -8.625.000 | 24.212.042 | -26,27 | 18,60 | -160.425.000 | 450.343.981 | |
| 2021-02-12 | 3 | BMBL |
Bumble Inc.
Class A Common Stock |
43.342.001 | ||||||||
| 2021-02-12 | 3 | BMBL |
Bumble Inc.
Class A Common Stock |
19.442.165 | ||||||||
| 2021-02-12 | 3 | BMBL |
Bumble Inc.
Class A Common Stock |
4.409.179 | ||||||||
| 2021-02-12 | 3 | BMBL |
Bumble Inc.
Class A Common Stock |
7.835.919 | ||||||||
| 2021-02-12 | 3 | BMBL |
Bumble Inc.
Class A Common Stock |
23.256 | ||||||||
| 2021-02-12 | 3 | BMBL |
Bumble Inc.
Class B Common Stock |
1 | ||||||||
| 2021-02-12 | 3 | BMBL |
Bumble Inc.
Class B Common Stock |
1 | ||||||||
| 2021-02-12 | 3 | BMBL |
Bumble Inc.
Class B Common Stock |
1 | ||||||||
| 2021-02-11 | 3 | APR |
Apria, Inc.
Common Stock |
32.837.042 | ||||||||
| 2021-02-09 |
|
4 | CYRX |
Cryoport, Inc.
4.0% Series C Convertible Preferred Stock |
C - Conversion | -1.140 | 4.561 | -20,00 | ||||
| 2021-02-09 |
|
4 | CYRX |
Cryoport, Inc.
4.0% Series C Convertible Preferred Stock |
C - Conversion | -48.860 | 195.439 | -20,00 | ||||
| 2021-02-09 |
|
4 | CYRX |
Cryoport, Inc.
Common Stock |
C - Conversion | 29.933 | 45.338 | 194,31 | ||||
| 2021-02-09 |
|
4 | CYRX |
Cryoport, Inc.
Common Stock |
C - Conversion | 1.282.927 | 1.943.058 | 194,34 | ||||
| 2021-02-02 |
|
4 | TW |
Tradeweb Markets Inc.
Class D Common Stock |
S - Sale | -22.988.329 | 0 | -100,00 | ||||
| 2021-02-02 |
|
4 | TW |
Tradeweb Markets Inc.
Non-voting common units of Tradeweb Markets LLC |
S - Sale | -22.988.329 | 0 | -100,00 | ||||
| 2021-02-02 |
|
4 | TW |
Tradeweb Markets Inc.
Class B Common Stock |
S - Sale | -96.933.192 | 0 | -100,00 | ||||
| 2021-01-26 |
|
4 | N/A |
Blackstone Real Estate Income Fund
Common Shares of Beneficial Interest |
J - Other | -1.954 | 14.307 | -12,02 | 821,68 | -1.605.776 | 11.756.096 | |
| 2021-01-26 |
|
4 | N/A |
Blackstone Real Estate Income Fund II
Advisor Class I Common Shares of Beneficial Interest |
J - Other | -9 | 60 | -12,47 | 792,15 | -6.805 | 47.782 | |
| 2021-01-26 |
|
4 | N/A |
Blackstone Real Estate Income Fund II
Institutional Class II Common Shares of Beneficial Interest |
J - Other | -2.137 | 15.210 | -12,32 | 801,68 | -1.712.918 | 12.193.537 | |
| 2021-01-11 |
|
4 | NONE |
Blackstone Private Credit Fund
Class I Common Shares of Beneficial Interest |
P - Purchase | 997.940 | 1.000.000 | 48.443,69 | 25,00 | 24.948.500 | 25.000.000 | |
| 2021-01-06 |
|
4 | CQP |
Cheniere Energy Partners, L.P.
Common Units |
J - Other | 10.995 | 48.544 | 29,28 | ||||
| 2021-01-06 |
|
4 | CQP |
Cheniere Energy Partners, L.P.
Common Units |
J - Other | 31.430 | 138.772 | 29,28 | ||||
| 2021-01-06 |
|
4 | CQP |
Cheniere Energy Partners, L.P.
Common Units |
J - Other | -42.425 | 2.250.419 | -1,85 | ||||
| 2021-01-06 |
|
4 | CQP |
Cheniere Energy Partners, L.P.
Common Units |
P - Purchase | 42.425 | 2.292.844 | 1,89 | 34,93 | 1.481.905 | 80.089.041 | |
| 2021-01-05 |
|
4 | CQP |
Cheniere Energy Partners, L.P.
Common Units |
J - Other | 18.538 | 37.549 | 97,51 | ||||
| 2021-01-05 |
|
4 | CQP |
Cheniere Energy Partners, L.P.
Common Units |
J - Other | 52.994 | 107.342 | 97,51 | ||||
| 2021-01-05 |
|
4 | CQP |
Cheniere Energy Partners, L.P.
Common Units |
J - Other | -71.532 | 2.250.419 | -3,08 | ||||
| 2021-01-05 |
|
4 | CQP |
Cheniere Energy Partners, L.P.
Common Units |
P - Purchase | 20.360 | 2.321.951 | 0,88 | 35,43 | 721.355 | 82.266.724 | |
| 2021-01-05 |
|
4 | CQP |
Cheniere Energy Partners, L.P.
Common Units |
P - Purchase | 51.172 | 2.301.591 | 2,27 | 34,77 | 1.779.250 | 80.026.319 | |
| 2020-12-31 |
|
4 | CQP |
Cheniere Energy Partners, L.P.
Common Units |
J - Other | 19.011 | 19.011 | |||||
| 2020-12-31 |
|
4 | CQP |
Cheniere Energy Partners, L.P.
Common Units |
J - Other | 54.348 | 54.348 | |||||
| 2020-12-31 |
|
4 | CQP |
Cheniere Energy Partners, L.P.
Common Units |
J - Other | -73.359 | 2.250.419 | -3,16 | ||||
| 2020-12-31 |
|
4 | CQP |
Cheniere Energy Partners, L.P.
Common Units |
P - Purchase | 46.101 | 2.323.778 | 2,02 | 34,14 | 1.573.888 | 79.333.781 | |
| 2020-12-31 |
|
4 | CQP |
Cheniere Energy Partners, L.P.
Common Units |
P - Purchase | 27.258 | 2.277.677 | 1,21 | 33,71 | 918.867 | 76.780.492 | |
| 2020-10-23 |
|
4 | NONE |
Blackstone Private Credit Fund
Class I Common Shares of Beneficial Interest |
P - Purchase | 2.000 | 2.060 | 3.333,33 | 25,00 | 50.000 | 51.500 | |
| 2020-10-22 |
|
4 | PRAX |
Praxis Precision Medicines, Inc.
Series C-1 Redeemable Convertible Preferred Stock |
C - Conversion | -352.734 | 0 | -100,00 | ||||
| 2020-10-22 |
|
4 | PRAX |
Praxis Precision Medicines, Inc.
Series C Redeemable Convertible Preferred Stock |
C - Conversion | -1.941.748 | 0 | -100,00 | ||||
| 2020-10-22 |
|
4 | PRAX |
Praxis Precision Medicines, Inc.
Series C Redeemable Convertible Preferred Stock |
C - Conversion | -559.208 | 0 | -100,00 | ||||
| 2020-10-22 |
|
4 | PRAX |
Praxis Precision Medicines, Inc.
Series B-1 Redeemable Convertible Preferred Stock |
C - Conversion | -1.410.477 | 0 | -100,00 | ||||
| 2020-10-22 |
|
4 | PRAX |
Praxis Precision Medicines, Inc.
Series B Redeemable Convertible Preferred Stock |
C - Conversion | -5.052.852 | 0 | -100,00 | ||||
| 2020-10-22 |
|
4 | PRAX |
Praxis Precision Medicines, Inc.
Series A Redeemable Convertible Preferred Stock |
C - Conversion | -7.375.799 | 0 | -100,00 | ||||
| 2020-10-22 |
|
4 | PRAX |
Praxis Precision Medicines, Inc.
Common Stock |
C - Conversion | 164.832 | 7.594.109 | 2,22 | ||||
| 2020-10-22 |
|
4 | PRAX |
Praxis Precision Medicines, Inc.
Common Stock |
C - Conversion | 907.378 | 907.378 | |||||
| 2020-10-22 |
|
4 | PRAX |
Praxis Precision Medicines, Inc.
Common Stock |
C - Conversion | 261.318 | 7.429.277 | 3,65 | ||||
| 2020-10-22 |
|
4 | PRAX |
Praxis Precision Medicines, Inc.
Common Stock |
C - Conversion | 659.116 | 7.167.959 | 10,13 | ||||
| 2020-10-22 |
|
4 | PRAX |
Praxis Precision Medicines, Inc.
Common Stock |
C - Conversion | 2.361.198 | 6.508.843 | 56,93 | ||||
| 2020-10-22 |
|
4 | PRAX |
Praxis Precision Medicines, Inc.
Common Stock |
C - Conversion | 3.446.711 | 4.147.645 | 491,73 | ||||
| 2020-10-15 | 3 | PRAX |
Praxis Precision Medicines, Inc.
Common Stock |
700.934 | ||||||||
| 2020-10-14 | 3 | RUN |
Sunrun Inc.
Common Stock |
18.302.287 | ||||||||
| 2020-10-14 | 3 | RUN |
Sunrun Inc.
Common Stock |
5.879.710 | ||||||||
| 2020-10-14 | 3 | RUN |
Sunrun Inc.
Common Stock |
9.267 | ||||||||
| 2020-10-14 | 3 | RUN |
Sunrun Inc.
Common Stock |
111.404 | ||||||||
| 2020-10-14 |
|
4 | RUN |
Sunrun Inc.
Common Stock |
S - Sale | -36.672 | 74.732 | -32,92 | 60,25 | -2.209.488 | 4.502.603 | |
| 2020-10-14 |
|
4 | RUN |
Sunrun Inc.
Common Stock |
S - Sale | -3.050 | 6.217 | -32,91 | 60,25 | -183.762 | 374.574 | |
| 2020-10-14 |
|
4 | RUN |
Sunrun Inc.
Common Stock |
S - Sale | -1.935.494 | 3.944.216 | -32,92 | 60,25 | -116.613.514 | 237.639.014 | |
| 2020-10-14 |
|
4 | RUN |
Sunrun Inc.
Common Stock |
S - Sale | -6.024.784 | 12.277.503 | -32,92 | 60,25 | -362.993.236 | 739.719.556 | |
| 2020-10-13 | 3 | CYRX |
Cryoport, Inc.
Common Stock |
660.131 | ||||||||
| 2020-10-13 | 3 | CYRX |
Cryoport, Inc.
Common Stock |
15.405 | ||||||||
| 2020-10-13 |
|
4 | VSLR |
Vivint Solar, Inc.
Common Stock |
J - Other | -57.917.967 | 0 | -100,00 | ||||
| 2020-10-05 |
|
4 | MIK |
Michaels Companies, Inc.
Common Stock |
S - Sale | -255.444 | 265.496 | -49,04 | 10,02 | -2.559.549 | 2.660.270 | |
| 2020-10-05 |
|
4 | MIK |
Michaels Companies, Inc.
Common Stock |
S - Sale | -336.652 | 349.900 | -49,04 | 10,02 | -3.373.253 | 3.505.998 | |
| 2020-10-05 |
|
4 | MIK |
Michaels Companies, Inc.
Common Stock |
S - Sale | -22.953 | 23.857 | -49,03 | 10,02 | -229.989 | 239.047 | |
| 2020-10-05 |
|
4 | MIK |
Michaels Companies, Inc.
Common Stock |
S - Sale | -108.137 | 112.392 | -49,04 | 10,02 | -1.083.533 | 1.126.168 | |
| 2020-10-05 |
|
4 | MIK |
Michaels Companies, Inc.
Common Stock |
S - Sale | -1.726.777 | 1.794.732 | -49,04 | 10,02 | -17.302.306 | 17.983.215 | |
| 2020-10-05 |
|
4 | MIK |
Michaels Companies, Inc.
Common Stock |
S - Sale | -7.550.037 | 7.847.154 | -49,04 | 10,02 | -75.651.371 | 78.628.483 | |
| 2020-10-05 | 3 | NONE |
Blackstone Private Credit Fund
Class I Common Shares of Beneficial Interest |
60 | ||||||||
| 2020-10-01 |
|
4 | GRAY |
GRAYBUG VISION, INC.
Series C Preferred Stock |
C - Conversion | -395.068 | 0 | -100,00 | ||||
| 2020-10-01 |
|
4 | GRAY |
GRAYBUG VISION, INC.
Series B Preferred Stock |
C - Conversion | -1.285.327 | 0 | -100,00 | ||||
| 2020-10-01 |
|
4 | GRAY |
GRAYBUG VISION, INC.
Common Stock |
P - Purchase | 250.000 | 1.930.395 | 14,88 | 16,00 | 4.000.000 | 30.886.320 | |
| 2020-10-01 |
|
4 | GRAY |
GRAYBUG VISION, INC.
Common Stock |
C - Conversion | 395.068 | 1.680.395 | 30,74 | ||||
| 2020-10-01 |
|
4 | GRAY |
GRAYBUG VISION, INC.
Common Stock |
C - Conversion | 1.285.327 | 1.285.327 | |||||
| 2020-10-01 | 3 | EPIX |
ESSA Pharma Inc.
Common Shares |
3.573.053 | ||||||||
| 2020-09-28 |
|
4 | CQP |
Cheniere Energy Partners, L.P.
Common Units |
J - Other | -13.170.436 | 203.240.752 | -6,09 | ||||
| 2020-09-28 |
|
4 | CQP |
Cheniere Energy Partners, L.P.
Common Units |
J - Other | -101.600.052 | 203.240.752 | -33,33 | ||||
| 2020-09-21 |
|
4 | VVNT |
Vivint Smart Home, Inc.
Earnout Rights |
C - Conversion | -9.633.858 | 0 | -100,00 | ||||
| 2020-09-21 |
|
4 | VVNT |
Vivint Smart Home, Inc.
Class A Common Stock |
C - Conversion | 9.633.858 | 107.366.330 | 9,86 | ||||
| 2020-09-04 |
|
4 | PACK |
Ranpak Holdings Corp.
Warrant (right to buy) |
J - Other | -358.400 | 0 | -100,00 | ||||
| 2020-09-04 |
|
4 | PACK |
Ranpak Holdings Corp.
Warrant (right to buy) |
J - Other | -2.201.600 | 0 | -100,00 | ||||
| 2020-09-04 |
|
4 | PACK |
Ranpak Holdings Corp.
Class A Common Stock |
J - Other | 78.848 | 712.348 | 12,45 | ||||
| 2020-09-04 |
|
4 | PACK |
Ranpak Holdings Corp.
Class A Common Stock |
J - Other | 484.352 | 4.375.852 | 12,45 | ||||
| 2020-08-24 |
|
4 | VSLR |
Vivint Solar, Inc.
Common Stock |
S - Sale | -11.627.907 | 57.917.967 | -16,72 | 21,50 | -250.000.000 | 1.245.236.290 | |
| 2020-07-30 |
|
4 | ANNX |
Annexon, Inc.
Series D Redeemable Convertible Preferred Stock |
C - Conversion | -2.109.407 | 0 | -100,00 | ||||
| 2020-07-30 |
|
4 | ANNX |
Annexon, Inc.
Series C Redeemable Convertible Preferred Stock |
C - Conversion | -6.148.147 | 0 | -100,00 | ||||
| 2020-07-30 |
|
4 | ANNX |
Annexon, Inc.
Series B Redeemable Convertible Preferred Stock |
C - Conversion | -8.370.685 | 0 | -100,00 | ||||
| 2020-07-30 |
|
4 | ANNX |
Annexon, Inc.
Series A-1 Redeemable Convertible Preferred Stock |
C - Conversion | -5.666.667 | 0 | -100,00 | ||||
| 2020-07-30 |
|
4 | ANNX |
Annexon, Inc.
Common Stock |
P - Purchase | 200.000 | 2.730.635 | 7,90 | 17,00 | 3.400.000 | 46.420.795 | |
| 2020-07-30 |
|
4 | ANNX |
Annexon, Inc.
Common Stock |
C - Conversion | 239.433 | 2.530.635 | 10,45 | ||||
| 2020-07-30 |
|
4 | ANNX |
Annexon, Inc.
Common Stock |
C - Conversion | 697.860 | 2.291.202 | 43,80 | ||||
| 2020-07-30 |
|
4 | ANNX |
Annexon, Inc.
Common Stock |
C - Conversion | 950.134 | 1.593.342 | 147,72 | ||||
| 2020-07-30 |
|
4 | ANNX |
Annexon, Inc.
Common Stock |
C - Conversion | 643.208 | 643.208 | |||||
| 2020-07-21 |
|
4 | VSLR |
Vivint Solar, Inc.
Common Stock |
J - Other | -73.683 | 69.545.874 | -0,11 | ||||
| 2020-06-15 |
|
4 | EARN |
Ellington Residential Mortgage REIT
Common Stock |
P - Purchase | 200 | 3.303.578 | 0,01 | 10,09 | 2.018 | 33.333.102 | |
| 2020-06-15 |
|
4 | EARN |
Ellington Residential Mortgage REIT
Common Stock |
P - Purchase | 14.633 | 3.303.378 | 0,44 | 10,23 | 149.696 | 33.793.557 | |
| 2020-06-15 |
|
4 | EARN |
Ellington Residential Mortgage REIT
Common Stock |
P - Purchase | 32.179 | 3.288.745 | 0,99 | 9,95 | 320.181 | 32.723.013 | |
| 2020-06-04 |
|
4 | EARN |
Ellington Residential Mortgage REIT
Common Stock |
P - Purchase | 2.703 | 3.256.566 | 0,08 | 9,91 | 26.787 | 32.272.569 | |
| 2020-06-04 |
|
4 | EARN |
Ellington Residential Mortgage REIT
Common Stock |
P - Purchase | 17.637 | 3.253.863 | 0,54 | 9,89 | 174.430 | 32.180.705 | |
| 2020-06-04 |
|
4 | EARN |
Ellington Residential Mortgage REIT
Common Stock |
P - Purchase | 26.331 | 3.236.226 | 0,82 | 9,75 | 256.727 | 31.553.204 | |
| 2020-06-03 |
|
4 | FG |
FGL Holdings
Ordinary Shares |
S - Sale | -24.016 | 0 | -100,00 | ||||
| 2020-06-03 |
|
4 | FG |
FGL Holdings
Ordinary Shares |
S - Sale | -113.921 | 0 | -100,00 | ||||
| 2020-06-03 |
|
4 | FG |
FGL Holdings
Ordinary Shares |
S - Sale | -52.541 | 0 | -100,00 | ||||
| 2020-06-03 |
|
4 | FG |
FGL Holdings
Ordinary Shares |
S - Sale | -165.079 | 0 | -100,00 | ||||
| 2020-06-03 |
|
4 | FG |
FGL Holdings
Ordinary Shares |
S - Sale | -50.912 | 0 | -100,00 | ||||
| 2020-06-03 |
|
4 | FG |
FGL Holdings
Ordinary Shares |
S - Sale | -1.442.118 | 0 | -100,00 | ||||
| 2020-06-03 |
|
4 | FG |
FGL Holdings
Ordinary Shares |
S - Sale | -4.147.302 | 0 | -100,00 | ||||
| 2020-06-03 |
|
4 | FG |
FGL Holdings
Ordinary Shares |
S - Sale | -142.111 | 0 | -100,00 | ||||
| 2020-06-03 |
|
4 | FG |
FGL Holdings
Ordinary Shares |
S - Sale | -42.743 | 0 | -100,00 | ||||
| 2020-06-03 |
|
4 | FG |
FGL Holdings
Ordinary Shares |
S - Sale | -22.500.000 | 0 | -100,00 | ||||
| 2020-06-03 |
|
4 | FG |
FGL Holdings
Ordinary Shares |
S - Sale | -16.620.850 | 0 | -100,00 | ||||
| 2020-06-01 |
|
4 | EARN |
Ellington Residential Mortgage REIT
Common Stock |
P - Purchase | 19.700 | 3.209.895 | 0,62 | 9,77 | 192.469 | 31.360.674 | |
| 2020-06-01 |
|
4 | EARN |
Ellington Residential Mortgage REIT
Common Stock |
P - Purchase | 23.569 | 3.190.195 | 0,74 | 9,55 | 225.084 | 30.466.362 | |
| 2020-06-01 |
|
4 | EARN |
Ellington Residential Mortgage REIT
Common Stock |
P - Purchase | 23.569 | 3.166.626 | 0,75 | 9,68 | 228.148 | 30.652.940 | |
| 2020-05-27 |
|
4 | EARN |
Ellington Residential Mortgage REIT
Common Stock |
P - Purchase | 15.200 | 3.143.057 | 0,49 | 9,69 | 147.288 | 30.456.222 | |
| 2020-05-27 |
|
4 | EARN |
Ellington Residential Mortgage REIT
Common Stock |
P - Purchase | 12.300 | 3.127.857 | 0,39 | 9,73 | 119.679 | 30.434.049 | |
| 2020-05-27 |
|
4 | EARN |
Ellington Residential Mortgage REIT
Common Stock |
P - Purchase | 12.300 | 3.115.557 | 0,40 | 9,42 | 115.866 | 29.348.547 | |
| 2020-05-26 |
|
4 | GTES |
Gates Industrial Corp plc
Ordinary Shares |
P - Purchase | 13.000 | 2.402.208 | 0,54 | 9,56 | 124.280 | 22.965.108 | |
| 2020-05-26 |
|
4 | GTES |
Gates Industrial Corp plc
Ordinary Shares |
P - Purchase | 700 | 2.389.208 | 0,03 | 9,73 | 6.811 | 23.246.994 | |
| 2020-05-20 |
|
4 | GTES |
Gates Industrial Corp plc
Ordinary Shares |
P - Purchase | 12.500 | 2.388.508 | 0,53 | 9,65 | 120.625 | 23.049.102 | |
| 2020-05-20 |
|
4 | GTES |
Gates Industrial Corp plc
Ordinary Shares |
P - Purchase | 100.300 | 2.376.008 | 4,41 | 9,54 | 956.862 | 22.667.116 | |
| 2020-05-15 |
|
4 | GTES |
Gates Industrial Corp plc
Ordinary Shares |
P - Purchase | 81.500 | 2.275.708 | 3,71 | 8,68 | 707.420 | 19.753.145 | |
| 2020-05-15 |
|
4 | GTES |
Gates Industrial Corp plc
Ordinary Shares |
P - Purchase | 81.500 | 2.194.208 | 3,86 | 8,63 | 703.345 | 18.936.015 | |
| 2020-05-15 |
|
4 | GTES |
Gates Industrial Corp plc
Ordinary Shares |
P - Purchase | 81.500 | 2.112.708 | 4,01 | 8,85 | 721.275 | 18.697.466 | |
| 2020-05-12 |
|
4 | GTES |
Gates Industrial Corp plc
Ordinary Shares |
P - Purchase | 81.500 | 2.031.208 | 4,18 | 9,06 | 738.390 | 18.402.744 | |
| 2020-05-12 |
|
4 | GTES |
Gates Industrial Corp plc
Ordinary Shares |
P - Purchase | 81.500 | 1.949.708 | 4,36 | 8,98 | 731.870 | 17.508.378 | |
| 2020-05-12 |
|
4 | GTES |
Gates Industrial Corp plc
Ordinary Shares |
P - Purchase | 69.000 | 1.868.208 | 3,84 | 8,67 | 598.230 | 16.197.363 | |
| 2020-04-17 |
|
4 | TGE |
Tallgrass Energy, LP
Class A shares |
P - Purchase | 152.770.061 | 0 | -100,00 | 22,45 | 3.429.687.869 | ||
| 2020-03-25 |
|
4 | CQP |
Cheniere Energy Partners, L.P.
Common Units |
P - Purchase | 156.792 | 2.250.419 | 7,49 | 21,85 | 3.426.407 | 49.178.856 | |
| 2020-03-23 |
|
4 | CQP |
Cheniere Energy Partners, L.P.
Common Units |
P - Purchase | 166.310 | 2.093.627 | 8,63 | 21,66 | 3.601.443 | 45.337.493 | |
| 2020-03-23 |
|
4 | CQP |
Cheniere Energy Partners, L.P.
Common Units |
P - Purchase | 81.429 | 1.927.317 | 4,41 | 20,51 | 1.670.198 | 39.531.392 | |
| 2020-03-23 |
|
4 | CQP |
Cheniere Energy Partners, L.P.
Common Units |
P - Purchase | 154.728 | 1.845.888 | 9,15 | 20,24 | 3.132.020 | 37.364.649 | |
| 2020-03-18 |
|
4 | CQP |
Cheniere Energy Partners, L.P.
Common Units |
P - Purchase | 62.209 | 1.691.160 | 3,82 | 25,93 | 1.613.073 | 43.851.610 | |
| 2020-03-18 |
|
4 | CQP |
Cheniere Energy Partners, L.P.
Common Units |
P - Purchase | 273.497 | 1.628.951 | 20,18 | 24,99 | 6.834.143 | 40.704.228 | |
| 2020-03-18 |
|
4 | CQP |
Cheniere Energy Partners, L.P.
Common Units |
P - Purchase | 484.211 | 1.355.454 | 55,58 | 26,36 | 12.763.511 | 35.728.954 | |
| 2020-03-18 |
|
4 | CQP |
Cheniere Energy Partners, L.P.
Common Units |
P - Purchase | 126.198 | 871.243 | 16,94 | 25,78 | 3.253.851 | 22.463.868 | |
| 2020-03-16 |
|
4 | CQP |
Cheniere Energy Partners, L.P.
Common Units |
P - Purchase | 8.640 | 745.045 | 1,17 | 26,96 | 232.898 | 20.083.284 | |
| 2020-03-16 |
|
4 | CQP |
Cheniere Energy Partners, L.P.
Common Units |
P - Purchase | 60.347 | 736.405 | 8,93 | 26,22 | 1.582.461 | 19.310.527 | |
| 2020-03-16 |
|
4 | CQP |
Cheniere Energy Partners, L.P.
Common Units |
P - Purchase | 202.919 | 676.058 | 42,89 | 26,33 | 5.342.066 | 17.797.971 | |
| 2020-03-16 |
|
4 | CQP |
Cheniere Energy Partners, L.P.
Common Units |
P - Purchase | 131.046 | 473.139 | 38,31 | 25,54 | 3.346.627 | 12.082.929 | |
| 2020-03-13 |
|
4 | GTES |
Gates Industrial Corp plc
Ordinary Shares |
P - Purchase | 3.325 | 1.799.208 | 0,19 | 8,39 | 27.897 | 15.095.355 | |
| 2020-03-13 |
|
4 | GTES |
Gates Industrial Corp plc
Ordinary Shares |
P - Purchase | 86.675 | 1.795.883 | 5,07 | 7,80 | 676.065 | 14.007.887 | |
| 2020-03-13 |
|
4 | GTES |
Gates Industrial Corp plc
Ordinary Shares |
P - Purchase | 90.000 | 1.709.208 | 5,56 | 8,17 | 735.300 | 13.964.229 | |
| 2020-03-13 |
|
4 | GTES |
Gates Industrial Corp plc
Ordinary Shares |
P - Purchase | 90.000 | 1.619.208 | 5,89 | 8,97 | 807.300 | 14.524.296 | |
| 2020-03-13 |
|
4 | VVNT |
Vivint Smart Home, Inc.
Class A Common Stock |
C - Conversion | 9.542.680 | 97.732.396 | 10,82 | ||||
| 2020-03-13 |
|
4 | VVNT |
Vivint Smart Home, Inc.
Earnout Rights |
C - Conversion | -9.542.472 | 9.542.472 | -50,00 | ||||
| 2020-03-12 |
|
4 | CQP |
Cheniere Energy Partners, L.P.
Common Units |
P - Purchase | 1.777 | 342.093 | 0,52 | 28,25 | 50.199 | 9.663.854 | |
| 2020-03-12 |
|
4 | CQP |
Cheniere Energy Partners, L.P.
Common Units |
P - Purchase | 12.554 | 340.316 | 3,83 | 27,47 | 344.902 | 9.349.672 | |
| 2020-03-12 |
|
4 | CQP |
Cheniere Energy Partners, L.P.
Common Units |
P - Purchase | 7.567 | 327.762 | 2,36 | 27,91 | 211.194 | 9.147.805 | |
| 2020-03-12 |
|
4 | CQP |
Cheniere Energy Partners, L.P.
Common Units |
P - Purchase | 1.281 | 320.195 | 0,40 | 26,67 | 34.168 | 8.540.593 | |
| 2020-03-12 |
|
4 | CQP |
Cheniere Energy Partners, L.P.
Common Units |
P - Purchase | 318.914 | 318.914 | 25,72 | 8.203.489 | 8.203.489 | ||
| 2020-03-10 |
|
4 | GTES |
Gates Industrial Corp plc
Ordinary Shares |
P - Purchase | 90.000 | 1.529.208 | 6,25 | 9,24 | 831.600 | 14.129.882 | |
| 2020-03-10 |
|
4 | GTES |
Gates Industrial Corp plc
Ordinary Shares |
P - Purchase | 85.000 | 1.439.208 | 6,28 | 9,05 | 769.250 | 13.024.832 | |
| 2020-03-10 |
|
4 | GTES |
Gates Industrial Corp plc
Ordinary Shares |
P - Purchase | 75.400 | 1.354.208 | 5,90 | 9,47 | 714.038 | 12.824.350 | |
| 2020-02-28 |
|
4 | VVNT |
Vivint Smart Home, Inc.
Earnout Rights |
C - Conversion | -9.538.597 | 19.077.194 | -33,33 | ||||
| 2020-02-28 |
|
4 | VVNT |
Vivint Smart Home, Inc.
Class A Common Stock |
C - Conversion | 9.538.597 | 88.189.716 | 12,13 | ||||
| 2020-02-24 | 3 | ATCX |
ATLAS TECHNICAL CONSULTANTS, INC.
Class A Common Stock |
4.400.000 | ||||||||
| 2020-02-24 | 3 | ATCX |
ATLAS TECHNICAL CONSULTANTS, INC.
Class A Common Stock |
4.400.000 | ||||||||
| 2020-02-24 | 3 | ATCX |
ATLAS TECHNICAL CONSULTANTS, INC.
Class A Common Stock |
4.400.000 | ||||||||
| 2020-02-24 | 3 | ATCX |
ATLAS TECHNICAL CONSULTANTS, INC.
Class A Common Stock |
4.400.000 | ||||||||
| 2020-02-24 | 3 | ATCX |
ATLAS TECHNICAL CONSULTANTS, INC.
Class A Common Stock |
4.400.000 | ||||||||
| 2020-02-24 | 3 | ATCX |
ATLAS TECHNICAL CONSULTANTS, INC.
Class A Common Stock |
4.400.000 | ||||||||
| 2020-02-24 | 3 | ATCX |
ATLAS TECHNICAL CONSULTANTS, INC.
Class A Common Stock |
4.400.000 | ||||||||
| 2020-02-24 | 3 | ATCX |
ATLAS TECHNICAL CONSULTANTS, INC.
Class A Common Stock |
4.400.000 | ||||||||
| 2020-02-24 | 3 | ATCX |
ATLAS TECHNICAL CONSULTANTS, INC.
Class A Common Stock |
4.400.000 | ||||||||
| 2020-02-24 | 3 | ATCX |
ATLAS TECHNICAL CONSULTANTS, INC.
Class A Common Stock |
4.400.000 | ||||||||
| 2020-02-03 |
|
4 | FG |
FGL Holdings
Ordinary Shares |
J - Other | 11.927 | 42.743 | 38,70 | ||||
| 2020-01-27 | 3 | VVNT |
Vivint Smart Home, Inc.
Class A Common Stock |
167.302.238 | ||||||||
| 2020-01-27 | 3 | VVNT |
Vivint Smart Home, Inc.
Class A Common Stock |
98.646.903 | ||||||||
| 2020-01-27 | 3 | VVNT |
Vivint Smart Home, Inc.
Class A Common Stock |
88.655.335 | ||||||||
| 2020-01-27 | 3 | VVNT |
Vivint Smart Home, Inc.
Class A Common Stock |
167.302.238 | ||||||||
| 2020-01-27 | 3 | VVNT |
Vivint Smart Home, Inc.
Class A Common Stock |
98.646.903 | ||||||||
| 2020-01-27 | 3 | VVNT |
Vivint Smart Home, Inc.
Class A Common Stock |
88.655.335 | ||||||||
| 2020-01-27 | 3 | VVNT |
Vivint Smart Home, Inc.
Class A Common Stock |
167.302.238 | ||||||||
| 2020-01-27 | 3 | VVNT |
Vivint Smart Home, Inc.
Class A Common Stock |
98.646.903 | ||||||||
| 2020-01-27 | 3 | VVNT |
Vivint Smart Home, Inc.
Class A Common Stock |
88.655.335 | ||||||||
| 2020-01-27 | 3 | VVNT |
Vivint Smart Home, Inc.
Class A Common Stock |
167.302.238 | ||||||||
| 2020-01-27 | 3 | VVNT |
Vivint Smart Home, Inc.
Class A Common Stock |
98.646.903 | ||||||||
| 2020-01-27 | 3 | VVNT |
Vivint Smart Home, Inc.
Class A Common Stock |
88.655.335 | ||||||||
| 2020-01-27 | 3 | VVNT |
Vivint Smart Home, Inc.
Class A Common Stock |
167.302.238 | ||||||||
| 2020-01-27 | 3 | VVNT |
Vivint Smart Home, Inc.
Class A Common Stock |
98.646.903 | ||||||||
| 2020-01-27 | 3 | VVNT |
Vivint Smart Home, Inc.
Class A Common Stock |
88.655.335 | ||||||||
| 2020-01-27 | 3 | VVNT |
Vivint Smart Home, Inc.
Class A Common Stock |
167.302.238 | ||||||||
| 2020-01-27 | 3 | VVNT |
Vivint Smart Home, Inc.
Class A Common Stock |
98.646.903 | ||||||||
| 2020-01-27 | 3 | VVNT |
Vivint Smart Home, Inc.
Class A Common Stock |
88.655.335 | ||||||||
| 2020-01-27 | 3 | VVNT |
Vivint Smart Home, Inc.
Class A Common Stock |
167.302.238 | ||||||||
| 2020-01-27 | 3 | VVNT |
Vivint Smart Home, Inc.
Class A Common Stock |
98.646.903 | ||||||||
| 2020-01-27 | 3 | VVNT |
Vivint Smart Home, Inc.
Class A Common Stock |
88.655.335 | ||||||||
| 2020-01-27 | 3 | VVNT |
Vivint Smart Home, Inc.
Class A Common Stock |
167.302.238 | ||||||||
| 2020-01-27 | 3 | VVNT |
Vivint Smart Home, Inc.
Class A Common Stock |
98.646.903 | ||||||||
| 2020-01-27 | 3 | VVNT |
Vivint Smart Home, Inc.
Class A Common Stock |
88.655.335 | ||||||||
| 2020-01-22 |
|
4 | VSLR |
Vivint Solar, Inc.
Common Stock |
J - Other | -4.739.817 | 69.619.557 | -6,37 | ||||
| 2019-12-04 |
|
4 | KODK |
EASTMAN KODAK CO
Common Stock |
S - Sale | -1.226.470 | 0 | -100,00 | 2,50 | -3.066.175 | ||
| 2019-12-04 |
|
4 | KODK |
EASTMAN KODAK CO
Common Stock |
S - Sale | -986.236 | 0 | -100,00 | 2,50 | -2.465.590 | ||
| 2019-12-04 |
|
4 | KODK |
EASTMAN KODAK CO
Common Stock |
S - Sale | -6.103.867 | 0 | -100,00 | 2,50 | -15.259.668 | ||
| 2019-12-04 |
|
4 | KODK |
EASTMAN KODAK CO
Common Stock |
S - Sale | -285.769 | 0 | -100,00 | 2,50 | -714.422 | ||
| 2019-12-04 |
|
4 | KODK |
EASTMAN KODAK CO
Common Stock |
S - Sale | -272.869 | 0 | -100,00 | 2,50 | -682.172 | ||
| 2019-11-27 |
|
4 | INVH |
Invitation Homes Inc.
Common Stock |
S - Sale | -4.720.172 | 29.651 | -99,38 | 30,05 | -141.841.169 | 891.013 | |
| 2019-11-27 |
|
4 | INVH |
Invitation Homes Inc.
Common Stock |
S - Sale | -3.984.790 | 33.223 | -99,17 | 30,05 | -119.742.940 | 998.351 | |
| 2019-11-27 |
|
4 | INVH |
Invitation Homes Inc.
Common Stock |
S - Sale | -5.212.503 | 39.106 | -99,26 | 30,05 | -156.635.715 | 1.175.135 | |
| 2019-11-27 |
|
4 | INVH |
Invitation Homes Inc.
Common Stock |
S - Sale | -8.888.562 | 20.353 | -99,77 | 30,05 | -267.101.288 | 611.608 | |
| 2019-11-27 |
|
4 | INVH |
Invitation Homes Inc.
Common Stock |
S - Sale | -2.251.159 | 21.051 | -99,07 | 30,05 | -67.647.328 | 632.583 | |
| 2019-11-27 |
|
4 | INVH |
Invitation Homes Inc.
Common Stock |
S - Sale | -11.494.129 | 0 | -100,00 | 30,05 | -345.398.576 | ||
| 2019-11-27 |
|
4 | INVH |
Invitation Homes Inc.
Common Stock |
S - Sale | -21.048.685 | 157.068 | -99,26 | 30,05 | -632.512.984 | 4.719.893 | |
| 2019-11-14 |
|
4 | GRTX |
Galera Therapeutics, Inc.
Series C Redeemable Convertible Preferred Stock |
C - Conversion | -561.385 | 0 | -100,00 | ||||
| 2019-11-14 |
|
4 | GRTX |
Galera Therapeutics, Inc.
Series C Redeemable Convertible Preferred Stock |
C - Conversion | -2.807.372 | 0 | -100,00 | ||||
| 2019-11-14 |
|
4 | GRTX |
Galera Therapeutics, Inc.
Series C Redeemable Convertible Preferred Stock |
C - Conversion | -1.552.035 | 0 | -100,00 | ||||
| 2019-11-14 |
|
4 | GRTX |
Galera Therapeutics, Inc.
Series C Redeemable Convertible Preferred Stock |
C - Conversion | -2.334.966 | 0 | -100,00 | ||||
| 2019-11-14 |
|
4 | GRTX |
Galera Therapeutics, Inc.
Common Stock |
P - Purchase | 19.423 | 130.444 | 17,49 | 12,00 | 233.076 | 1.565.328 | |
| 2019-11-14 |
|
4 | GRTX |
Galera Therapeutics, Inc.
Common Stock |
P - Purchase | 97.131 | 652.324 | 17,49 | 12,00 | 1.165.572 | 7.827.888 | |
| 2019-11-14 |
|
4 | GRTX |
Galera Therapeutics, Inc.
Common Stock |
P - Purchase | 52.660 | 353.661 | 17,49 | 12,00 | 631.920 | 4.243.932 | |
| 2019-11-14 |
|
4 | GRTX |
Galera Therapeutics, Inc.
Common Stock |
P - Purchase | 80.786 | 542.555 | 17,49 | 12,00 | 969.432 | 6.510.660 | |
| 2019-11-14 |
|
4 | GRTX |
Galera Therapeutics, Inc.
Common Stock |
C - Conversion | 111.021 | 111.021 | |||||
| 2019-11-14 |
|
4 | GRTX |
Galera Therapeutics, Inc.
Common Stock |
C - Conversion | 555.193 | 555.193 | |||||
| 2019-11-14 |
|
4 | GRTX |
Galera Therapeutics, Inc.
Common Stock |
C - Conversion | 301.001 | 301.001 | |||||
| 2019-11-14 |
|
4 | GRTX |
Galera Therapeutics, Inc.
Common Stock |
C - Conversion | 461.769 | 461.769 | |||||
| 2019-11-08 |
|
4 | GRTX |
Galera Therapeutics, Inc.
Stock Options (Right to Buy) |
J - Other | 19.776 | 0 | -100,00 | ||||
| 2019-11-04 |
|
4 | CROX |
Crocs, Inc.
Common Stock |
S - Sale | -2.479 | 0 | -100,00 | 35,54 | -88.104 | ||
| 2019-11-04 |
|
4 | CROX |
Crocs, Inc.
Common Stock |
S - Sale | -17.137 | 0 | -100,00 | 35,54 | -609.049 | ||
| 2019-11-04 |
|
4 | CROX |
Crocs, Inc.
Common Stock |
S - Sale | -6.844.929 | 0 | -100,00 | 35,54 | -243.268.777 | ||
| 2019-11-04 | 3 | CROX |
Crocs, Inc.
Common Stock |
13.709.474 | ||||||||
| 2019-11-04 | 3 | CROX |
Crocs, Inc.
Common Stock |
6.881.682 | ||||||||
| 2019-11-04 | 3 | CROX |
Crocs, Inc.
Common Stock |
6.867.024 | ||||||||
| 2019-11-04 | 3 | CROX |
Crocs, Inc.
Common Stock |
13.709.474 | ||||||||
| 2019-11-04 | 3 | CROX |
Crocs, Inc.
Common Stock |
6.881.682 | ||||||||
| 2019-11-04 | 3 | CROX |
Crocs, Inc.
Common Stock |
6.867.024 | ||||||||
| 2019-11-04 | 3 | CROX |
Crocs, Inc.
Common Stock |
13.709.474 | ||||||||
| 2019-11-04 | 3 | CROX |
Crocs, Inc.
Common Stock |
6.881.682 | ||||||||
| 2019-11-04 | 3 | CROX |
Crocs, Inc.
Common Stock |
6.867.024 | ||||||||
| 2019-11-04 | 3 | CROX |
Crocs, Inc.
Common Stock |
13.709.474 | ||||||||
| 2019-11-04 | 3 | CROX |
Crocs, Inc.
Common Stock |
6.881.682 | ||||||||
| 2019-11-04 | 3 | CROX |
Crocs, Inc.
Common Stock |
6.867.024 | ||||||||
| 2019-11-04 | 3 | CROX |
Crocs, Inc.
Common Stock |
13.709.474 | ||||||||
| 2019-11-04 | 3 | CROX |
Crocs, Inc.
Common Stock |
6.881.682 | ||||||||
| 2019-11-04 | 3 | CROX |
Crocs, Inc.
Common Stock |
6.867.024 | ||||||||
| 2019-11-04 | 3 | CROX |
Crocs, Inc.
Common Stock |
13.709.474 | ||||||||
| 2019-11-04 | 3 | CROX |
Crocs, Inc.
Common Stock |
6.881.682 | ||||||||
| 2019-11-04 | 3 | CROX |
Crocs, Inc.
Common Stock |
6.867.024 | ||||||||
| 2019-11-04 | 3 | CROX |
Crocs, Inc.
Common Stock |
13.709.474 | ||||||||
| 2019-11-04 | 3 | CROX |
Crocs, Inc.
Common Stock |
6.881.682 | ||||||||
| 2019-11-04 | 3 | CROX |
Crocs, Inc.
Common Stock |
6.867.024 | ||||||||
| 2019-11-04 | 3 | CROX |
Crocs, Inc.
Common Stock |
13.709.474 | ||||||||
| 2019-11-04 | 3 | CROX |
Crocs, Inc.
Common Stock |
6.881.682 | ||||||||
| 2019-11-04 | 3 | CROX |
Crocs, Inc.
Common Stock |
6.867.024 | ||||||||
| 2019-11-04 | 3 | CROX |
Crocs, Inc.
Common Stock |
13.709.474 | ||||||||
| 2019-11-04 | 3 | CROX |
Crocs, Inc.
Common Stock |
6.881.682 | ||||||||
| 2019-11-04 | 3 | CROX |
Crocs, Inc.
Common Stock |
6.867.024 | ||||||||
| 2019-11-04 | 3 | CROX |
Crocs, Inc.
Common Stock |
13.709.474 | ||||||||
| 2019-11-04 | 3 | CROX |
Crocs, Inc.
Common Stock |
6.881.682 | ||||||||
| 2019-11-04 | 3 | CROX |
Crocs, Inc.
Common Stock |
6.867.024 | ||||||||
| 2019-11-04 | 3 | CROX |
Crocs, Inc.
Common Stock |
13.709.474 | ||||||||
| 2019-11-04 | 3 | CROX |
Crocs, Inc.
Common Stock |
6.881.682 | ||||||||
| 2019-11-04 | 3 | CROX |
Crocs, Inc.
Common Stock |
6.867.024 | ||||||||
| 2019-11-04 | 3 | CROX |
Crocs, Inc.
Common Stock |
13.709.474 | ||||||||
| 2019-11-04 | 3 | CROX |
Crocs, Inc.
Common Stock |
6.881.682 | ||||||||
| 2019-11-04 | 3 | CROX |
Crocs, Inc.
Common Stock |
6.867.024 | ||||||||
| 2019-10-03 |
|
4 | TGE |
Tallgrass Energy, LP
TE units |
J - Other | 5.575.045 | 7.876.328 | 242,26 | ||||
| 2019-10-03 |
|
4 | TGE |
Tallgrass Energy, LP
TE units |
J - Other | -5.575.045 | 92.778.793 | -5,67 | ||||
| 2019-10-03 |
|
4 | TGE |
Tallgrass Energy, LP
Class B shares |
J - Other | 5.575.045 | 7.876.328 | 242,26 | ||||
| 2019-10-03 |
|
4 | TGE |
Tallgrass Energy, LP
Class B shares |
J - Other | -5.575.045 | 92.778.793 | -5,67 | ||||
| 2019-10-03 |
|
4 | TGE |
Tallgrass Energy, LP
Class A shares |
J - Other | -537 | 1.127.935 | -0,05 | ||||
| 2019-10-03 |
|
4 | TGE |
Tallgrass Energy, LP
Class A shares |
J - Other | -399 | 773.510 | -0,05 | ||||
| 2019-09-25 |
|
4 | INVH |
Invitation Homes Inc.
Common Stock |
S - Sale | -3.612.142 | 4.749.823 | -43,20 | 28,18 | -101.790.162 | 133.850.012 | |
| 2019-09-25 |
|
4 | INVH |
Invitation Homes Inc.
Common Stock |
S - Sale | -3.047.698 | 4.018.013 | -43,13 | 28,18 | -85.884.130 | 113.227.606 | |
| 2019-09-25 |
|
4 | INVH |
Invitation Homes Inc.
Common Stock |
S - Sale | -3.985.695 | 5.251.609 | -43,15 | 28,18 | -112.316.885 | 147.990.342 | |
| 2019-09-25 |
|
4 | INVH |
Invitation Homes Inc.
Common Stock |
S - Sale | -6.800.952 | 8.908.915 | -43,29 | 28,18 | -191.650.827 | 251.053.225 | |
| 2019-09-25 |
|
4 | INVH |
Invitation Homes Inc.
Common Stock |
S - Sale | -1.721.311 | 2.272.210 | -43,10 | 28,18 | -48.506.544 | 64.030.878 | |
| 2019-09-25 |
|
4 | INVH |
Invitation Homes Inc.
Common Stock |
S - Sale | -8.797.037 | 11.494.129 | -43,35 | 28,18 | -247.900.503 | 323.904.555 | |
| 2019-09-25 |
|
4 | INVH |
Invitation Homes Inc.
Common Stock |
S - Sale | -16.035.165 | 21.205.753 | -43,06 | 28,18 | -451.870.950 | 597.578.120 | |
| 2019-09-23 |
|
4 | NCR |
NCR CORP
Series A Convertible Preferred Stock |
C - Conversion | -239 | 0 | -100,00 | ||||
| 2019-09-23 |
|
4 | NCR |
NCR CORP
Series A Convertible Preferred Stock |
C - Conversion | -69.372 | 0 | -100,00 | ||||
| 2019-09-23 |
|
4 | NCR |
NCR CORP
Series A Convertible Preferred Stock |
C - Conversion | -404 | 0 | -100,00 | ||||
| 2019-09-23 |
|
4 | NCR |
NCR CORP
Series A Convertible Preferred Stock |
C - Conversion | -204.533 | 0 | -100,00 | ||||
| 2019-09-23 |
|
4 | NCR |
NCR CORP
Series A Convertible Preferred Stock |
S - Sale | -207 | 239 | -46,40 | ||||
| 2019-09-23 |
|
4 | NCR |
NCR CORP
Series A Convertible Preferred Stock |
S - Sale | -60.055 | 69.372 | -46,40 | ||||
| 2019-09-23 |
|
4 | NCR |
NCR CORP
Series A Convertible Preferred Stock |
S - Sale | -349 | 404 | -46,40 | ||||
| 2019-09-23 |
|
4 | NCR |
NCR CORP
Series A Convertible Preferred Stock |
S - Sale | -177.062 | 204.533 | -46,40 | ||||
| 2019-09-23 |
|
4 | NCR |
NCR CORP
Common Stock |
S - Sale | -7.968 | 0 | -100,00 | 32,75 | -260.952 | ||
| 2019-09-23 |
|
4 | NCR |
NCR CORP
Common Stock |
S - Sale | -2.312.643 | 0 | -100,00 | 32,75 | -75.739.058 | ||
| 2019-09-23 |
|
4 | NCR |
NCR CORP
Common Stock |
S - Sale | -13.409 | 0 | -100,00 | 32,75 | -439.145 | ||
| 2019-09-23 |
|
4 | NCR |
NCR CORP
Common Stock |
S - Sale | -6.795.946 | 0 | -100,00 | 32,75 | -222.567.232 | ||
| 2019-09-23 |
|
4 | NCR |
NCR CORP
Common Stock |
J - Other | -10 | 7.968 | -0,13 | ||||
| 2019-09-23 |
|
4 | NCR |
NCR CORP
Common Stock |
J - Other | -2.887 | 2.312.643 | -0,12 | ||||
| 2019-09-23 |
|
4 | NCR |
NCR CORP
Common Stock |
J - Other | -62 | 13.409 | -0,46 | ||||
| 2019-09-23 |
|
4 | NCR |
NCR CORP
Common Stock |
J - Other | -31.031 | 6.795.946 | -0,45 | ||||
| 2019-09-23 |
|
4 | NCR |
NCR CORP
Common Stock |
C - Conversion | 7.968 | 7.978 | 79.680,00 | ||||
| 2019-09-23 |
|
4 | NCR |
NCR CORP
Common Stock |
C - Conversion | 2.312.386 | 2.315.530 | 73.549,17 | ||||
| 2019-09-23 |
|
4 | NCR |
NCR CORP
Common Stock |
C - Conversion | 13.453 | 13.453 | |||||
| 2019-09-23 |
|
4 | NCR |
NCR CORP
Common Stock |
C - Conversion | 6.817.706 | 6.826.977 | 73.537,98 | ||||
| 2019-09-05 |
|
4 | FG |
FGL Holdings
Ordinary Shares |
P - Purchase | 78.266 | 16.620.850 | 0,47 | 7,93 | 620.649 | 131.803.340 | |
| 2019-08-30 |
|
4 | FG |
FGL Holdings
Ordinary Shares |
P - Purchase | 37.898 | 16.542.584 | 0,23 | 8,01 | 303.563 | 132.506.098 | |
| 2019-08-30 |
|
4 | FG |
FGL Holdings
Ordinary Shares |
P - Purchase | 45.043 | 16.504.686 | 0,27 | 8,03 | 361.695 | 132.532.629 | |
| 2019-08-30 |
|
4 | FG |
FGL Holdings
Ordinary Shares |
P - Purchase | 84.107 | 16.459.643 | 0,51 | 7,93 | 666.969 | 130.524.969 | |
| 2019-08-27 |
|
4 | FG |
FGL Holdings
Ordinary Shares |
P - Purchase | 103.585 | 16.375.536 | 0,64 | 7,93 | 821.429 | 129.858.000 | |
| 2019-08-27 |
|
4 | FG |
FGL Holdings
Ordinary Shares |
P - Purchase | 73.503 | 16.271.951 | 0,45 | 8,00 | 588.024 | 130.175.608 | |
| 2019-08-27 |
|
4 | FG |
FGL Holdings
Ordinary Shares |
P - Purchase | 112.065 | 16.198.448 | 0,70 | 7,92 | 887.555 | 128.291.708 | |
| 2019-08-22 |
|
4 | FG |
FGL Holdings
Ordinary Shares |
P - Purchase | 119.339 | 16.086.383 | 0,75 | 7,99 | 953.519 | 128.530.200 | |
| 2019-08-22 |
|
4 | FG |
FGL Holdings
Ordinary Shares |
P - Purchase | 76.432 | 15.967.044 | 0,48 | 7,80 | 596.170 | 124.542.943 | |
| 2019-08-22 |
|
4 | FG |
FGL Holdings
Ordinary Shares |
P - Purchase | 134.118 | 15.890.612 | 0,85 | 7,56 | 1.013.932 | 120.133.027 | |
| 2019-08-19 |
|
4 | FG |
FGL Holdings
Ordinary Shares |
P - Purchase | 77.743 | 15.756.494 | 0,50 | 7,80 | 606.395 | 122.900.653 | |
| 2019-08-19 |
|
4 | FG |
FGL Holdings
Ordinary Shares |
P - Purchase | 72.894 | 15.678.751 | 0,47 | 7,67 | 559.097 | 120.256.020 | |
| 2019-08-19 |
|
4 | FG |
FGL Holdings
Ordinary Shares |
P - Purchase | 91.977 | 15.605.857 | 0,59 | 7,34 | 675.111 | 114.546.990 | |
| 2019-08-14 |
|
4 | FG |
FGL Holdings
Ordinary Shares |
P - Purchase | 79.368 | 15.513.880 | 0,51 | 7,07 | 561.132 | 109.683.132 | |
| 2019-08-14 |
|
4 | FG |
FGL Holdings
Ordinary Shares |
P - Purchase | 57.712 | 15.434.512 | 0,38 | 7,34 | 423.606 | 113.289.318 | |
| 2019-08-14 |
|
4 | FG |
FGL Holdings
Ordinary Shares |
P - Purchase | 60.394 | 15.376.800 | 0,39 | 7,40 | 446.916 | 113.788.320 | |
| 2019-08-01 |
|
4 | TGE |
Tallgrass Energy, LP
TE units |
C - Conversion | -150.439 | 2.301.283 | -6,14 | ||||
| 2019-08-01 |
|
4 | TGE |
Tallgrass Energy, LP
TE units |
C - Conversion | -4.158.257 | 98.353.838 | -4,06 | ||||
| 2019-08-01 |
|
4 | TGE |
Tallgrass Energy, LP
Obligation to Transfer |
C - Conversion | -1 | 0 | -100,00 | ||||
| 2019-08-01 |
|
4 | TGE |
Tallgrass Energy, LP
Class B shares |
C - Conversion | -150.439 | 2.301.283 | -6,14 | ||||
| 2019-08-01 |
|
4 | TGE |
Tallgrass Energy, LP
Class B shares |
C - Conversion | -4.158.257 | 98.353.838 | -4,06 | ||||
| 2019-08-01 |
|
4 | TGE |
Tallgrass Energy, LP
Class A shares |
C - Conversion | -66.931 | 1.127.935 | -5,60 | ||||
| 2019-06-28 |
|
4 | INVH |
Invitation Homes Inc.
Common Stock |
S - Sale | -3.077.139 | 8.376.967 | -26,86 | 27,43 | -84.405.923 | 229.780.205 | |
| 2019-06-28 |
|
4 | INVH |
Invitation Homes Inc.
Common Stock |
S - Sale | -2.596.858 | 7.081.659 | -26,83 | 27,43 | -71.231.815 | 194.249.906 | |
| 2019-06-28 |
|
4 | INVH |
Invitation Homes Inc.
Common Stock |
S - Sale | -3.396.754 | 9.256.381 | -26,85 | 27,43 | -93.172.962 | 253.902.531 | |
| 2019-06-28 |
|
4 | INVH |
Invitation Homes Inc.
Common Stock |
S - Sale | -5.799.303 | 15.719.858 | -26,95 | 27,43 | -159.074.881 | 431.195.705 | |
| 2019-06-28 |
|
4 | INVH |
Invitation Homes Inc.
Common Stock |
S - Sale | -1.466.617 | 4.003.653 | -26,81 | 27,43 | -40.229.304 | 109.820.202 | |
| 2019-06-28 |
|
4 | INVH |
Invitation Homes Inc.
Common Stock |
S - Sale | -7.503.395 | 20.291.166 | -27,00 | 27,43 | -205.818.125 | 556.586.683 | |
| 2019-06-28 |
|
4 | INVH |
Invitation Homes Inc.
Common Stock |
S - Sale | -13.659.934 | 37.352.153 | -26,78 | 27,43 | -374.691.990 | 1.024.569.557 | |
| 2019-06-27 | 3 | CHNG |
Change Healthcare Inc.
Common Stock |
93.298.377 | ||||||||
| 2019-06-27 | 3 | CHNG |
Change Healthcare Inc.
Common Stock |
84.697.801 | ||||||||
| 2019-06-27 | 3 | CHNG |
Change Healthcare Inc.
Common Stock |
59.625.687 | ||||||||
| 2019-06-27 | 3 | CHNG |
Change Healthcare Inc.
Common Stock |
59.905.249 | ||||||||
| 2019-06-27 | 3 | CHNG |
Change Healthcare Inc.
Common Stock |
60.194.404 | ||||||||
| 2019-06-27 | 3 | CHNG |
Change Healthcare Inc.
Common Stock |
93.298.377 | ||||||||
| 2019-06-27 | 3 | CHNG |
Change Healthcare Inc.
Common Stock |
84.697.801 | ||||||||
| 2019-06-27 | 3 | CHNG |
Change Healthcare Inc.
Common Stock |
59.625.687 | ||||||||
| 2019-06-27 | 3 | CHNG |
Change Healthcare Inc.
Common Stock |
59.905.249 | ||||||||
| 2019-06-27 | 3 | CHNG |
Change Healthcare Inc.
Common Stock |
60.194.404 | ||||||||
| 2019-06-12 | 3/A | TGE |
Tallgrass Energy, LP
Class A shares |
21.751.018 | ||||||||
| 2019-06-12 | 3/A | TGE |
Tallgrass Energy, LP
Class B shares |
98.203.399 | ||||||||
| 2019-06-12 | 3/A | TGE |
Tallgrass Energy, LP
Class B shares |
2.451.722 | ||||||||
| 2019-06-11 | 3 | PACK |
Ranpak Holdings Corp.
Class A Common Stock |
8.416.500 | ||||||||
| 2019-06-11 | 3 | PACK |
Ranpak Holdings Corp.
Class A Common Stock |
5.158.500 | ||||||||
| 2019-06-11 | 3 | PACK |
Ranpak Holdings Corp.
Class A Common Stock |
8.416.500 | ||||||||
| 2019-06-11 | 3 | PACK |
Ranpak Holdings Corp.
Class A Common Stock |
5.158.500 | ||||||||
| 2019-06-11 | 3 | PACK |
Ranpak Holdings Corp.
Class A Common Stock |
8.416.500 | ||||||||
| 2019-06-11 | 3 | PACK |
Ranpak Holdings Corp.
Class A Common Stock |
5.158.500 | ||||||||
| 2019-06-11 | 3 | PACK |
Ranpak Holdings Corp.
Class A Common Stock |
8.416.500 | ||||||||
| 2019-06-11 | 3 | PACK |
Ranpak Holdings Corp.
Class A Common Stock |
5.158.500 | ||||||||
| 2019-06-11 | 3 | PACK |
Ranpak Holdings Corp.
Class A Common Stock |
8.416.500 | ||||||||
| 2019-06-11 | 3 | PACK |
Ranpak Holdings Corp.
Class A Common Stock |
5.158.500 | ||||||||
| 2019-06-11 | 3 | PACK |
Ranpak Holdings Corp.
Class A Common Stock |
8.416.500 | ||||||||
| 2019-06-11 | 3 | PACK |
Ranpak Holdings Corp.
Class A Common Stock |
5.158.500 | ||||||||
| 2019-06-11 | 3 | PACK |
Ranpak Holdings Corp.
Class A Common Stock |
8.416.500 | ||||||||
| 2019-06-11 | 3 | PACK |
Ranpak Holdings Corp.
Class A Common Stock |
5.158.500 | ||||||||
| 2019-06-11 | 3 | PACK |
Ranpak Holdings Corp.
Class A Common Stock |
8.416.500 | ||||||||
| 2019-06-11 | 3 | PACK |
Ranpak Holdings Corp.
Class A Common Stock |
5.158.500 | ||||||||
| 2019-06-11 | 3 | PACK |
Ranpak Holdings Corp.
Class A Common Stock |
8.416.500 | ||||||||
| 2019-06-11 | 3 | PACK |
Ranpak Holdings Corp.
Class A Common Stock |
5.158.500 | ||||||||
| 2019-06-11 | 3 | PACK |
Ranpak Holdings Corp.
Class A Common Stock |
8.416.500 | ||||||||
| 2019-06-11 | 3 | PACK |
Ranpak Holdings Corp.
Class A Common Stock |
5.158.500 | ||||||||
| 2019-06-11 | 3 | PACK |
Ranpak Holdings Corp.
Class A Common Stock |
8.416.500 | ||||||||
| 2019-06-11 | 3 | PACK |
Ranpak Holdings Corp.
Class A Common Stock |
5.158.500 | ||||||||
| 2019-06-11 | 3 | PACK |
Ranpak Holdings Corp.
Class A Common Stock |
8.416.500 | ||||||||
| 2019-06-11 | 3 | PACK |
Ranpak Holdings Corp.
Class A Common Stock |
5.158.500 | ||||||||
| 2019-06-05 |
|
4 | INVH |
Invitation Homes Inc.
Common Stock |
S - Sale | -3.288.249 | 11.467.109 | -22,29 | 25,21 | -82.896.757 | 289.085.818 | |
| 2019-06-05 |
|
4 | INVH |
Invitation Homes Inc.
Common Stock |
S - Sale | -2.771.535 | 9.706.094 | -22,21 | 25,21 | -69.870.397 | 244.690.630 | |
| 2019-06-05 |
|
4 | INVH |
Invitation Homes Inc.
Common Stock |
S - Sale | -3.624.083 | 12.688.693 | -22,22 | 25,21 | -91.363.132 | 319.881.951 | |
| 2019-06-05 |
|
4 | INVH |
Invitation Homes Inc.
Common Stock |
S - Sale | -6.185.782 | 21.537.132 | -22,31 | 25,21 | -155.943.564 | 542.951.098 | |
| 2019-06-05 |
|
4 | INVH |
Invitation Homes Inc.
Common Stock |
S - Sale | -1.565.920 | 5.489.547 | -22,19 | 25,21 | -39.476.843 | 138.391.480 | |
| 2019-06-05 |
|
4 | INVH |
Invitation Homes Inc.
Common Stock |
S - Sale | -8.001.642 | 27.794.561 | -22,35 | 25,21 | -201.721.395 | 700.700.883 | |
| 2019-06-05 |
|
4 | INVH |
Invitation Homes Inc.
Common Stock |
S - Sale | -14.562.789 | 51.262.213 | -22,12 | 25,21 | -367.127.911 | 1.292.320.390 | |
| 2019-05-10 |
|
4 | TGE |
Tallgrass Energy, LP
Class A Shares |
P - Purchase | X | 71.184 | 1.127.935 | 6,74 | 24,22 | 1.724.076 | 27.318.586 |
| 2019-05-10 |
|
4 | TGE |
Tallgrass Energy, LP
Class A Shares |
P - Purchase | X | 48.816 | 773.510 | 6,74 | 24,22 | 1.182.324 | 18.734.412 |
| 2019-05-07 |
|
4 | TGE |
Tallgrass Energy, LP
Class A Shares |
P - Purchase | X | 43.007 | 1.056.751 | 4,24 | 24,27 | 1.043.780 | 25.647.347 |
| 2019-05-07 |
|
4 | TGE |
Tallgrass Energy, LP
Class A Shares |
P - Purchase | X | 29.493 | 724.694 | 4,24 | 24,27 | 715.795 | 17.588.323 |
| 2019-05-07 |
|
4 | TGE |
Tallgrass Energy, LP
Class A Shares |
P - Purchase | X | 39.151 | 1.013.744 | 4,02 | 24,15 | 945.497 | 24.481.918 |
| 2019-05-07 |
|
4 | TGE |
Tallgrass Energy, LP
Class A Shares |
P - Purchase | X | 26.849 | 695.201 | 4,02 | 24,15 | 648.403 | 16.789.104 |
| 2019-05-07 |
|
4 | TGE |
Tallgrass Energy, LP
Class A Shares |
P - Purchase | X | 50.659 | 974.593 | 5,48 | 23,96 | 1.213.790 | 23.351.248 |
| 2019-05-07 |
|
4 | TGE |
Tallgrass Energy, LP
Class A Shares |
P - Purchase | X | 34.741 | 668.352 | 5,48 | 23,96 | 832.394 | 16.013.714 |
| 2019-05-02 |
|
4 | TGE |
Tallgrass Energy, LP
Class A Shares |
P - Purchase | X | 86.014 | 923.934 | 10,27 | 23,77 | 2.044.553 | 21.961.911 |
| 2019-05-02 |
|
4 | TGE |
Tallgrass Energy, LP
Class A Shares |
P - Purchase | X | 58.986 | 633.611 | 10,27 | 23,77 | 1.402.097 | 15.060.933 |
| 2019-05-02 |
|
4 | TGE |
Tallgrass Energy, LP
Class A Shares |
P - Purchase | X | 71.396 | 837.920 | 9,31 | 23,92 | 1.707.792 | 20.043.046 |
| 2019-05-02 |
|
4 | TGE |
Tallgrass Energy, LP
Class A Shares |
P - Purchase | X | 48.962 | 574.625 | 9,31 | 23,92 | 1.171.171 | 13.745.030 |
| 2019-05-02 |
|
4 | TGE |
Tallgrass Energy, LP
Class A Shares |
P - Purchase | X | 65.252 | 766.524 | 9,30 | 24,15 | 1.575.836 | 18.511.555 |
| 2019-05-02 |
|
4 | TGE |
Tallgrass Energy, LP
Class A Shares |
P - Purchase | X | 44.748 | 525.663 | 9,30 | 24,15 | 1.080.664 | 12.694.761 |
| 2019-04-29 |
|
4 | TGE |
Tallgrass Energy, LP
Class A Shares |
P - Purchase | X | 65.845 | 701.272 | 10,36 | 24,20 | 1.593.449 | 16.970.782 |
| 2019-04-29 |
|
4 | TGE |
Tallgrass Energy, LP
Class A Shares |
P - Purchase | X | 45.155 | 480.915 | 10,36 | 24,20 | 1.092.751 | 11.638.143 |
| 2019-04-29 |
|
4 | TGE |
Tallgrass Energy, LP
Class A Shares |
P - Purchase | X | 89.039 | 635.427 | 16,30 | 24,47 | 2.178.784 | 15.548.899 |
| 2019-04-29 |
|
4 | TGE |
Tallgrass Energy, LP
Class A Shares |
P - Purchase | X | 61.061 | 435.760 | 16,30 | 24,47 | 1.494.163 | 10.663.047 |
| 2019-04-29 |
|
4 | TGE |
Tallgrass Energy, LP
Class A Shares |
P - Purchase | X | 42.177 | 546.388 | 8,36 | 24,45 | 1.031.228 | 13.359.187 |
| 2019-04-29 |
|
4 | TGE |
Tallgrass Energy, LP
Class A Shares |
P - Purchase | X | 28.923 | 374.699 | 8,36 | 24,45 | 707.167 | 9.161.391 |
| 2019-04-24 |
|
4 | TGE |
Tallgrass Energy, LP
Class A Shares |
P - Purchase | X | 18.326 | 504.211 | 3,77 | 24,49 | 448.804 | 12.348.127 |
| 2019-04-24 |
|
4 | TGE |
Tallgrass Energy, LP
Class A Shares |
P - Purchase | X | 12.568 | 345.776 | 3,77 | 24,49 | 307.790 | 8.468.054 |
| 2019-04-24 |
|
4 | TGE |
Tallgrass Energy, LP
Class A Shares |
P - Purchase | X | 7.750 | 485.885 | 1,62 | 24,49 | 189.798 | 11.899.324 |
| 2019-04-24 |
|
4 | TGE |
Tallgrass Energy, LP
Class A Shares |
P - Purchase | X | 5.314 | 333.208 | 1,62 | 24,49 | 130.140 | 8.160.264 |
| 2019-04-24 |
|
4 | TGE |
Tallgrass Energy, LP
Class A Shares |
P - Purchase | X | 237 | 478.135 | 0,05 | 24,49 | 5.804 | 11.709.526 |
| 2019-04-24 |
|
4 | TGE |
Tallgrass Energy, LP
Class A Shares |
P - Purchase | X | 163 | 327.894 | 0,05 | 24,49 | 3.992 | 8.030.124 |
| 2019-04-19 |
|
4 | TGE |
Tallgrass Energy, LP
Class A Shares |
P - Purchase | X | 75.692 | 477.898 | 18,82 | 24,40 | 1.846.885 | 11.660.711 |
| 2019-04-19 |
|
4 | TGE |
Tallgrass Energy, LP
Class A Shares |
P - Purchase | X | 51.908 | 327.731 | 18,82 | 24,40 | 1.266.555 | 7.996.636 |
| 2019-04-19 |
|
4 | TGE |
Tallgrass Energy, LP
Class A Shares |
P - Purchase | X | 1.614 | 402.206 | 0,40 | 24,49 | 39.527 | 9.850.025 |
| 2019-04-19 |
|
4 | TGE |
Tallgrass Energy, LP
Class A Shares |
P - Purchase | X | 1.106 | 275.823 | 0,40 | 24,49 | 27.086 | 6.754.905 |
| 2019-04-19 |
|
4 | FG |
FGL Holdings
Ordinary Shares |
J - Other | 18.328 | 30.816 | 146,76 | ||||
| 2019-04-11 |
|
4 | TGE |
Tallgrass Energy, LP
Class A Shares |
P - Purchase | X | 15.911 | 400.592 | 4,14 | 24,50 | 389.820 | 9.814.504 |
| 2019-04-11 |
|
4 | TGE |
Tallgrass Energy, LP
Class A Shares |
P - Purchase | X | 10.912 | 274.717 | 4,14 | 24,50 | 267.344 | 6.730.566 |
| 2019-04-11 |
|
4 | TGE |
Tallgrass Energy, LP
Class A Shares |
P - Purchase | X | 3.802 | 384.681 | 1,00 | 24,49 | 93.111 | 9.420.838 |
| 2019-04-11 |
|
4 | TGE |
Tallgrass Energy, LP
Class A Shares |
P - Purchase | X | 2.608 | 263.805 | 1,00 | 24,49 | 63.870 | 6.460.584 |
| 2019-04-11 |
|
4 | TGE |
Tallgrass Energy, LP
Class A Shares |
P - Purchase | X | 27.466 | 380.879 | 7,77 | 24,48 | 672.368 | 9.323.918 |
| 2019-04-11 |
|
4 | TGE |
Tallgrass Energy, LP
Class A Shares |
P - Purchase | X | 18.835 | 261.197 | 7,77 | 24,48 | 461.081 | 6.394.103 |
| 2019-03-29 |
|
4 | TGE |
Tallgrass Energy, LP
Class A Shares |
P - Purchase | 183.294 | 353.413 | 107,74 | 23,76 | 4.355.065 | 8.397.093 | |
| 2019-03-29 |
|
4 | TGE |
Tallgrass Energy, LP
Class A Shares |
P - Purchase | 125.698 | 242.362 | 107,74 | 23,76 | 2.986.584 | 5.758.521 | |
| 2019-03-27 |
|
4 | INVH |
Invitation Homes Inc.
Common Stock |
S - Sale | -3.293.385 | 14.755.358 | -18,25 | 23,22 | -76.472.400 | 342.619.413 | |
| 2019-03-27 |
|
4 | INVH |
Invitation Homes Inc.
Common Stock |
S - Sale | -2.773.242 | 12.477.629 | -18,18 | 23,22 | -64.394.679 | 289.730.545 | |
| 2019-03-27 |
|
4 | INVH |
Invitation Homes Inc.
Common Stock |
S - Sale | -3.625.333 | 16.312.776 | -18,18 | 23,22 | -84.180.232 | 378.782.659 | |
| 2019-03-27 |
|
4 | INVH |
Invitation Homes Inc.
Common Stock |
S - Sale | -6.185.794 | 27.722.914 | -18,24 | 23,22 | -143.634.137 | 643.726.063 | |
| 2019-03-27 |
|
4 | INVH |
Invitation Homes Inc.
Common Stock |
S - Sale | -1.564.279 | 7.055.467 | -18,15 | 23,22 | -36.322.558 | 163.827.944 | |
| 2019-03-27 |
|
4 | INVH |
Invitation Homes Inc.
Common Stock |
S - Sale | -8.000.928 | 35.796.203 | -18,27 | 23,22 | -185.781.548 | 831.187.834 | |
| 2019-03-27 |
|
4 | INVH |
Invitation Homes Inc.
Common Stock |
S - Sale | -14.557.039 | 65.825.002 | -18,11 | 23,22 | -338.014.446 | 1.528.456.546 | |
| 2019-03-27 |
|
4 | TGE |
Tallgrass Energy, LP
Class A Shares |
P - Purchase | X | 415 | 170.119 | 0,24 | 24,50 | 10.168 | 4.167.916 |
| 2019-03-27 |
|
4 | TGE |
Tallgrass Energy, LP
Class A Shares |
P - Purchase | X | 285 | 116.664 | 0,24 | 24,50 | 6.982 | 2.858.268 |
| 2019-03-22 |
|
4 | NSTG |
NanoString Technologies Inc
Common Stock |
S - Sale | -2.000.000 | 2.036.025 | -49,55 | 21,62 | -43.240.000 | 44.018.860 | |
| 2019-03-21 |
|
4 | TGE |
Tallgrass Energy, LP
Class A Shares |
P - Purchase | X | 939 | 167.704 | 0,56 | 24,49 | 22.996 | 4.107.071 |
| 2019-03-21 |
|
4 | TGE |
Tallgrass Energy, LP
Class A Shares |
P - Purchase | X | 644 | 116.379 | 0,56 | 24,49 | 15.772 | 2.850.122 |
| 2019-03-18 | 3 | TGE |
Tallgrass Energy, LP
Class A shares |
144.157.157 | ||||||||
| 2019-03-18 | 3 | TGE |
Tallgrass Energy, LP
Class B shares |
220.473.321 | ||||||||
| 2019-03-18 | 3 | TGE |
Tallgrass Energy, LP
Class B shares |
124.994.078 | ||||||||
| 2019-03-18 | 3 | TGE |
Tallgrass Energy, LP
Class A shares |
144.157.157 | ||||||||
| 2019-03-18 | 3 | TGE |
Tallgrass Energy, LP
Class B shares |
220.473.321 | ||||||||
| 2019-03-18 | 3 | TGE |
Tallgrass Energy, LP
Class B shares |
124.994.078 | ||||||||
| 2019-03-18 | 3 | TGE |
Tallgrass Energy, LP
Class A shares |
144.157.157 | ||||||||
| 2019-03-18 | 3 | TGE |
Tallgrass Energy, LP
Class B shares |
220.473.321 | ||||||||
| 2019-03-18 | 3 | TGE |
Tallgrass Energy, LP
Class B shares |
124.994.078 | ||||||||
| 2019-03-18 | 3 | TGE |
Tallgrass Energy, LP
Class A shares |
144.157.157 | ||||||||
| 2019-03-18 | 3 | TGE |
Tallgrass Energy, LP
Class B shares |
220.473.321 | ||||||||
| 2019-03-18 | 3 | TGE |
Tallgrass Energy, LP
Class B shares |
124.994.078 | ||||||||
| 2019-03-18 | 3 | TGE |
Tallgrass Energy, LP
Class A shares |
144.157.157 | ||||||||
| 2019-03-18 | 3 | TGE |
Tallgrass Energy, LP
Class B shares |
220.473.321 | ||||||||
| 2019-03-18 | 3 | TGE |
Tallgrass Energy, LP
Class B shares |
124.994.078 | ||||||||
| 2019-03-18 | 3 | TGE |
Tallgrass Energy, LP
Class A shares |
144.157.157 | ||||||||
| 2019-03-18 | 3 | TGE |
Tallgrass Energy, LP
Class B shares |
220.473.321 | ||||||||
| 2019-03-18 | 3 | TGE |
Tallgrass Energy, LP
Class B shares |
124.994.078 | ||||||||
| 2019-03-18 | 3 | TGE |
Tallgrass Energy, LP
Class A shares |
144.157.157 | ||||||||
| 2019-03-18 | 3 | TGE |
Tallgrass Energy, LP
Class B shares |
220.473.321 | ||||||||
| 2019-03-18 | 3 | TGE |
Tallgrass Energy, LP
Class B shares |
124.994.078 | ||||||||
| 2019-03-18 | 3 | TGE |
Tallgrass Energy, LP
Class A shares |
144.157.157 | ||||||||
| 2019-03-18 | 3 | TGE |
Tallgrass Energy, LP
Class B shares |
220.473.321 | ||||||||
| 2019-03-18 | 3 | TGE |
Tallgrass Energy, LP
Class B shares |
124.994.078 | ||||||||
| 2019-03-18 |
|
4 | TGE |
Tallgrass Energy, LP
Class A Shares |
P - Purchase | X | 44.490 | 168.765 | 35,80 | 24,16 | 1.074.878 | 4.077.362 |
| 2019-03-18 |
|
4 | TGE |
Tallgrass Energy, LP
Class A Shares |
P - Purchase | X | 30.510 | 115.735 | 35,80 | 24,16 | 737.122 | 2.796.158 |
| 2019-03-18 |
|
4 | TGE |
Tallgrass Energy, LP
Class A Shares |
P - Purchase | X | 59.320 | 124.275 | 91,32 | 24,14 | 1.431.985 | 2.999.998 |
| 2019-03-18 |
|
4 | TGE |
Tallgrass Energy, LP
Class A Shares |
P - Purchase | X | 40.680 | 85.225 | 91,32 | 24,14 | 982.015 | 2.057.332 |
| 2019-03-18 |
|
4 | TGE |
Tallgrass Energy, LP
Class A Shares |
P - Purchase | X | 64.955 | 64.955 | 23,95 | 1.555.672 | 1.555.672 | |
| 2019-03-18 |
|
4 | TGE |
Tallgrass Energy, LP
Class A Shares |
P - Purchase | X | 44.545 | 44.545 | 23,95 | 1.066.853 | 1.066.853 | |
| 2019-03-01 |
|
4 | KOS |
Kosmos Energy Ltd.
Common Shares |
S - Sale | -61.149 | 74.078 | -45,22 | 6,51 | -398.080 | 482.248 | |
| 2019-03-01 |
|
4 | KOS |
Kosmos Energy Ltd.
Common Shares |
S - Sale | -450.353 | 545.566 | -45,22 | 6,51 | -2.931.798 | 3.551.635 | |
| 2019-03-01 |
|
4 | KOS |
Kosmos Energy Ltd.
Common Shares |
S - Sale | -542.401 | 657.075 | -45,22 | 6,51 | -3.531.031 | 4.277.558 | |
| 2019-03-01 |
|
4 | KOS |
Kosmos Energy Ltd.
Common Shares |
S - Sale | -344.132 | 416.888 | -45,22 | 6,51 | -2.240.299 | 2.713.941 | |
| 2019-03-01 |
|
4 | KOS |
Kosmos Energy Ltd.
Common Shares |
S - Sale | -21.101.965 | 25.563.334 | -45,22 | 6,51 | -137.373.792 | 166.417.304 | |
| 2019-01-15 | 3 | NSTG |
NanoString Technologies Inc
Common Stock |
8.072.050 | ||||||||
| 2019-01-15 | 3 | NSTG |
NanoString Technologies Inc
Common Stock |
8.072.050 | ||||||||
| 2019-01-15 | 3 | NSTG |
NanoString Technologies Inc
Common Stock |
8.072.050 | ||||||||
| 2019-01-15 | 3 | NSTG |
NanoString Technologies Inc
Common Stock |
8.072.050 | ||||||||
| 2019-01-15 | 3 | NSTG |
NanoString Technologies Inc
Common Stock |
8.072.050 | ||||||||
| 2019-01-15 | 3 | NSTG |
NanoString Technologies Inc
Common Stock |
8.072.050 | ||||||||
| 2019-01-15 | 3 | NSTG |
NanoString Technologies Inc
Common Stock |
8.072.050 | ||||||||
| 2019-01-15 | 3 | NSTG |
NanoString Technologies Inc
Common Stock |
8.072.050 | ||||||||
| 2019-01-15 | 3 | FTSV |
Forty Seven, Inc.
Common Stock |
7.633.902 | ||||||||
| 2019-01-15 | 3 | FTSV |
Forty Seven, Inc.
Common Stock |
7.633.902 | ||||||||
| 2019-01-15 | 3 | FTSV |
Forty Seven, Inc.
Common Stock |
7.633.902 | ||||||||
| 2019-01-15 | 3 | FTSV |
Forty Seven, Inc.
Common Stock |
7.633.902 | ||||||||
| 2019-01-15 | 3 | FTSV |
Forty Seven, Inc.
Common Stock |
7.633.902 | ||||||||
| 2019-01-15 | 3 | FTSV |
Forty Seven, Inc.
Common Stock |
7.633.902 | ||||||||
| 2019-01-15 | 3 | FTSV |
Forty Seven, Inc.
Common Stock |
7.633.902 | ||||||||
| 2019-01-15 | 3 | FTSV |
Forty Seven, Inc.
Common Stock |
7.633.902 | ||||||||
| 2019-01-15 | 3 | ETTX |
Entasis Therapeutics Holdings Inc.
Common Stock |
3.246.810 | ||||||||
| 2019-01-15 | 3 | ETTX |
Entasis Therapeutics Holdings Inc.
Common Stock |
3.246.810 | ||||||||
| 2019-01-15 | 3 | ETTX |
Entasis Therapeutics Holdings Inc.
Common Stock |
3.246.810 | ||||||||
| 2019-01-15 | 3 | ETTX |
Entasis Therapeutics Holdings Inc.
Common Stock |
3.246.810 | ||||||||
| 2019-01-15 | 3 | ETTX |
Entasis Therapeutics Holdings Inc.
Common Stock |
3.246.810 | ||||||||
| 2019-01-15 | 3 | ETTX |
Entasis Therapeutics Holdings Inc.
Common Stock |
3.246.810 | ||||||||
| 2019-01-15 | 3 | ETTX |
Entasis Therapeutics Holdings Inc.
Common Stock |
3.246.810 | ||||||||
| 2019-01-15 | 3 | ETTX |
Entasis Therapeutics Holdings Inc.
Common Stock |
3.246.810 | ||||||||
| 2019-01-15 | 3 | AVRO |
AVROBIO, Inc.
Common Stock |
5.924.650 | ||||||||
| 2019-01-15 | 3 | AVRO |
AVROBIO, Inc.
Common Stock |
5.924.650 | ||||||||
| 2019-01-15 | 3 | AVRO |
AVROBIO, Inc.
Common Stock |
5.924.650 | ||||||||
| 2019-01-15 | 3 | AVRO |
AVROBIO, Inc.
Common Stock |
5.924.650 | ||||||||
| 2019-01-15 | 3 | AVRO |
AVROBIO, Inc.
Common Stock |
5.924.650 | ||||||||
| 2019-01-15 | 3 | AVRO |
AVROBIO, Inc.
Common Stock |
5.924.650 | ||||||||
| 2019-01-15 | 3 | AVRO |
AVROBIO, Inc.
Common Stock |
5.924.650 | ||||||||
| 2019-01-15 | 3 | AVRO |
AVROBIO, Inc.
Common Stock |
5.924.650 | ||||||||
| 2018-12-06 |
|
4 | VSLR |
Vivint Solar, Inc.
Common Stock |
S - Sale | -8.000.000 | 74.359.374 | -9,71 | 5,20 | -41.580.000 | 386.482.846 | |
| 2018-12-04 |
|
4 | CROX |
Crocs, Inc.
Series A Convertible Preferred Stock |
C - Conversion | -248 | 0 | -100,00 | ||||
| 2018-12-04 |
|
4 | CROX |
Crocs, Inc.
Series A Convertible Preferred Stock |
S - Sale | -248 | 248 | -50,00 | ||||
| 2018-12-04 |
|
4 | CROX |
Crocs, Inc.
Series A Convertible Preferred Stock |
C - Conversion | -99.252 | 0 | -100,00 | ||||
| 2018-12-04 |
|
4 | CROX |
Crocs, Inc.
Series A Convertible Preferred Stock |
S - Sale | -99.252 | 99.252 | -50,00 | ||||
| 2018-12-04 |
|
4 | CROX |
Crocs, Inc.
Common Stock |
C - Conversion | 17.137 | 17.137 | 14,50 | 248.486 | 248.486 | ||
| 2018-12-04 |
|
4 | CROX |
Crocs, Inc.
Common Stock |
C - Conversion | 6.844.929 | 6.844.929 | 14,50 | 99.251.470 | 99.251.470 | ||
| 2018-11-26 |
|
4 | EARN |
Ellington Residential Mortgage REIT
Common Stock |
P - Purchase | 4.421 | 3.103.257 | 0,14 | 11,06 | 48.896 | 34.322.022 | |
| 2018-11-26 |
|
4 | EARN |
Ellington Residential Mortgage REIT
Common Stock |
P - Purchase | 5.810 | 3.098.836 | 0,19 | 11,04 | 64.142 | 34.211.149 | |
| 2018-11-20 |
|
4 | EARN |
Ellington Residential Mortgage REIT
Common Stock |
P - Purchase | 45.126 | 3.093.026 | 1,48 | 10,90 | 491.873 | 33.713.983 | |
| 2018-11-20 |
|
4 | EARN |
Ellington Residential Mortgage REIT
Common Stock |
P - Purchase | 6.399 | 3.047.900 | 0,21 | 10,92 | 69.877 | 33.283.068 | |
| 2018-11-20 |
|
4 | EARN |
Ellington Residential Mortgage REIT
Common Stock |
P - Purchase | 9.760 | 3.041.501 | 0,32 | 10,88 | 106.189 | 33.091.531 | |
| 2018-11-15 |
|
4 | EARN |
Ellington Residential Mortgage REIT
Common Stock |
P - Purchase | 4.001 | 3.031.741 | 0,13 | 10,78 | 43.131 | 32.682.168 | |
| 2018-11-15 |
|
4 | EARN |
Ellington Residential Mortgage REIT
Common Stock |
P - Purchase | 14.911 | 3.027.740 | 0,49 | 10,84 | 161.635 | 32.820.702 | |
| 2018-11-15 |
|
4 | EARN |
Ellington Residential Mortgage REIT
Common Stock |
P - Purchase | 7.000 | 3.012.829 | 0,23 | 10,79 | 75.530 | 32.508.425 | |
| 2018-11-14 |
|
4 | NONE |
Blackstone / GSO Secured Lending Fund
Common Shares of Beneficial Interest |
P - Purchase | 192.000 | 192.060 | 320.000,00 | 25,00 | 4.800.000 | 4.801.500 | |
| 2018-11-08 | 3 | DFBG |
Centric Brands Inc.
Common Stock |
35.578.250 | ||||||||
| 2018-11-08 | 3 | DFBG |
Centric Brands Inc.
Common Stock |
34.529.402 | ||||||||
| 2018-11-08 | 3 | DFBG |
Centric Brands Inc.
Common Stock |
27.021.680 | ||||||||
| 2018-11-08 | 3 | DFBG |
Centric Brands Inc.
Common Stock |
26.353.198 | ||||||||
| 2018-11-08 | 3 | DFBG |
Centric Brands Inc.
Common Stock |
26.332.475 | ||||||||
| 2018-11-08 | 3 | DFBG |
Centric Brands Inc.
Common Stock |
33.664.975 | ||||||||
| 2018-11-08 | 3 | DFBG |
Centric Brands Inc.
Common Stock |
26.276.028 | ||||||||
| 2018-11-08 | 3 | DFBG |
Centric Brands Inc.
Common Stock |
35.578.250 | ||||||||
| 2018-11-08 | 3 | DFBG |
Centric Brands Inc.
Common Stock |
34.529.402 | ||||||||
| 2018-11-08 | 3 | DFBG |
Centric Brands Inc.
Common Stock |
27.021.680 | ||||||||
| 2018-11-08 | 3 | DFBG |
Centric Brands Inc.
Common Stock |
26.353.198 | ||||||||
| 2018-11-08 | 3 | DFBG |
Centric Brands Inc.
Common Stock |
26.332.475 | ||||||||
| 2018-11-08 | 3 | DFBG |
Centric Brands Inc.
Common Stock |
33.664.975 | ||||||||
| 2018-11-08 | 3 | DFBG |
Centric Brands Inc.
Common Stock |
26.276.028 | ||||||||
| 2018-10-09 |
|
4 | FG |
FGL Holdings
Warrants |
S - Sale | -6.250.000 | 0 | -100,00 | ||||
| 2018-10-09 |
|
4 | FG |
FGL Holdings
Ordinary Shares |
P - Purchase | 687.500 | 15.316.406 | 4,70 | ||||
| 2018-10-01 | 3 | NONE |
Blackstone / GSO Secured Lending Fund
Common Shares of Beneficial Interest |
120 | ||||||||
| 2018-10-01 | 3 | NONE |
Blackstone / GSO Secured Lending Fund
Common Shares of Beneficial Interest |
120 | ||||||||
| 2018-10-01 | 3 | NONE |
Blackstone / GSO Secured Lending Fund
Common Shares of Beneficial Interest |
120 | ||||||||
| 2018-10-01 | 3 | NONE |
Blackstone / GSO Secured Lending Fund
Common Shares of Beneficial Interest |
120 | ||||||||
| 2018-10-01 | 3 | NONE |
Blackstone / GSO Secured Lending Fund
Common Shares of Beneficial Interest |
120 | ||||||||
| 2018-10-01 | 3 | NONE |
Blackstone / GSO Secured Lending Fund
Common Shares of Beneficial Interest |
120 | ||||||||
| 2018-10-01 | 3 | NONE |
Blackstone / GSO Secured Lending Fund
Common Shares of Beneficial Interest |
120 | ||||||||
| 2018-10-01 | 3 | NONE |
Blackstone / GSO Secured Lending Fund
Common Shares of Beneficial Interest |
120 | ||||||||
| 2018-10-01 | 3 | NONE |
Blackstone / GSO Secured Lending Fund
Common Shares of Beneficial Interest |
120 | ||||||||
| 2018-10-01 | 3 | NONE |
Blackstone / GSO Secured Lending Fund
Common Shares of Beneficial Interest |
120 | ||||||||
| 2018-09-21 |
|
4 | KOS |
Kosmos Energy Ltd.
Common Shares |
S - Sale | 8.956 | 135.227 | 7,09 | 8,94 | 80.067 | 1.208.929 | |
| 2018-09-21 |
|
4 | KOS |
Kosmos Energy Ltd.
Common Shares |
S - Sale | -65.963 | 995.919 | -6,21 | 8,94 | -589.709 | 8.903.516 | |
| 2018-09-21 |
|
4 | KOS |
Kosmos Energy Ltd.
Common Shares |
S - Sale | -79.445 | 1.199.476 | -6,21 | 8,94 | -710.238 | 10.723.315 | |
| 2018-09-21 |
|
4 | KOS |
Kosmos Energy Ltd.
Common Shares |
S - Sale | -50.405 | 761.020 | -6,21 | 8,94 | -450.621 | 6.803.519 | |
| 2018-09-21 |
|
4 | KOS |
Kosmos Energy Ltd.
Common Shares |
S - Sale | -3.090.802 | 46.665.299 | -6,21 | 8,94 | -27.631.770 | 417.187.773 | |
| 2018-09-04 | 3 | FLMN |
Falcon Minerals Corp
Class C Common Stock |
110.395.286 | ||||||||
| 2018-09-04 | 3 | FLMN |
Falcon Minerals Corp
Class C Common Stock |
110.395.286 | ||||||||
| 2018-09-04 | 3 | FLMN |
Falcon Minerals Corp
Class C Common Stock |
110.395.286 | ||||||||
| 2018-09-04 | 3 | FLMN |
Falcon Minerals Corp
Class C Common Stock |
110.395.286 | ||||||||
| 2018-09-04 | 3 | FLMN |
Falcon Minerals Corp
Class C Common Stock |
110.395.286 | ||||||||
| 2018-09-04 | 3 | FLMN |
Falcon Minerals Corp
Class C Common Stock |
110.395.286 | ||||||||
| 2018-09-04 | 3 | FLMN |
Falcon Minerals Corp
Class C Common Stock |
110.395.286 | ||||||||
| 2018-08-22 |
|
4 | EARN |
Ellington Residential Mortgage REIT
Common Stock |
P - Purchase | 7.603 | 3.005.829 | 0,25 | 11,67 | 88.727 | 35.078.024 | |
| 2018-08-17 |
|
4 | EARN |
Ellington Residential Mortgage REIT
Common Stock |
P - Purchase | 1.297 | 2.998.226 | 0,04 | 11,50 | 14.916 | 34.479.599 | |
| 2018-08-17 |
|
4 | EARN |
Ellington Residential Mortgage REIT
Common Stock |
P - Purchase | 17.799 | 2.996.929 | 0,60 | 11,44 | 203.621 | 34.284.868 | |
| 2018-08-17 |
|
4 | EARN |
Ellington Residential Mortgage REIT
Common Stock |
P - Purchase | 14.725 | 2.979.130 | 0,50 | 11,34 | 166.982 | 33.783.334 | |
| 2018-08-14 |
|
4 | EARN |
Ellington Residential Mortgage REIT
Common Stock |
P - Purchase | 12.724 | 2.964.405 | 0,43 | 11,25 | 143.145 | 33.349.556 | |
| 2018-08-14 |
|
4 | EARN |
Ellington Residential Mortgage REIT
Common Stock |
P - Purchase | 16.468 | 2.951.681 | 0,56 | 11,23 | 184.936 | 33.147.378 | |
| 2018-08-14 |
|
4 | EARN |
Ellington Residential Mortgage REIT
Common Stock |
P - Purchase | 10.690 | 2.935.213 | 0,37 | 11,21 | 119.835 | 32.903.738 | |
| 2018-06-11 | 3 | CPLG |
CorePoint Lodging Inc.
Common Stock |
24.356.193 | ||||||||
| 2018-06-11 | 3 | CPLG |
CorePoint Lodging Inc.
Common Stock |
18.518.710 | ||||||||
| 2018-06-11 | 3 | CPLG |
CorePoint Lodging Inc.
Common Stock |
18.112.974 | ||||||||
| 2018-06-11 | 3 | CPLG |
CorePoint Lodging Inc.
Common Stock |
17.763.585 | ||||||||
| 2018-06-11 | 3 | CPLG |
CorePoint Lodging Inc.
Common Stock |
17.658.169 | ||||||||
| 2018-06-11 | 3 | CPLG |
CorePoint Lodging Inc.
Common Stock |
17.777.289 | ||||||||
| 2018-06-11 | 3 | CPLG |
CorePoint Lodging Inc.
Common Stock |
17.848.556 | ||||||||
| 2018-06-11 | 3 | CPLG |
CorePoint Lodging Inc.
Common Stock |
17.890.616 | ||||||||
| 2018-06-11 | 3 | CPLG |
CorePoint Lodging Inc.
Common Stock |
17.675.700 | ||||||||
| 2018-06-11 | 3 | CPLG |
CorePoint Lodging Inc.
Common Stock |
20.632.210 | ||||||||
| 2018-06-11 | 3 | CPLG |
CorePoint Lodging Inc.
Common Stock |
18.357.065 | ||||||||
| 2018-06-11 | 3 | CPLG |
CorePoint Lodging Inc.
Common Stock |
18.683.373 | ||||||||
| 2018-06-11 | 3 | CPLG |
CorePoint Lodging Inc.
Common Stock |
20.404.503 | ||||||||
| 2018-06-11 | 3 | CPLG |
CorePoint Lodging Inc.
Common Stock |
17.674.829 | ||||||||
| 2018-06-11 | 3 | CPLG |
CorePoint Lodging Inc.
Common Stock |
18.030.836 | ||||||||
| 2018-06-11 | 3 | CPLG |
CorePoint Lodging Inc.
Common Stock |
24.356.193 | ||||||||
| 2018-06-11 | 3 | CPLG |
CorePoint Lodging Inc.
Common Stock |
18.518.710 | ||||||||
| 2018-06-11 | 3 | CPLG |
CorePoint Lodging Inc.
Common Stock |
18.112.974 | ||||||||
| 2018-06-11 | 3 | CPLG |
CorePoint Lodging Inc.
Common Stock |
17.763.585 | ||||||||
| 2018-06-11 | 3 | CPLG |
CorePoint Lodging Inc.
Common Stock |
17.658.169 | ||||||||
| 2018-06-11 | 3 | CPLG |
CorePoint Lodging Inc.
Common Stock |
17.777.289 | ||||||||
| 2018-06-11 | 3 | CPLG |
CorePoint Lodging Inc.
Common Stock |
17.848.556 | ||||||||
| 2018-06-11 | 3 | CPLG |
CorePoint Lodging Inc.
Common Stock |
17.890.616 | ||||||||
| 2018-06-11 | 3 | CPLG |
CorePoint Lodging Inc.
Common Stock |
17.675.700 | ||||||||
| 2018-06-11 | 3 | CPLG |
CorePoint Lodging Inc.
Common Stock |
20.632.210 | ||||||||
| 2018-06-11 | 3 | CPLG |
CorePoint Lodging Inc.
Common Stock |
18.357.065 | ||||||||
| 2018-06-11 | 3 | CPLG |
CorePoint Lodging Inc.
Common Stock |
18.683.373 | ||||||||
| 2018-06-11 | 3 | CPLG |
CorePoint Lodging Inc.
Common Stock |
20.404.503 | ||||||||
| 2018-06-11 | 3 | CPLG |
CorePoint Lodging Inc.
Common Stock |
17.674.829 | ||||||||
| 2018-06-11 | 3 | CPLG |
CorePoint Lodging Inc.
Common Stock |
18.030.836 | ||||||||
| 2018-06-01 |
|
4 | EARN |
Ellington Residential Mortgage REIT
Common Stock |
P - Purchase | 6.939 | 2.924.523 | 0,24 | 11,47 | 79.590 | 33.544.279 | |
| 2018-06-01 |
|
4 | EARN |
Ellington Residential Mortgage REIT
Common Stock |
P - Purchase | 7.905 | 2.917.584 | 0,27 | 11,59 | 91.619 | 33.814.799 | |
| 2018-06-01 |
|
4 | EARN |
Ellington Residential Mortgage REIT
Common Stock |
P - Purchase | 4.600 | 2.909.679 | 0,16 | 11,61 | 53.406 | 33.781.373 | |
| 2018-06-01 |
|
4 | LQ |
La Quinta Holdings Inc.
Common Stock |
J - Other | -444.298 | 0 | -100,00 | 16,80 | -7.464.206 | ||
| 2018-06-01 |
|
4 | LQ |
La Quinta Holdings Inc.
Common Stock |
J - Other | -88.291 | 0 | -100,00 | 16,80 | -1.483.289 | ||
| 2018-06-01 |
|
4 | LQ |
La Quinta Holdings Inc.
Common Stock |
J - Other | -2.817.965 | 0 | -100,00 | 16,80 | -47.341.812 | ||
| 2018-06-01 |
|
4 | LQ |
La Quinta Holdings Inc.
Common Stock |
J - Other | -1.096.835 | 0 | -100,00 | 16,80 | -18.426.828 | ||
| 2018-06-01 |
|
4 | LQ |
La Quinta Holdings Inc.
Common Stock |
J - Other | -770.527 | 0 | -100,00 | 16,80 | -12.944.854 | ||
| 2018-06-01 |
|
4 | LQ |
La Quinta Holdings Inc.
Common Stock |
J - Other | -3.045.672 | 0 | -100,00 | 16,80 | -51.167.290 | ||
| 2018-06-01 |
|
4 | LQ |
La Quinta Holdings Inc.
Common Stock |
J - Other | -89.162 | 0 | -100,00 | 16,80 | -1.497.922 | ||
| 2018-06-01 |
|
4 | LQ |
La Quinta Holdings Inc.
Common Stock |
J - Other | -304.078 | 0 | -100,00 | 16,80 | -5.108.510 | ||
| 2018-06-01 |
|
4 | LQ |
La Quinta Holdings Inc.
Common Stock |
J - Other | -262.018 | 0 | -100,00 | 16,80 | -4.401.902 | ||
| 2018-06-01 |
|
4 | LQ |
La Quinta Holdings Inc.
Common Stock |
J - Other | -190.751 | 0 | -100,00 | 16,80 | -3.204.617 | ||
| 2018-06-01 |
|
4 | LQ |
La Quinta Holdings Inc.
Common Stock |
J - Other | -71.631 | 0 | -100,00 | 16,80 | -1.203.401 | ||
| 2018-06-01 |
|
4 | LQ |
La Quinta Holdings Inc.
Common Stock |
J - Other | -177.047 | 0 | -100,00 | 16,80 | -2.974.390 | ||
| 2018-06-01 |
|
4 | LQ |
La Quinta Holdings Inc.
Common Stock |
J - Other | -526.436 | 0 | -100,00 | 16,80 | -8.844.125 | ||
| 2018-06-01 |
|
4 | LQ |
La Quinta Holdings Inc.
Common Stock |
J - Other | -932.172 | 0 | -100,00 | 16,80 | -15.660.490 | ||
| 2018-06-01 |
|
4 | LQ |
La Quinta Holdings Inc.
Common Stock |
J - Other | -6.769.655 | 0 | -100,00 | 16,80 | -113.730.204 | ||
| 2018-05-29 |
|
4 | EARN |
Ellington Residential Mortgage REIT
Common Stock |
P - Purchase | 4.830 | 2.905.079 | 0,17 | 11,56 | 55.835 | 33.582.713 | |
| 2018-05-29 |
|
4 | EARN |
Ellington Residential Mortgage REIT
Common Stock |
P - Purchase | 10.811 | 2.900.249 | 0,37 | 11,52 | 124.543 | 33.410.868 | |
| 2018-05-29 |
|
4 | EARN |
Ellington Residential Mortgage REIT
Common Stock |
P - Purchase | 11.515 | 2.889.438 | 0,40 | 11,42 | 131.501 | 32.997.382 | |
| 2018-05-23 |
|
4 | EARN |
Ellington Residential Mortgage REIT
Common Stock |
P - Purchase | 7.254 | 2.877.923 | 0,25 | 11,47 | 83.203 | 33.009.777 | |
| 2018-05-23 |
|
4 | EARN |
Ellington Residential Mortgage REIT
Common Stock |
P - Purchase | 8.616 | 2.870.669 | 0,30 | 11,30 | 97.361 | 32.438.560 | |
| 2018-05-23 |
|
4 | EARN |
Ellington Residential Mortgage REIT
Common Stock |
P - Purchase | 14.132 | 2.862.053 | 0,50 | 11,25 | 158.985 | 32.198.096 | |
| 2018-05-18 |
|
4 | EARN |
Ellington Residential Mortgage REIT
Common Stock |
P - Purchase | 8.820 | 2.847.921 | 0,31 | 11,15 | 98.343 | 31.754.319 | |
| 2018-05-18 |
|
4 | EARN |
Ellington Residential Mortgage REIT
Common Stock |
P - Purchase | 8.100 | 2.839.101 | 0,29 | 11,17 | 90.477 | 31.712.758 | |
| 2018-05-18 |
|
4 | EARN |
Ellington Residential Mortgage REIT
Common Stock |
P - Purchase | 15.494 | 2.831.001 | 0,55 | 11,21 | 173.688 | 31.735.521 | |
| 2018-05-15 |
|
4 | EARN |
Ellington Residential Mortgage REIT
Common Stock |
P - Purchase | 9.600 | 2.815.507 | 0,34 | 11,24 | 107.904 | 31.646.299 | |
| 2018-05-15 |
|
4 | EARN |
Ellington Residential Mortgage REIT
Common Stock |
P - Purchase | 11.909 | 2.805.907 | 0,43 | 11,26 | 134.095 | 31.594.513 | |
| 2018-05-15 |
|
4 | EARN |
Ellington Residential Mortgage REIT
Common Stock |
P - Purchase | 19.475 | 2.793.998 | 0,70 | 11,11 | 216.367 | 31.041.318 | |
| 2018-05-14 |
|
4 | HCC |
WARRIOR MET COAL, INC.
Common Stock |
S - Sale | -296.669 | 642.881 | -31,58 | 24,20 | -7.179.390 | 15.557.720 | |
| 2018-05-14 |
|
4 | HCC |
WARRIOR MET COAL, INC.
Common Stock |
S - Sale | -167.405 | 362.766 | -31,58 | 24,20 | -4.051.201 | 8.778.937 | |
| 2018-05-14 |
|
4 | HCC |
WARRIOR MET COAL, INC.
Common Stock |
S - Sale | -17.097 | 37.050 | -31,58 | 24,20 | -413.747 | 896.610 | |
| 2018-05-14 |
|
4 | HCC |
WARRIOR MET COAL, INC.
Common Stock |
S - Sale | -48.711 | 105.558 | -31,58 | 24,20 | -1.178.806 | 2.554.504 | |
| 2018-05-14 |
|
4 | HCC |
WARRIOR MET COAL, INC.
Common Stock |
S - Sale | -126.800 | 274.775 | -31,58 | 24,20 | -3.068.560 | 6.649.555 | |
| 2018-05-14 |
|
4 | HCC |
WARRIOR MET COAL, INC.
Common Stock |
S - Sale | -111.564 | 241.761 | -31,58 | 24,20 | -2.699.849 | 5.850.616 | |
| 2018-05-14 |
|
4 | HCC |
WARRIOR MET COAL, INC.
Common Stock |
S - Sale | -60.369 | 130.821 | -31,58 | 24,20 | -1.460.930 | 3.165.868 | |
| 2018-05-14 |
|
4 | HCC |
WARRIOR MET COAL, INC.
Common Stock |
S - Sale | -53.348 | 115.606 | -31,58 | 24,20 | -1.291.022 | 2.797.665 | |
| 2018-05-14 |
|
4 | HCC |
WARRIOR MET COAL, INC.
Common Stock |
S - Sale | -462.967 | 1.003.247 | -31,58 | 24,20 | -11.203.801 | 24.278.577 | |
| 2018-05-14 |
|
4 | HCC |
WARRIOR MET COAL, INC.
Common Stock |
S - Sale | -524.749 | 1.137.128 | -31,58 | 24,20 | -12.698.926 | 27.518.498 | |
| 2018-04-05 |
|
4 | FG |
FGL Holdings
Ordinary Shares |
J - Other | 12.488 | 12.488 | |||||
| 2018-03-19 |
|
4 | EARN |
Ellington Residential Mortgage REIT
Common Stock |
P - Purchase | 2.700 | 2.774.523 | 0,10 | 11,43 | 30.861 | 31.712.798 | |
| 2018-03-19 |
|
4 | EARN |
Ellington Residential Mortgage REIT
Common Stock |
P - Purchase | 11.278 | 2.771.823 | 0,41 | 11,42 | 128.795 | 31.654.219 | |
| 2018-03-13 |
|
4 | EARN |
Ellington Residential Mortgage REIT
Common Stock |
P - Purchase | 7.841 | 2.760.545 | 0,28 | 11,43 | 89.623 | 31.553.029 | |
| 2018-03-13 |
|
4 | EARN |
Ellington Residential Mortgage REIT
Common Stock |
P - Purchase | 20.536 | 2.752.704 | 0,75 | 11,20 | 230.003 | 30.830.285 | |
| 2018-03-08 |
|
4 | EARN |
Ellington Residential Mortgage REIT
Common Stock |
P - Purchase | 10.855 | 2.732.168 | 0,40 | 11,01 | 119.514 | 30.081.170 | |
| 2018-03-08 |
|
4 | EARN |
Ellington Residential Mortgage REIT
Common Stock |
P - Purchase | 13.609 | 2.721.313 | 0,50 | 10,90 | 148.338 | 29.662.312 | |
| 2018-03-08 |
|
4 | EARN |
Ellington Residential Mortgage REIT
Common Stock |
P - Purchase | 18.002 | 2.707.704 | 0,67 | 10,81 | 194.602 | 29.270.280 | |
| 2018-01-31 | 3 | OMAD |
One Madison Corp
Class A Ordinary Shares |
7.965.000 | ||||||||
| 2018-01-31 | 3 | OMAD |
One Madison Corp
Class A Ordinary Shares |
5.085.000 | ||||||||
| 2018-01-31 | 3 | OMAD |
One Madison Corp
Class B Ordinary Shares |
4.976.500 | ||||||||
| 2018-01-31 | 3 | OMAD |
One Madison Corp
Class B Ordinary Shares |
4.598.500 | ||||||||
| 2018-01-31 | 3 | OMAD |
One Madison Corp
Class A Ordinary Shares |
7.965.000 | ||||||||
| 2018-01-31 | 3 | OMAD |
One Madison Corp
Class A Ordinary Shares |
5.085.000 | ||||||||
| 2018-01-31 | 3 | OMAD |
One Madison Corp
Class B Ordinary Shares |
4.976.500 | ||||||||
| 2018-01-31 | 3 | OMAD |
One Madison Corp
Class B Ordinary Shares |
4.598.500 | ||||||||
| 2018-01-25 | 3 | GTES |
Gates Industrial Corp plc
Ordinary Shares |
356.201.859 | ||||||||
| 2018-01-25 | 3 | GTES |
Gates Industrial Corp plc
Ordinary Shares |
352.494.850 | ||||||||
| 2018-01-25 | 3 | GTES |
Gates Industrial Corp plc
Ordinary Shares |
244.356.923 | ||||||||
| 2018-01-25 | 3 | GTES |
Gates Industrial Corp plc
Ordinary Shares |
266.873.283 | ||||||||
| 2018-01-25 | 3 | GTES |
Gates Industrial Corp plc
Ordinary Shares |
356.201.859 | ||||||||
| 2018-01-25 | 3 | GTES |
Gates Industrial Corp plc
Ordinary Shares |
352.494.850 | ||||||||
| 2018-01-25 | 3 | GTES |
Gates Industrial Corp plc
Ordinary Shares |
244.356.923 | ||||||||
| 2018-01-25 | 3 | GTES |
Gates Industrial Corp plc
Ordinary Shares |
266.873.283 | ||||||||
| 2018-01-02 |
|
4 | CQP |
Cheniere Energy Partners, L.P.
Common Units |
P - Purchase | 231.288 | 2.011.447 | 12,99 | 29,49 | 6.820.197 | 59.313.348 | |
| 2018-01-02 |
|
4 | CQP |
Cheniere Energy Partners, L.P.
Common Units |
P - Purchase | 228.535 | 1.780.159 | 14,73 | 29,63 | 6.772.543 | 52.754.300 | |
| 2018-01-02 | 3 | BGFLX |
Blackstone / GSO Floating Rate Enhanced Income Fund
Class I Common Shares |
8.000 | ||||||||
| 2018-01-02 | 3 | BGFLX |
Blackstone / GSO Floating Rate Enhanced Income Fund
Class I Common Shares |
8.000 | ||||||||
| 2018-01-02 | 3 | BGFLX |
Blackstone / GSO Floating Rate Enhanced Income Fund
Class I Common Shares |
8.000 | ||||||||
| 2018-01-02 | 3 | BGFLX |
Blackstone / GSO Floating Rate Enhanced Income Fund
Class I Common Shares |
8.000 | ||||||||
| 2018-01-02 | 3 | BGFLX |
Blackstone / GSO Floating Rate Enhanced Income Fund
Class I Common Shares |
8.000 | ||||||||
| 2018-01-02 | 3 | BGFLX |
Blackstone / GSO Floating Rate Enhanced Income Fund
Class I Common Shares |
8.000 | ||||||||
| 2018-01-02 | 3 | BGFLX |
Blackstone / GSO Floating Rate Enhanced Income Fund
Class I Common Shares |
8.000 | ||||||||
| 2018-01-02 | 3 | BGFLX |
Blackstone / GSO Floating Rate Enhanced Income Fund
Class I Common Shares |
8.000 | ||||||||
| 2018-01-02 | 3 | BGFLX |
Blackstone / GSO Floating Rate Enhanced Income Fund
Class I Common Shares |
8.000 | ||||||||
| 2018-01-02 | 3 | BGFLX |
Blackstone / GSO Floating Rate Enhanced Income Fund
Class I Common Shares |
8.000 | ||||||||
| 2018-01-02 | 3 | BGFLX |
Blackstone / GSO Floating Rate Enhanced Income Fund
Class I Common Shares |
8.000 | ||||||||
| 2017-12-28 |
|
4 | CQP |
Cheniere Energy Partners, L.P.
Common Units |
P - Purchase | 308.766 | 1.551.624 | 24,84 | 29,09 | 8.982.898 | 45.141.242 | |
| 2017-12-28 |
|
4 | CQP |
Cheniere Energy Partners, L.P.
Common Units |
P - Purchase | 25.466 | 1.242.858 | 2,09 | 28,61 | 728.679 | 35.562.890 | |
| 2017-12-26 |
|
4 | CQP |
Cheniere Energy Partners, L.P.
Common Units |
P - Purchase | 73.247 | 1.217.392 | 6,40 | 28,04 | 2.054.190 | 34.141.393 | |
| 2017-12-26 |
|
4 | CQP |
Cheniere Energy Partners, L.P.
Common Units |
P - Purchase | 42.976 | 1.144.145 | 3,90 | 27,85 | 1.196.933 | 31.865.811 | |
| 2017-12-11 |
|
4 | UAN |
CVR PARTNERS, LP
Common Units representing Limited Partner Interests |
S - Sale | -153.184 | 1.459.328 | -9,50 | 3,00 | -459.567 | 4.378.130 | |
| 2017-12-11 |
|
4 | UAN |
CVR PARTNERS, LP
Common Units representing Limited Partner Interests |
S - Sale | -85.424 | 153.909 | -35,69 | 3,00 | -256.281 | 461.742 | |
| 2017-12-11 |
|
4 | UAN |
CVR PARTNERS, LP
Common Units representing Limited Partner Interests |
S - Sale | -219.886 | 396.173 | -35,69 | 3,00 | -659.680 | 1.188.559 | |
| 2017-12-11 |
|
4 | UAN |
CVR PARTNERS, LP
Common Units representing Limited Partner Interests |
S - Sale | -85.485 | 154.021 | -35,69 | 3,00 | -256.464 | 462.078 | |
| 2017-12-11 |
|
4 | UAN |
CVR PARTNERS, LP
Common Units representing Limited Partner Interests |
S - Sale | -619.729 | 1.387.647 | -30,87 | 3,00 | -1.859.249 | 4.163.080 | |
| 2017-12-11 |
|
4 | UAN |
CVR PARTNERS, LP
Common Units representing Limited Partner Interests |
S - Sale | -736.292 | 1.055.521 | -41,09 | 3,00 | -2.208.950 | 3.166.669 | |
| 2017-12-11 | 3 | FG |
FGL Holdings
Ordinary Shares |
57.895.812 | ||||||||
| 2017-12-11 | 3 | FG |
FGL Holdings
Ordinary Shares |
65.766.906 | ||||||||
| 2017-12-11 | 3 | FG |
FGL Holdings
Ordinary Shares |
43.409.017 | ||||||||
| 2017-12-11 | 3 | FG |
FGL Holdings
Ordinary Shares |
47.414.208 | ||||||||
| 2017-12-11 | 3 | FG |
FGL Holdings
Ordinary Shares |
44.709.024 | ||||||||
| 2017-12-11 | 3 | FG |
FGL Holdings
Ordinary Shares |
43.317.818 | ||||||||
| 2017-12-11 | 3 | FG |
FGL Holdings
Ordinary Shares |
43.431.985 | ||||||||
| 2017-12-11 | 3 | FG |
FGL Holdings
Ordinary Shares |
43.319.447 | ||||||||
| 2017-12-11 | 3 | FG |
FGL Holdings
Ordinary Shares |
43.380.827 | ||||||||
| 2017-12-11 | 3 | FG |
FGL Holdings
Ordinary Shares |
43.290.922 | ||||||||
| 2017-12-11 | 3 | FG |
FGL Holdings
Ordinary Shares |
57.895.812 | ||||||||
| 2017-12-11 | 3 | FG |
FGL Holdings
Ordinary Shares |
65.766.906 | ||||||||
| 2017-12-11 | 3 | FG |
FGL Holdings
Ordinary Shares |
43.409.017 | ||||||||
| 2017-12-11 | 3 | FG |
FGL Holdings
Ordinary Shares |
47.414.208 | ||||||||
| 2017-12-11 | 3 | FG |
FGL Holdings
Ordinary Shares |
44.709.024 | ||||||||
| 2017-12-11 | 3 | FG |
FGL Holdings
Ordinary Shares |
43.317.818 | ||||||||
| 2017-12-11 | 3 | FG |
FGL Holdings
Ordinary Shares |
43.431.985 | ||||||||
| 2017-12-11 | 3 | FG |
FGL Holdings
Ordinary Shares |
43.319.447 | ||||||||
| 2017-12-11 | 3 | FG |
FGL Holdings
Ordinary Shares |
43.380.827 | ||||||||
| 2017-12-11 | 3 | FG |
FGL Holdings
Ordinary Shares |
43.290.922 | ||||||||
| 2017-12-04 | 3 | UAN |
CVR PARTNERS, LP
Common Units representing Limited Partner Interests |
13.727.774 | ||||||||
| 2017-12-04 | 3 | UAN |
CVR PARTNERS, LP
Common Units representing Limited Partner Interests |
13.351.048 | ||||||||
| 2017-12-04 | 3 | UAN |
CVR PARTNERS, LP
Common Units representing Limited Partner Interests |
13.351.221 | ||||||||
| 2017-12-04 | 3 | UAN |
CVR PARTNERS, LP
Common Units representing Limited Partner Interests |
16.086.871 | ||||||||
| 2017-12-04 | 3 | UAN |
CVR PARTNERS, LP
Common Units representing Limited Partner Interests |
14.724.227 | ||||||||
| 2017-12-04 | 3 | UAN |
CVR PARTNERS, LP
Common Units representing Limited Partner Interests |
16.741.675 | ||||||||
| 2017-12-04 | 3 | UAN |
CVR PARTNERS, LP
Common Units representing Limited Partner Interests |
14.903.528 | ||||||||
| 2017-12-04 | 3 | UAN |
CVR PARTNERS, LP
Common Units representing Limited Partner Interests |
15.119.091 | ||||||||
| 2017-12-04 | 3 | UAN |
CVR PARTNERS, LP
Common Units representing Limited Partner Interests |
13.727.774 | ||||||||
| 2017-12-04 | 3 | UAN |
CVR PARTNERS, LP
Common Units representing Limited Partner Interests |
13.351.048 | ||||||||
| 2017-12-04 | 3 | UAN |
CVR PARTNERS, LP
Common Units representing Limited Partner Interests |
13.351.221 | ||||||||
| 2017-12-04 | 3 | UAN |
CVR PARTNERS, LP
Common Units representing Limited Partner Interests |
16.086.871 | ||||||||
| 2017-12-04 | 3 | UAN |
CVR PARTNERS, LP
Common Units representing Limited Partner Interests |
14.724.227 | ||||||||
| 2017-12-04 | 3 | UAN |
CVR PARTNERS, LP
Common Units representing Limited Partner Interests |
16.741.675 | ||||||||
| 2017-12-04 | 3 | UAN |
CVR PARTNERS, LP
Common Units representing Limited Partner Interests |
14.903.528 | ||||||||
| 2017-12-04 | 3 | UAN |
CVR PARTNERS, LP
Common Units representing Limited Partner Interests |
15.119.091 | ||||||||
| 2017-10-26 | 3 | HESM |
Hess Midstream Partners LP
Common Units |
0 | ||||||||
| 2017-10-26 | 3 | WLKP |
Westlake Chemical Partners LP
Common Units |
0 | ||||||||
| 2017-10-06 |
|
4 | HLT |
Hilton Worldwide Holdings Inc.
Common Stock |
S - Sale | -8.161 | 8.904 | -47,82 | 69,10 | -563.966 | 615.311 | |
| 2017-10-06 |
|
4 | HLT |
Hilton Worldwide Holdings Inc.
Common Stock |
S - Sale | -1.374.572 | 1.499.970 | -47,82 | 69,10 | -94.989.798 | 103.655.427 | |
| 2017-10-06 |
|
4 | HLT |
Hilton Worldwide Holdings Inc.
Common Stock |
S - Sale | -2.849 | 3.109 | -47,82 | 69,10 | -196.880 | 214.847 | |
| 2017-10-06 |
|
4 | HLT |
Hilton Worldwide Holdings Inc.
Common Stock |
S - Sale | -48.420 | 52.837 | -47,82 | 69,10 | -3.346.064 | 3.651.301 | |
| 2017-10-06 |
|
4 | HLT |
Hilton Worldwide Holdings Inc.
Common Stock |
S - Sale | -471.954 | 522.485 | -47,46 | 69,10 | -32.614.381 | 36.106.326 | |
| 2017-10-06 |
|
4 | HLT |
Hilton Worldwide Holdings Inc.
Common Stock |
S - Sale | -13.690.219 | 15.177.198 | -47,42 | 69,10 | -946.062.584 | 1.048.820.268 | |
| 2017-09-11 |
|
4 | CJES |
C&J Energy Services, Inc.
Common Stock |
S - Sale | -1.500.000 | 5.020.635 | -23,00 | 27,11 | -40.665.000 | 136.109.415 | |
| 2017-08-04 |
|
4 | CQP |
Cheniere Energy Partners, L.P.
Class B Units |
C - Conversion | -100.000.000 | 0 | -100,00 | ||||
| 2017-08-04 |
|
4 | CQP |
Cheniere Energy Partners, L.P.
Common Units |
C - Conversion | 198.978.886 | 198.978.886 | |||||
| 2017-07-31 | 3 | CQP |
Cheniere Energy Partners, L.P.
Common Units |
4.572.970 | ||||||||
| 2017-07-31 | 3 | CQP |
Cheniere Energy Partners, L.P.
Common Units |
4.425.656 | ||||||||
| 2017-07-31 | 3 | CQP |
Cheniere Energy Partners, L.P.
Common Units |
4.425.656 | ||||||||
| 2017-07-31 | 3 | CQP |
Cheniere Energy Partners, L.P.
Common Units |
3.934.723 | ||||||||
| 2017-07-31 | 3 | CQP |
Cheniere Energy Partners, L.P.
Common Units |
4.572.970 | ||||||||
| 2017-07-31 | 3 | CQP |
Cheniere Energy Partners, L.P.
Common Units |
4.425.656 | ||||||||
| 2017-07-31 | 3 | CQP |
Cheniere Energy Partners, L.P.
Common Units |
4.425.656 | ||||||||
| 2017-07-31 | 3 | CQP |
Cheniere Energy Partners, L.P.
Common Units |
3.934.723 | ||||||||
| 2017-06-20 |
|
4 | HGV |
Hilton Grand Vacations Inc.
Common Stock |
S - Sale | -5.039 | 2.664 | -65,42 | 35,40 | -178.381 | 94.306 | |
| 2017-06-20 |
|
4 | HGV |
Hilton Grand Vacations Inc.
Common Stock |
S - Sale | -848.802 | 448.712 | -65,42 | 35,40 | -30.047.591 | 15.884.405 | |
| 2017-06-20 |
|
4 | HGV |
Hilton Grand Vacations Inc.
Common Stock |
S - Sale | -1.759 | 930 | -65,41 | 35,40 | -62.269 | 32.922 | |
| 2017-06-20 |
|
4 | HGV |
Hilton Grand Vacations Inc.
Common Stock |
S - Sale | -29.900 | 15.806 | -65,42 | 35,40 | -1.058.460 | 559.532 | |
| 2017-06-20 |
|
4 | HGV |
Hilton Grand Vacations Inc.
Common Stock |
S - Sale | -292.021 | 162.208 | -64,29 | 35,40 | -10.337.543 | 5.742.163 | |
| 2017-06-20 |
|
4 | HGV |
Hilton Grand Vacations Inc.
Common Stock |
S - Sale | -8.472.479 | 4.728.369 | -64,18 | 35,40 | -299.925.757 | 167.384.263 | |
| 2017-06-15 |
|
4 | HLT |
Hilton Worldwide Holdings Inc.
Common Stock |
S - Sale | -8.610 | 17.065 | -33,53 | 65,82 | -566.710 | 1.123.218 | |
| 2017-06-15 |
|
4 | HLT |
Hilton Worldwide Holdings Inc.
Common Stock |
S - Sale | -1.450.508 | 2.874.542 | -33,54 | 65,82 | -95.472.437 | 189.202.354 | |
| 2017-06-15 |
|
4 | HLT |
Hilton Worldwide Holdings Inc.
Common Stock |
S - Sale | -3.006 | 5.958 | -33,53 | 65,82 | -197.855 | 392.156 | |
| 2017-06-15 |
|
4 | HLT |
Hilton Worldwide Holdings Inc.
Common Stock |
S - Sale | -51.095 | 101.257 | -33,54 | 65,82 | -3.363.073 | 6.664.736 | |
| 2017-06-15 |
|
4 | HLT |
Hilton Worldwide Holdings Inc.
Common Stock |
S - Sale | -499.312 | 1.014.784 | -32,98 | 65,82 | -32.864.716 | 66.793.083 | |
| 2017-06-15 |
|
4 | HLT |
Hilton Worldwide Holdings Inc.
Common Stock |
S - Sale | -14.487.469 | 29.515.359 | -32,92 | 65,82 | -953.565.210 | 1.942.700.929 | |
| 2017-06-09 | 3/A | SN |
Sanchez Energy Corp
Common Stock |
531.847 | ||||||||
| 2017-06-09 | 3/A | SN |
Sanchez Energy Corp
Common Stock |
480.874 | ||||||||
| 2017-06-09 | 3/A | SN |
Sanchez Energy Corp
Common Stock |
93.389 | ||||||||
| 2017-06-09 | 3/A | SN |
Sanchez Energy Corp
Common Stock |
35.635 | ||||||||
| 2017-06-09 | 3/A | SN |
Sanchez Energy Corp
Common Stock |
37.214 | ||||||||
| 2017-06-09 | 3/A | SN |
Sanchez Energy Corp
Common Stock |
35.340 | ||||||||
| 2017-06-09 | 3/A | SN |
Sanchez Energy Corp
Common Stock |
71.276 | ||||||||
| 2017-06-09 | 3/A | SN |
Sanchez Energy Corp
Common Stock |
41.855 | ||||||||
| 2017-06-09 | 3/A | SN |
Sanchez Energy Corp
Common Stock |
6.291 | ||||||||
| 2017-06-09 | 3/A | SN |
Sanchez Energy Corp
Common Stock |
621.279 | ||||||||
| 2017-06-07 |
|
4 | PK |
Park Hotels & Resorts Inc.
Common Stock |
S - Sale | -7.832 | 8.784 | -47,14 | 26,05 | -204.024 | 228.823 | |
| 2017-06-07 |
|
4 | PK |
Park Hotels & Resorts Inc.
Common Stock |
S - Sale | -1.319.463 | 1.479.651 | -47,14 | 26,05 | -34.372.011 | 38.544.909 | |
| 2017-06-07 |
|
4 | PK |
Park Hotels & Resorts Inc.
Common Stock |
S - Sale | -2.735 | 3.067 | -47,14 | 26,05 | -71.247 | 79.895 | |
| 2017-06-07 |
|
4 | PK |
Park Hotels & Resorts Inc.
Common Stock |
S - Sale | -46.476 | 52.121 | -47,14 | 26,05 | -1.210.700 | 1.357.752 | |
| 2017-06-07 |
|
4 | PK |
Park Hotels & Resorts Inc.
Common Stock |
S - Sale | -453.919 | 526.273 | -46,31 | 26,05 | -11.824.590 | 13.709.412 | |
| 2017-06-07 |
|
4 | PK |
Park Hotels & Resorts Inc.
Common Stock |
S - Sale | -13.169.575 | 15.317.691 | -46,23 | 26,05 | -343.067.429 | 399.025.851 | |
| 2017-05-31 |
|
4 | KOS |
Kosmos Energy Ltd.
Common Shares |
S - Sale | -88.066 | 144.183 | -37,92 | 7,15 | -629.672 | 1.030.908 | |
| 2017-05-31 |
|
4 | KOS |
Kosmos Energy Ltd.
Common Shares |
S - Sale | -648.610 | 1.061.882 | -37,92 | 7,15 | -4.637.562 | 7.592.456 | |
| 2017-05-31 |
|
4 | KOS |
Kosmos Energy Ltd.
Common Shares |
S - Sale | -781.182 | 1.278.921 | -37,92 | 7,15 | -5.585.451 | 9.144.285 | |
| 2017-05-31 |
|
4 | KOS |
Kosmos Energy Ltd.
Common Shares |
S - Sale | -457.034 | 811.425 | -36,03 | 7,15 | -3.267.793 | 5.801.689 | |
| 2017-05-31 |
|
4 | KOS |
Kosmos Energy Ltd.
Common Shares |
S - Sale | -28.025.108 | 49.756.101 | -36,03 | 7,15 | -200.379.522 | 355.756.122 | |
| 2017-05-22 |
|
4 | PFGC |
Performance Food Group Co
Common Stock |
S - Sale | -184.064 | 0 | -100,00 | 27,41 | -5.045.194 | ||
| 2017-05-22 |
|
4 | PFGC |
Performance Food Group Co
Common Stock |
S - Sale | -30.095 | 0 | -100,00 | 27,41 | -824.904 | ||
| 2017-05-22 |
|
4 | PFGC |
Performance Food Group Co
Common Stock |
S - Sale | -149.508 | 0 | -100,00 | 27,41 | -4.098.014 | ||
| 2017-05-22 |
|
4 | PFGC |
Performance Food Group Co
Common Stock |
S - Sale | -1.886.399 | 0 | -100,00 | 27,41 | -51.706.197 | ||
| 2017-05-22 |
|
4 | PFGC |
Performance Food Group Co
Common Stock |
S - Sale | -11.450.399 | 325.740 | -97,23 | 27,41 | -313.855.437 | 8.928.533 | |
| 2017-05-10 |
|
4 | SEAS |
SeaWorld Entertainment, Inc.
Common Stock |
S - Sale | -247.882 | 0 | -100,00 | 23,00 | -5.701.286 | ||
| 2017-05-10 |
|
4 | SEAS |
SeaWorld Entertainment, Inc.
Common Stock |
S - Sale | -679.058 | 0 | -100,00 | 23,00 | -15.618.334 | ||
| 2017-05-10 |
|
4 | SEAS |
SeaWorld Entertainment, Inc.
Common Stock |
S - Sale | -445.853 | 0 | -100,00 | 23,00 | -10.254.619 | ||
| 2017-05-10 |
|
4 | SEAS |
SeaWorld Entertainment, Inc.
Common Stock |
S - Sale | -570.487 | 0 | -100,00 | 23,00 | -13.121.201 | ||
| 2017-05-10 |
|
4 | SEAS |
SeaWorld Entertainment, Inc.
Common Stock |
S - Sale | -132.040 | 50.000 | -72,53 | 23,00 | -3.036.920 | 1.150.000 | |
| 2017-05-10 |
|
4 | SEAS |
SeaWorld Entertainment, Inc.
Common Stock |
S - Sale | -506.711 | 0 | -100,00 | 23,00 | -11.654.353 | ||
| 2017-05-10 |
|
4 | SEAS |
SeaWorld Entertainment, Inc.
Common Stock |
S - Sale | -555.394 | 0 | -100,00 | 23,00 | -12.774.062 | ||
| 2017-05-10 |
|
4 | SEAS |
SeaWorld Entertainment, Inc.
Common Stock |
S - Sale | -493.827 | 0 | -100,00 | 23,00 | -11.358.021 | ||
| 2017-05-10 |
|
4 | SEAS |
SeaWorld Entertainment, Inc.
Common Stock |
S - Sale | -15.820.811 | 0 | -100,00 | 23,00 | -363.878.653 | ||
| 2017-05-05 |
|
4 | STAY |
Extended Stay America, Inc.
Paired Shares |
S - Sale | -31.437 | 29.321 | -51,74 | 17,23 | -541.660 | 505.201 | |
| 2017-05-05 |
|
4 | STAY |
Extended Stay America, Inc.
Paired Shares |
S - Sale | -1.972.250 | 1.877.283 | -51,23 | 17,23 | -33.981.868 | 32.345.586 | |
| 2017-05-05 |
|
4 | STAY |
Extended Stay America, Inc.
Paired Shares |
S - Sale | -2.612.668 | 2.436.820 | -51,74 | 17,23 | -45.016.270 | 41.986.409 | |
| 2017-05-05 |
|
4 | STAY |
Extended Stay America, Inc.
Paired Shares |
S - Sale | -1.215.372 | 1.133.571 | -51,74 | 17,23 | -20.940.860 | 19.531.428 | |
| 2017-05-05 |
|
4 | STAY |
Extended Stay America, Inc.
Paired Shares |
S - Sale | -12.752 | 12.136 | -51,24 | 17,23 | -219.717 | 209.103 | |
| 2017-05-05 |
|
4 | STAY |
Extended Stay America, Inc.
Paired Shares |
S - Sale | -638.286 | 595.946 | -51,72 | 17,21 | -10.986.817 | 10.258.018 | |
| 2017-05-05 |
|
4 | STAY |
Extended Stay America, Inc.
Paired Shares |
S - Sale | -1.895.923 | 1.804.709 | -51,23 | 17,23 | -32.666.753 | 31.095.136 | |
| 2017-05-05 |
|
4 | STAY |
Extended Stay America, Inc.
Paired Shares |
S - Sale | -1.871.312 | 1.780.930 | -51,24 | 17,23 | -32.242.706 | 30.685.424 | |
| 2017-05-05 |
|
4 | NONE |
ESH Hospitality, Inc.
Paired Shares |
S - Sale | -31.437 | 29.321 | -51,74 | 17,23 | -541.660 | 505.201 | |
| 2017-05-05 |
|
4 | NONE |
ESH Hospitality, Inc.
Paired Shares |
S - Sale | -1.972.250 | 1.877.283 | -51,23 | 17,23 | -33.981.868 | 32.345.586 | |
| 2017-05-05 |
|
4 | NONE |
ESH Hospitality, Inc.
Paired Shares |
S - Sale | -2.612.668 | 2.436.820 | -51,74 | 17,23 | -45.016.270 | 41.986.409 | |
| 2017-05-05 |
|
4 | NONE |
ESH Hospitality, Inc.
Paired Shares |
S - Sale | -1.215.372 | 1.133.571 | -51,74 | 17,23 | -20.940.860 | 19.531.428 | |
| 2017-05-05 |
|
4 | NONE |
ESH Hospitality, Inc.
Paired Shares |
S - Sale | -12.752 | 12.136 | -51,24 | 17,23 | -219.717 | 209.103 | |
| 2017-05-05 |
|
4 | NONE |
ESH Hospitality, Inc.
Paired Shares |
S - Sale | -638.286 | 595.946 | -51,72 | 17,23 | -10.997.668 | 10.268.150 | |
| 2017-05-05 |
|
4 | NONE |
ESH Hospitality, Inc.
Paired Shares |
S - Sale | -1.895.923 | 1.804.709 | -51,23 | 17,23 | -32.666.753 | 31.095.136 | |
| 2017-05-05 |
|
4 | NONE |
ESH Hospitality, Inc.
Paired Shares |
S - Sale | -1.871.312 | 1.780.930 | -51,24 | 17,23 | -32.242.706 | 30.685.424 | |
| 2017-04-21 |
|
4 | HCC |
WARRIOR MET COAL, INC.
Common Stock |
S - Sale | -354.746 | 604.550 | -36,98 | 17,81 | -6.318.913 | 10.768.547 | |
| 2017-04-21 |
|
4 | HCC |
WARRIOR MET COAL, INC.
Common Stock |
S - Sale | -551.322 | 939.550 | -36,98 | 17,81 | -9.820.423 | 16.735.734 | |
| 2017-04-21 |
|
4 | HCC |
WARRIOR MET COAL, INC.
Common Stock |
S - Sale | -311.101 | 530.171 | -36,98 | 17,81 | -5.541.487 | 9.443.671 | |
| 2017-04-21 |
|
4 | HCC |
WARRIOR MET COAL, INC.
Common Stock |
S - Sale | -31.773 | 54.147 | -36,98 | 17,81 | -565.957 | 964.493 | |
| 2017-04-21 |
|
4 | HCC |
WARRIOR MET COAL, INC.
Common Stock |
S - Sale | -90.523 | 154.269 | -36,98 | 17,81 | -1.612.441 | 2.747.917 | |
| 2017-04-21 |
|
4 | HCC |
WARRIOR MET COAL, INC.
Common Stock |
S - Sale | -235.641 | 401.575 | -36,98 | 17,81 | -4.197.355 | 7.153.055 | |
| 2017-04-21 |
|
4 | HCC |
WARRIOR MET COAL, INC.
Common Stock |
S - Sale | -207.328 | 353.325 | -36,98 | 17,81 | -3.693.030 | 6.293.602 | |
| 2017-04-21 |
|
4 | HCC |
WARRIOR MET COAL, INC.
Common Stock |
S - Sale | -112.189 | 191.190 | -36,98 | 17,81 | -1.998.367 | 3.405.572 | |
| 2017-04-21 |
|
4 | HCC |
WARRIOR MET COAL, INC.
Common Stock |
S - Sale | -99.141 | 168.954 | -36,98 | 17,81 | -1.765.949 | 3.009.493 | |
| 2017-04-21 |
|
4 | HCC |
WARRIOR MET COAL, INC.
Common Stock |
S - Sale | -860.366 | 1.466.214 | -36,98 | 17,81 | -15.325.269 | 26.116.937 | |
| 2017-04-21 |
|
4 | HCC |
WARRIOR MET COAL, INC.
Common Stock |
S - Sale | -975.181 | 1.661.877 | -36,98 | 17,81 | -17.370.412 | 29.602.184 | |
| 2017-04-14 |
|
4 | CJES |
C&J Energy Services, Inc.
Common Stock |
S - Sale | -1.000.000 | 6.520.635 | -13,30 | 30,88 | -30.875.000 | 201.324.606 | |
| 2017-04-13 | 3 | HCC |
WARRIOR MET COAL, INC.
Common Stock |
12.992.191 | ||||||||
| 2017-04-13 | 3 | HCC |
WARRIOR MET COAL, INC.
Common Stock |
12.681.713 | ||||||||
| 2017-04-13 | 3 | HCC |
WARRIOR MET COAL, INC.
Common Stock |
10.623.228 | ||||||||
| 2017-04-13 | 3 | HCC |
WARRIOR MET COAL, INC.
Common Stock |
10.658.512 | ||||||||
| 2017-04-13 | 3 | HCC |
WARRIOR MET COAL, INC.
Common Stock |
10.915.786 | ||||||||
| 2017-04-13 | 3 | HCC |
WARRIOR MET COAL, INC.
Common Stock |
10.992.349 | ||||||||
| 2017-04-13 | 3 | HCC |
WARRIOR MET COAL, INC.
Common Stock |
10.599.925 | ||||||||
| 2017-04-13 | 3 | HCC |
WARRIOR MET COAL, INC.
Common Stock |
10.441.053 | ||||||||
| 2017-04-13 | 3 | HCC |
WARRIOR MET COAL, INC.
Common Stock |
11.196.405 | ||||||||
| 2017-04-13 | 3 | HCC |
WARRIOR MET COAL, INC.
Common Stock |
11.846.005 | ||||||||
| 2017-04-13 | 3 | HCC |
WARRIOR MET COAL, INC.
Common Stock |
11.314.429 | ||||||||
| 2017-04-13 | 3 | HCC |
WARRIOR MET COAL, INC.
Common Stock |
12.992.191 | ||||||||
| 2017-04-13 | 3 | HCC |
WARRIOR MET COAL, INC.
Common Stock |
12.681.713 | ||||||||
| 2017-04-13 | 3 | HCC |
WARRIOR MET COAL, INC.
Common Stock |
10.623.228 | ||||||||
| 2017-04-13 | 3 | HCC |
WARRIOR MET COAL, INC.
Common Stock |
10.658.512 | ||||||||
| 2017-04-13 | 3 | HCC |
WARRIOR MET COAL, INC.
Common Stock |
10.915.786 | ||||||||
| 2017-04-13 | 3 | HCC |
WARRIOR MET COAL, INC.
Common Stock |
10.992.349 | ||||||||
| 2017-04-13 | 3 | HCC |
WARRIOR MET COAL, INC.
Common Stock |
10.599.925 | ||||||||
| 2017-04-13 | 3 | HCC |
WARRIOR MET COAL, INC.
Common Stock |
10.441.053 | ||||||||
| 2017-04-13 | 3 | HCC |
WARRIOR MET COAL, INC.
Common Stock |
11.196.405 | ||||||||
| 2017-04-13 | 3 | HCC |
WARRIOR MET COAL, INC.
Common Stock |
11.846.005 | ||||||||
| 2017-04-13 | 3 | HCC |
WARRIOR MET COAL, INC.
Common Stock |
11.314.429 | ||||||||
| 2017-03-20 |
|
4 | NCR |
NCR CORP
Series A Convertible Preferred Stock |
S - Sale | -302 | 396 | -43,27 | 1.594,98 | -481.684 | 631.612 | |
| 2017-03-20 |
|
4 | NCR |
NCR CORP
Series A Convertible Preferred Stock |
S - Sale | -86.416 | 112.910 | -43,35 | 1.594,98 | -137.831.792 | 180.089.192 | |
| 2017-03-20 |
|
4 | NCR |
NCR CORP
Series A Convertible Preferred Stock |
S - Sale | -506 | 661 | -43,36 | 1.594,98 | -807.060 | 1.054.282 | |
| 2017-03-20 |
|
4 | NCR |
NCR CORP
Series A Convertible Preferred Stock |
S - Sale | -254.776 | 332.888 | -43,35 | 1.594,98 | -406.362.624 | 530.949.702 | |
| 2017-03-20 |
|
4 | NCR |
NCR CORP
Series A Convertible Preferred Stock |
C - Conversion | -80 | 698 | -10,28 | ||||
| 2017-03-20 |
|
4 | NCR |
NCR CORP
Series A Convertible Preferred Stock |
C - Conversion | -22.741 | 199.326 | -10,24 | ||||
| 2017-03-20 |
|
4 | NCR |
NCR CORP
Series A Convertible Preferred Stock |
C - Conversion | -133 | 1.167 | -10,23 | ||||
| 2017-03-20 |
|
4 | NCR |
NCR CORP
Series A Convertible Preferred Stock |
C - Conversion | -67.046 | 587.664 | -10,24 | ||||
| 2017-03-20 |
|
4 | NCR |
NCR CORP
Common Stock |
S - Sale | -2.670 | 0 | -100,00 | 48,47 | -129.415 | ||
| 2017-03-20 |
|
4 | NCR |
NCR CORP
Common Stock |
S - Sale | -758.729 | 0 | -100,00 | 48,47 | -36.775.595 | ||
| 2017-03-20 |
|
4 | NCR |
NCR CORP
Common Stock |
S - Sale | -4.438 | 0 | -100,00 | 48,47 | -215.110 | ||
| 2017-03-20 |
|
4 | NCR |
NCR CORP
Common Stock |
S - Sale | -2.236.916 | 0 | -100,00 | 48,47 | -108.423.319 | ||
| 2017-03-20 |
|
4 | NCR |
NCR CORP
Common Stock |
C - Conversion | 2.670 | 2.670 | |||||
| 2017-03-20 |
|
4 | NCR |
NCR CORP
Common Stock |
C - Conversion | 758.729 | 758.729 | |||||
| 2017-03-20 |
|
4 | NCR |
NCR CORP
Common Stock |
C - Conversion | 4.438 | 4.438 | |||||
| 2017-03-20 |
|
4 | NCR |
NCR CORP
Common Stock |
C - Conversion | 2.236.916 | 2.236.916 | |||||
| 2017-03-17 |
|
4 | PK |
Park Hotels & Resorts Inc.
Common Stock |
S - Sale | -28.062 | 16.616 | -62,81 | 25,45 | -714.178 | 422.877 | |
| 2017-03-17 |
|
4 | PK |
Park Hotels & Resorts Inc.
Common Stock |
S - Sale | -4.727.299 | 2.799.114 | -62,81 | 25,45 | -120.309.760 | 71.237.451 | |
| 2017-03-17 |
|
4 | PK |
Park Hotels & Resorts Inc.
Common Stock |
S - Sale | -9.797 | 5.802 | -62,81 | 25,45 | -249.334 | 147.661 | |
| 2017-03-17 |
|
4 | PK |
Park Hotels & Resorts Inc.
Common Stock |
S - Sale | -166.521 | 98.597 | -62,81 | 25,45 | -4.237.959 | 2.509.294 | |
| 2017-03-17 |
|
4 | PK |
Park Hotels & Resorts Inc.
Common Stock |
S - Sale | -1.623.542 | 980.192 | -62,35 | 25,45 | -41.319.144 | 24.945.886 | |
| 2017-03-17 |
|
4 | PK |
Park Hotels & Resorts Inc.
Common Stock |
S - Sale | -47.096.232 | 28.487.266 | -62,31 | 25,45 | -1.198.599.104 | 725.000.920 | |
| 2017-03-17 |
|
4 | HLT |
Hilton Worldwide Holdings Inc.
Common Stock |
S - Sale | -43.148 | 25.675 | -62,69 | 54,57 | -2.354.586 | 1.401.085 | |
| 2017-03-17 |
|
4 | HLT |
Hilton Worldwide Holdings Inc.
Common Stock |
S - Sale | -7.268.143 | 4.325.050 | -62,69 | 54,57 | -396.622.564 | 236.017.978 | |
| 2017-03-17 |
|
4 | HLT |
Hilton Worldwide Holdings Inc.
Common Stock |
S - Sale | -15.067 | 8.964 | -62,70 | 54,57 | -822.206 | 489.165 | |
| 2017-03-17 |
|
4 | HLT |
Hilton Worldwide Holdings Inc.
Common Stock |
S - Sale | -256.021 | 152.352 | -62,69 | 54,57 | -13.971.066 | 8.313.849 | |
| 2017-03-17 |
|
4 | HLT |
Hilton Worldwide Holdings Inc.
Common Stock |
S - Sale | -2.496.530 | 1.514.096 | -62,25 | 54,57 | -136.235.642 | 82.624.219 | |
| 2017-03-17 |
|
4 | HLT |
Hilton Worldwide Holdings Inc.
Common Stock |
S - Sale | -72.421.091 | 44.002.828 | -62,20 | 54,57 | -3.952.018.936 | 2.401.234.324 | |
| 2017-03-17 |
|
4 | HGV |
Hilton Grand Vacations Inc.
Common Stock |
S - Sale | -12.942 | 7.703 | -62,69 | 24,32 | -314.749 | 187.337 | |
| 2017-03-17 |
|
4 | HGV |
Hilton Grand Vacations Inc.
Common Stock |
S - Sale | -2.180.442 | 1.297.514 | -62,69 | 24,32 | -53.028.349 | 31.555.540 | |
| 2017-03-17 |
|
4 | HGV |
Hilton Grand Vacations Inc.
Common Stock |
S - Sale | -4.521 | 2.689 | -62,70 | 24,32 | -109.951 | 65.396 | |
| 2017-03-17 |
|
4 | HGV |
Hilton Grand Vacations Inc.
Common Stock |
S - Sale | -76.807 | 45.706 | -62,69 | 24,32 | -1.867.946 | 1.111.570 | |
| 2017-03-17 |
|
4 | HGV |
Hilton Grand Vacations Inc.
Common Stock |
S - Sale | -748.958 | 454.229 | -62,25 | 24,32 | -18.214.659 | 11.046.849 | |
| 2017-03-17 |
|
4 | HGV |
Hilton Grand Vacations Inc.
Common Stock |
S - Sale | -21.726.330 | 13.200.848 | -62,20 | 24,32 | -528.384.346 | 321.044.623 | |
| 2017-03-14 |
|
4 | STAY |
Extended Stay America, Inc.
Paired Shares |
S - Sale | -26.204 | 60.758 | -30,13 | 16,70 | -437.607 | 1.014.659 | |
| 2017-03-14 |
|
4 | STAY |
Extended Stay America, Inc.
Paired Shares |
S - Sale | -1.643.244 | 3.892.216 | -29,69 | 16,70 | -27.442.175 | 65.000.007 | |
| 2017-03-14 |
|
4 | STAY |
Extended Stay America, Inc.
Paired Shares |
S - Sale | -2.177.720 | 5.049.488 | -30,13 | 16,70 | -36.367.924 | 84.326.450 | |
| 2017-03-14 |
|
4 | STAY |
Extended Stay America, Inc.
Paired Shares |
S - Sale | -1.013.041 | 2.348.943 | -30,13 | 16,70 | -16.917.785 | 39.227.348 | |
| 2017-03-14 |
|
4 | STAY |
Extended Stay America, Inc.
Paired Shares |
S - Sale | -10.624 | 25.162 | -29,69 | 16,70 | -177.421 | 420.205 | |
| 2017-03-14 |
|
4 | STAY |
Extended Stay America, Inc.
Paired Shares |
S - Sale | -527.612 | 1.246.027 | -29,75 | 16,70 | -8.811.120 | 20.808.651 | |
| 2017-03-14 |
|
4 | STAY |
Extended Stay America, Inc.
Paired Shares |
S - Sale | -1.581.953 | 3.735.994 | -29,75 | 16,70 | -26.418.615 | 62.391.100 | |
| 2017-03-14 |
|
4 | STAY |
Extended Stay America, Inc.
Paired Shares |
S - Sale | -1.561.268 | 3.687.142 | -29,75 | 16,70 | -26.073.176 | 61.575.271 | |
| 2017-03-14 |
|
4 | NONE |
ESH Hospitality, Inc.
Paired Shares |
S - Sale | -26.204 | 60.758 | -30,13 | 16,70 | -437.607 | 1.014.659 | |
| 2017-03-14 |
|
4 | NONE |
ESH Hospitality, Inc.
Paired Shares |
S - Sale | -1.643.244 | 3.892.216 | -29,69 | 16,70 | -27.442.175 | 65.000.007 | |
| 2017-03-14 |
|
4 | NONE |
ESH Hospitality, Inc.
Paired Shares |
S - Sale | -2.177.720 | 5.049.488 | -30,13 | 16,70 | -36.367.924 | 84.326.450 | |
| 2017-03-14 |
|
4 | NONE |
ESH Hospitality, Inc.
Paired Shares |
S - Sale | -1.013.041 | 2.348.943 | -30,13 | 16,70 | -16.917.785 | 39.227.348 | |
| 2017-03-14 |
|
4 | NONE |
ESH Hospitality, Inc.
Paired Shares |
S - Sale | -10.624 | 25.162 | -29,69 | 16,70 | -177.421 | 420.205 | |
| 2017-03-14 |
|
4 | NONE |
ESH Hospitality, Inc.
Paired Shares |
S - Sale | -527.612 | 1.246.027 | -29,75 | 16,70 | -8.811.120 | 20.808.651 | |
| 2017-03-14 |
|
4 | NONE |
ESH Hospitality, Inc.
Paired Shares |
S - Sale | -1.581.953 | 3.735.994 | -29,75 | 16,70 | -26.418.615 | 62.391.100 | |
| 2017-03-14 |
|
4 | NONE |
ESH Hospitality, Inc.
Paired Shares |
S - Sale | -1.561.268 | 3.687.142 | -29,75 | 16,70 | -26.073.176 | 61.575.271 | |
| 2017-03-13 | 3 | SN |
Sanchez Energy Corp
Common Stock |
1.810.660 | ||||||||
| 2017-03-13 | 3 | SN |
Sanchez Energy Corp
Common Stock |
1.826.461 | ||||||||
| 2017-03-13 | 3 | SN |
Sanchez Energy Corp
Common Stock |
1.527.139 | ||||||||
| 2017-03-13 | 3 | SN |
Sanchez Energy Corp
Common Stock |
1.482.529 | ||||||||
| 2017-03-13 | 3 | SN |
Sanchez Energy Corp
Common Stock |
1.483.751 | ||||||||
| 2017-03-13 | 3 | SN |
Sanchez Energy Corp
Common Stock |
1.482.296 | ||||||||
| 2017-03-13 | 3 | SN |
Sanchez Energy Corp
Common Stock |
1.510.057 | ||||||||
| 2017-03-13 | 3 | SN |
Sanchez Energy Corp
Common Stock |
1.487.330 | ||||||||
| 2017-03-13 | 3 | SN |
Sanchez Energy Corp
Common Stock |
1.459.860 | ||||||||
| 2017-03-13 | 3 | SN |
Sanchez Energy Corp
Common Stock |
1.934.917 | ||||||||
| 2017-03-13 | 3 | SN |
Sanchez Energy Corp
Common Stock |
1.810.660 | ||||||||
| 2017-03-13 | 3 | SN |
Sanchez Energy Corp
Common Stock |
1.826.461 | ||||||||
| 2017-03-13 | 3 | SN |
Sanchez Energy Corp
Common Stock |
1.527.139 | ||||||||
| 2017-03-13 | 3 | SN |
Sanchez Energy Corp
Common Stock |
1.482.529 | ||||||||
| 2017-03-13 | 3 | SN |
Sanchez Energy Corp
Common Stock |
1.483.751 | ||||||||
| 2017-03-13 | 3 | SN |
Sanchez Energy Corp
Common Stock |
1.482.296 | ||||||||
| 2017-03-13 | 3 | SN |
Sanchez Energy Corp
Common Stock |
1.510.057 | ||||||||
| 2017-03-13 | 3 | SN |
Sanchez Energy Corp
Common Stock |
1.487.330 | ||||||||
| 2017-03-13 | 3 | SN |
Sanchez Energy Corp
Common Stock |
1.459.860 | ||||||||
| 2017-03-13 | 3 | SN |
Sanchez Energy Corp
Common Stock |
1.934.917 | ||||||||
| 2017-03-03 |
|
4 | PFGC |
Performance Food Group Co
Common Stock |
S - Sale | -172.345 | 184.064 | -48,36 | 23,30 | -4.015.638 | 4.288.691 | |
| 2017-03-03 |
|
4 | PFGC |
Performance Food Group Co
Common Stock |
S - Sale | -28.180 | 30.095 | -48,36 | 23,30 | -656.594 | 701.214 | |
| 2017-03-03 |
|
4 | PFGC |
Performance Food Group Co
Common Stock |
S - Sale | -139.991 | 149.508 | -48,36 | 23,30 | -3.261.790 | 3.483.536 | |
| 2017-03-03 |
|
4 | PFGC |
Performance Food Group Co
Common Stock |
S - Sale | -1.766.298 | 1.886.399 | -48,36 | 23,30 | -41.154.743 | 43.953.097 | |
| 2017-03-03 |
|
4 | PFGC |
Performance Food Group Co
Common Stock |
S - Sale | -11.026.387 | 11.776.139 | -48,36 | 23,30 | -256.914.817 | 274.384.039 | |
| 2017-03-03 | 3 | CJES |
C&J Energy Services, Inc.
Common Stock |
15.041.270 | ||||||||
| 2017-03-03 | 3 | CJES |
C&J Energy Services, Inc.
Common Stock |
15.041.270 | ||||||||
| 2017-03-03 | 3 | CJES |
C&J Energy Services, Inc.
Common Stock |
15.041.270 | ||||||||
| 2017-03-03 | 3 | CJES |
C&J Energy Services, Inc.
Common Stock |
15.041.270 | ||||||||
| 2017-03-03 | 3 | CJES |
C&J Energy Services, Inc.
Common Stock |
15.041.270 | ||||||||
| 2017-03-03 | 3 | CJES |
C&J Energy Services, Inc.
Common Stock |
15.041.270 | ||||||||
| 2017-03-03 | 3 | CJES |
C&J Energy Services, Inc.
Common Stock |
15.041.270 | ||||||||
| 2017-02-15 |
|
4 | UAN |
CVR PARTNERS, LP
Common Units representing Limited Partner Interests |
S - Sale | -67.932 | 164.388 | -29,24 | 6,10 | -414.385 | 1.002.767 | |
| 2017-02-15 |
|
4 | UAN |
CVR PARTNERS, LP
Common Units representing Limited Partner Interests |
S - Sale | -389.493 | 942.406 | -29,24 | 6,10 | -2.375.907 | 5.748.677 | |
| 2017-02-15 |
|
4 | UAN |
CVR PARTNERS, LP
Common Units representing Limited Partner Interests |
S - Sale | -531.575 | 1.286.330 | -29,24 | 6,10 | -3.242.608 | 7.846.613 | |
| 2017-02-13 |
|
4 | UAN |
CVR PARTNERS, LP
Common Units representing Limited Partner Interests |
S - Sale | -859 | 232.320 | -0,37 | 6,20 | -5.326 | 1.440.384 | |
| 2017-02-13 |
|
4 | UAN |
CVR PARTNERS, LP
Common Units representing Limited Partner Interests |
S - Sale | -4.796 | 1.331.899 | -0,36 | 6,20 | -29.735 | 8.257.774 | |
| 2017-02-13 |
|
4 | UAN |
CVR PARTNERS, LP
Common Units representing Limited Partner Interests |
S - Sale | -6.547 | 1.817.905 | -0,36 | 6,20 | -40.591 | 11.271.011 | |
| 2017-02-13 |
|
4 | UAN |
CVR PARTNERS, LP
Common Units representing Limited Partner Interests |
S - Sale | -140.808 | 233.179 | -37,65 | 6,10 | -858.929 | 1.422.392 | |
| 2017-02-13 |
|
4 | UAN |
CVR PARTNERS, LP
Common Units representing Limited Partner Interests |
S - Sale | -786.161 | 1.336.695 | -37,03 | 6,10 | -4.795.582 | 8.153.840 | |
| 2017-02-13 |
|
4 | UAN |
CVR PARTNERS, LP
Common Units representing Limited Partner Interests |
S - Sale | -1.073.031 | 1.824.452 | -37,03 | 6,10 | -6.545.489 | 11.129.157 | |
| 2017-02-08 |
|
4 | UAN |
CVR PARTNERS, LP
Common Units representing Limited Partner Interests |
S - Sale | -2.212 | 373.987 | -0,59 | 6,20 | -13.714 | 2.318.719 | |
| 2017-02-08 |
|
4 | UAN |
CVR PARTNERS, LP
Common Units representing Limited Partner Interests |
S - Sale | -12.554 | 2.122.856 | -0,59 | 6,20 | -77.835 | 13.161.707 | |
| 2017-02-08 |
|
4 | UAN |
CVR PARTNERS, LP
Common Units representing Limited Partner Interests |
S - Sale | -17.136 | 2.897.483 | -0,59 | 6,20 | -106.243 | 17.964.395 | |
| 2017-02-08 |
|
4 | UAN |
CVR PARTNERS, LP
Common Units representing Limited Partner Interests |
S - Sale | -1.187 | 376.199 | -0,31 | 6,21 | -7.368 | 2.335.218 | |
| 2017-02-08 |
|
4 | UAN |
CVR PARTNERS, LP
Common Units representing Limited Partner Interests |
S - Sale | -6.736 | 2.135.410 | -0,31 | 6,21 | -41.813 | 13.255.344 | |
| 2017-02-08 |
|
4 | UAN |
CVR PARTNERS, LP
Common Units representing Limited Partner Interests |
S - Sale | -9.195 | 2.914.619 | -0,31 | 6,21 | -57.077 | 18.092.206 | |
| 2017-02-02 |
|
4 | UAN |
CVR PARTNERS, LP
Common Units representing Limited Partner Interests |
S - Sale | -140.808 | 377.386 | -27,17 | 6,35 | -894.286 | 2.396.816 | |
| 2017-02-02 |
|
4 | UAN |
CVR PARTNERS, LP
Common Units representing Limited Partner Interests |
S - Sale | -786.161 | 2.142.146 | -26,85 | 6,35 | -4.992.987 | 13.604.983 | |
| 2017-02-02 |
|
4 | UAN |
CVR PARTNERS, LP
Common Units representing Limited Partner Interests |
S - Sale | -1.073.031 | 2.923.814 | -26,85 | 6,35 | -6.814.927 | 18.569.435 | |
| 2017-02-02 |
|
4 | UAN |
CVR PARTNERS, LP
Common Units representing Limited Partner Interests |
S - Sale | -1.045 | 518.194 | -0,20 | 6,41 | -6.698 | 3.321.209 | |
| 2017-02-02 |
|
4 | UAN |
CVR PARTNERS, LP
Common Units representing Limited Partner Interests |
S - Sale | -5.901 | 2.928.307 | -0,20 | 6,41 | -37.821 | 18.768.105 | |
| 2017-02-02 |
|
4 | UAN |
CVR PARTNERS, LP
Common Units representing Limited Partner Interests |
S - Sale | -8.054 | 3.996.845 | -0,20 | 6,41 | -51.620 | 25.616.579 | |
| 2017-02-01 | 3 | INVH |
Invitation Homes Inc.
Common Stock |
300.327.390 | ||||||||
| 2017-02-01 | 3 | INVH |
Invitation Homes Inc.
Common Stock |
263.742.480 | ||||||||
| 2017-02-01 | 3 | INVH |
Invitation Homes Inc.
Common Stock |
228.565.095 | ||||||||
| 2017-02-01 | 3 | INVH |
Invitation Homes Inc.
Common Stock |
253.854.057 | ||||||||
| 2017-02-01 | 3 | INVH |
Invitation Homes Inc.
Common Stock |
239.883.458 | ||||||||
| 2017-02-01 | 3 | INVH |
Invitation Homes Inc.
Common Stock |
235.196.220 | ||||||||
| 2017-02-01 | 3 | INVH |
Invitation Homes Inc.
Common Stock |
237.994.092 | ||||||||
| 2017-02-01 | 3 | INVH |
Invitation Homes Inc.
Common Stock |
300.327.390 | ||||||||
| 2017-02-01 | 3 | INVH |
Invitation Homes Inc.
Common Stock |
263.742.480 | ||||||||
| 2017-02-01 | 3 | INVH |
Invitation Homes Inc.
Common Stock |
228.565.095 | ||||||||
| 2017-02-01 | 3 | INVH |
Invitation Homes Inc.
Common Stock |
253.854.057 | ||||||||
| 2017-02-01 | 3 | INVH |
Invitation Homes Inc.
Common Stock |
239.883.458 | ||||||||
| 2017-02-01 | 3 | INVH |
Invitation Homes Inc.
Common Stock |
235.196.220 | ||||||||
| 2017-02-01 | 3 | INVH |
Invitation Homes Inc.
Common Stock |
237.994.092 | ||||||||
| 2017-01-31 |
|
4 | MIK |
Michaels Companies, Inc.
Common Stock |
S - Sale | -459.799 | 520.940 | -46,88 | 21,28 | -9.784.523 | 11.085.603 | |
| 2017-01-31 |
|
4 | MIK |
Michaels Companies, Inc.
Common Stock |
S - Sale | -605.973 | 686.552 | -46,88 | 21,28 | -12.895.105 | 14.609.827 | |
| 2017-01-31 |
|
4 | MIK |
Michaels Companies, Inc.
Common Stock |
S - Sale | -41.315 | 46.810 | -46,88 | 21,28 | -879.183 | 996.117 | |
| 2017-01-31 |
|
4 | MIK |
Michaels Companies, Inc.
Common Stock |
S - Sale | -194.647 | 220.529 | -46,88 | 21,28 | -4.142.088 | 4.692.857 | |
| 2017-01-31 |
|
4 | MIK |
Michaels Companies, Inc.
Common Stock |
S - Sale | -3.108.200 | 3.521.509 | -46,88 | 21,28 | -66.142.496 | 74.937.712 | |
| 2017-01-31 |
|
4 | MIK |
Michaels Companies, Inc.
Common Stock |
S - Sale | -13.590.066 | 15.397.191 | -46,88 | 21,28 | -289.196.604 | 327.652.224 | |
| 2017-01-31 |
|
4 | UAN |
CVR PARTNERS, LP
Common Units representing Limited Partner Interests |
S - Sale | -6.940 | 519.239 | -1,32 | 6,53 | -45.290 | 3.388.554 | |
| 2017-01-31 |
|
4 | UAN |
CVR PARTNERS, LP
Common Units representing Limited Partner Interests |
S - Sale | -3.876 | 2.934.208 | -0,13 | 6,53 | -25.295 | 19.148.641 | |
| 2017-01-31 |
|
4 | UAN |
CVR PARTNERS, LP
Common Units representing Limited Partner Interests |
S - Sale | -5.289 | 4.004.899 | -0,13 | 6,53 | -34.516 | 26.135.971 | |
| 2017-01-27 |
|
4 | UAN |
CVR PARTNERS, LP
Common Units representing Limited Partner Interests |
S - Sale | -5.972 | 526.179 | -1,12 | 6,50 | -38.792 | 3.417.848 | |
| 2017-01-27 |
|
4 | UAN |
CVR PARTNERS, LP
Common Units representing Limited Partner Interests |
S - Sale | -33.347 | 2.938.084 | -1,12 | 6,50 | -216.609 | 19.084.618 | |
| 2017-01-27 |
|
4 | UAN |
CVR PARTNERS, LP
Common Units representing Limited Partner Interests |
S - Sale | -45.516 | 4.010.188 | -1,12 | 6,50 | -295.654 | 26.048.577 | |
| 2017-01-27 |
|
4 | UAN |
CVR PARTNERS, LP
Common Units representing Limited Partner Interests |
S - Sale | -3.122 | 532.151 | -0,58 | 6,80 | -21.224 | 3.617.669 | |
| 2017-01-27 |
|
4 | UAN |
CVR PARTNERS, LP
Common Units representing Limited Partner Interests |
S - Sale | -17.425 | 2.971.431 | -0,58 | 6,80 | -118.459 | 20.200.382 | |
| 2017-01-27 |
|
4 | UAN |
CVR PARTNERS, LP
Common Units representing Limited Partner Interests |
S - Sale | -23.784 | 4.055.704 | -0,58 | 6,80 | -161.688 | 27.571.487 | |
| 2017-01-25 |
|
4 | UAN |
CVR PARTNERS, LP
Common Units representing Limited Partner Interests |
S - Sale | -6.337 | 535.273 | -1,17 | 6,73 | -42.658 | 3.603.190 | |
| 2017-01-25 |
|
4 | UAN |
CVR PARTNERS, LP
Common Units representing Limited Partner Interests |
S - Sale | -35.377 | 2.988.856 | -1,17 | 6,73 | -238.140 | 20.119.484 | |
| 2017-01-25 |
|
4 | UAN |
CVR PARTNERS, LP
Common Units representing Limited Partner Interests |
S - Sale | -48.286 | 4.079.488 | -1,17 | 6,73 | -325.037 | 27.461.073 | |
| 2017-01-25 |
|
4 | UAN |
CVR PARTNERS, LP
Common Units representing Limited Partner Interests |
S - Sale | -6.291 | 541.610 | -1,15 | 6,42 | -40.396 | 3.477.786 | |
| 2017-01-25 |
|
4 | UAN |
CVR PARTNERS, LP
Common Units representing Limited Partner Interests |
S - Sale | -35.125 | 3.024.233 | -1,15 | 6,42 | -225.545 | 19.419.205 | |
| 2017-01-25 |
|
4 | UAN |
CVR PARTNERS, LP
Common Units representing Limited Partner Interests |
S - Sale | -68.584 | 4.127.774 | -1,63 | 6,42 | -440.392 | 26.505.262 | |
| 2017-01-23 |
|
4 | UAN |
CVR PARTNERS, LP
Common Units representing Limited Partner Interests |
S - Sale | -10.223 | 547.901 | -1,83 | 6,40 | -65.454 | 3.507.991 | |
| 2017-01-23 |
|
4 | UAN |
CVR PARTNERS, LP
Common Units representing Limited Partner Interests |
S - Sale | -57.081 | 3.059.358 | -1,83 | 6,40 | -365.467 | 19.587.846 | |
| 2017-01-23 |
|
4 | UAN |
CVR PARTNERS, LP
Common Units representing Limited Partner Interests |
S - Sale | -78.295 | 4.196.358 | -1,83 | 6,40 | -501.292 | 26.867.602 | |
| 2017-01-23 |
|
4 | UAN |
CVR PARTNERS, LP
Common Units representing Limited Partner Interests |
S - Sale | -3.819 | 558.124 | -0,68 | 6,27 | -23.951 | 3.500.275 | |
| 2017-01-23 |
|
4 | UAN |
CVR PARTNERS, LP
Common Units representing Limited Partner Interests |
S - Sale | -21.328 | 3.116.439 | -0,68 | 6,27 | -133.759 | 19.544.747 | |
| 2017-01-23 |
|
4 | UAN |
CVR PARTNERS, LP
Common Units representing Limited Partner Interests |
S - Sale | -29.254 | 4.274.653 | -0,68 | 6,27 | -183.466 | 26.808.486 | |
| 2017-01-20 |
|
4 | KOS |
Kosmos Energy Ltd.
Common Shares |
S - Sale | -37.752 | 232.249 | -13,98 | 6,58 | -248.408 | 1.528.198 | |
| 2017-01-20 |
|
4 | KOS |
Kosmos Energy Ltd.
Common Shares |
S - Sale | -278.037 | 1.710.492 | -13,98 | 6,58 | -1.829.483 | 11.255.037 | |
| 2017-01-20 |
|
4 | KOS |
Kosmos Energy Ltd.
Common Shares |
S - Sale | -334.865 | 2.060.103 | -13,98 | 6,58 | -2.203.412 | 13.555.478 | |
| 2017-01-20 |
|
4 | KOS |
Kosmos Energy Ltd.
Common Shares |
S - Sale | -206.185 | 1.268.459 | -13,98 | 6,58 | -1.356.697 | 8.346.460 | |
| 2017-01-20 |
|
4 | KOS |
Kosmos Energy Ltd.
Common Shares |
S - Sale | -12.643.161 | 77.781.209 | -13,98 | 6,58 | -83.191.999 | 511.800.355 | |
| 2017-01-19 |
|
4 | UAN |
CVR PARTNERS, LP
Common Units representing Limited Partner Interests |
S - Sale | -7.021 | 561.943 | -1,23 | 6,54 | -45.924 | 3.675.669 | |
| 2017-01-19 |
|
4 | UAN |
CVR PARTNERS, LP
Common Units representing Limited Partner Interests |
S - Sale | -39.198 | 3.137.767 | -1,23 | 6,54 | -256.394 | 20.524.134 | |
| 2017-01-19 |
|
4 | UAN |
CVR PARTNERS, LP
Common Units representing Limited Partner Interests |
S - Sale | -53.781 | 4.303.907 | -1,23 | 6,54 | -351.782 | 28.151.856 | |
| 2017-01-19 |
|
4 | UAN |
CVR PARTNERS, LP
Common Units representing Limited Partner Interests |
S - Sale | -51.701 | 568.964 | -8,33 | 6,46 | -333.988 | 3.675.507 | |
| 2017-01-19 |
|
4 | UAN |
CVR PARTNERS, LP
Common Units representing Limited Partner Interests |
S - Sale | -167.409 | 3.176.965 | -5,01 | 6,46 | -1.081.462 | 20.523.194 | |
| 2017-01-19 |
|
4 | UAN |
CVR PARTNERS, LP
Common Units representing Limited Partner Interests |
S - Sale | -395.890 | 4.357.688 | -8,33 | 6,46 | -2.557.449 | 28.150.664 | |
| 2017-01-18 |
|
4 | PFGC |
Performance Food Group Co
Common Stock |
S - Sale | -127.663 | 356.409 | -26,37 | 22,67 | -2.894.120 | 8.079.792 | |
| 2017-01-18 |
|
4 | PFGC |
Performance Food Group Co
Common Stock |
S - Sale | -20.874 | 58.275 | -26,37 | 22,67 | -473.214 | 1.321.094 | |
| 2017-01-18 |
|
4 | PFGC |
Performance Food Group Co
Common Stock |
S - Sale | -103.697 | 289.499 | -26,37 | 22,67 | -2.350.811 | 6.562.942 | |
| 2017-01-18 |
|
4 | PFGC |
Performance Food Group Co
Common Stock |
S - Sale | -1.308.369 | 3.652.697 | -26,37 | 22,67 | -29.660.725 | 82.806.641 | |
| 2017-01-18 |
|
4 | PFGC |
Performance Food Group Co
Common Stock |
S - Sale | -8.167.694 | 22.802.526 | -26,37 | 22,67 | -185.161.623 | 516.933.264 | |
| 2017-01-13 |
|
4 | UAN |
CVR PARTNERS, LP
Common Units representing Limited Partner Interests |
S - Sale | -2.245 | 620.665 | -0,36 | 6,35 | -14.256 | 3.941.223 | |
| 2017-01-13 |
|
4 | UAN |
CVR PARTNERS, LP
Common Units representing Limited Partner Interests |
S - Sale | -12.097 | 3.344.374 | -0,36 | 6,35 | -76.816 | 21.236.775 | |
| 2017-01-13 |
|
4 | UAN |
CVR PARTNERS, LP
Common Units representing Limited Partner Interests |
S - Sale | -17.194 | 4.753.578 | -0,36 | 6,35 | -109.182 | 30.185.220 | |
| 2017-01-13 |
|
4 | UAN |
CVR PARTNERS, LP
Common Units representing Limited Partner Interests |
S - Sale | -2.898 | 622.910 | -0,46 | 6,37 | -18.472 | 3.970.491 | |
| 2017-01-13 |
|
4 | UAN |
CVR PARTNERS, LP
Common Units representing Limited Partner Interests |
S - Sale | -15.615 | 3.356.471 | -0,46 | 6,37 | -99.532 | 21.394.482 | |
| 2017-01-13 |
|
4 | UAN |
CVR PARTNERS, LP
Common Units representing Limited Partner Interests |
S - Sale | -22.195 | 4.770.772 | -0,46 | 6,37 | -141.473 | 30.409.378 | |
| 2017-01-13 | 3 | PK |
Park Hotels & Resorts Inc.
Common Stock |
149.380.545 | ||||||||
| 2017-01-13 | 3 | PK |
Park Hotels & Resorts Inc.
Common Stock |
81.932.569 | ||||||||
| 2017-01-13 | 3 | PK |
Park Hotels & Resorts Inc.
Common Stock |
79.771.220 | ||||||||
| 2017-01-13 | 3 | PK |
Park Hotels & Resorts Inc.
Common Stock |
79.540.611 | ||||||||
| 2017-01-13 | 3 | PK |
Park Hotels & Resorts Inc.
Common Stock |
86.482.111 | ||||||||
| 2017-01-13 | 3 | PK |
Park Hotels & Resorts Inc.
Common Stock |
79.567.487 | ||||||||
| 2017-01-13 | 3 | PK |
Park Hotels & Resorts Inc.
Common Stock |
79.535.017 | ||||||||
| 2017-01-13 | 3 | PK |
Park Hotels & Resorts Inc.
Common Stock |
149.380.545 | ||||||||
| 2017-01-13 | 3 | PK |
Park Hotels & Resorts Inc.
Common Stock |
81.932.569 | ||||||||
| 2017-01-13 | 3 | PK |
Park Hotels & Resorts Inc.
Common Stock |
79.771.220 | ||||||||
| 2017-01-13 | 3 | PK |
Park Hotels & Resorts Inc.
Common Stock |
79.540.611 | ||||||||
| 2017-01-13 | 3 | PK |
Park Hotels & Resorts Inc.
Common Stock |
86.482.111 | ||||||||
| 2017-01-13 | 3 | PK |
Park Hotels & Resorts Inc.
Common Stock |
79.567.487 | ||||||||
| 2017-01-13 | 3 | PK |
Park Hotels & Resorts Inc.
Common Stock |
79.535.017 | ||||||||
| 2017-01-13 | 3 | HGV |
Hilton Grand Vacations Inc.
Common Stock |
74.690.282 | ||||||||
| 2017-01-13 | 3 | HGV |
Hilton Grand Vacations Inc.
Common Stock |
40.966.289 | ||||||||
| 2017-01-13 | 3 | HGV |
Hilton Grand Vacations Inc.
Common Stock |
39.885.615 | ||||||||
| 2017-01-13 | 3 | HGV |
Hilton Grand Vacations Inc.
Common Stock |
39.770.312 | ||||||||
| 2017-01-13 | 3 | HGV |
Hilton Grand Vacations Inc.
Common Stock |
43.241.058 | ||||||||
| 2017-01-13 | 3 | HGV |
Hilton Grand Vacations Inc.
Common Stock |
39.783.747 | ||||||||
| 2017-01-13 | 3 | HGV |
Hilton Grand Vacations Inc.
Common Stock |
39.767.513 | ||||||||
| 2017-01-13 | 3 | HGV |
Hilton Grand Vacations Inc.
Common Stock |
74.690.282 | ||||||||
| 2017-01-13 | 3 | HGV |
Hilton Grand Vacations Inc.
Common Stock |
40.966.289 | ||||||||
| 2017-01-13 | 3 | HGV |
Hilton Grand Vacations Inc.
Common Stock |
39.885.615 | ||||||||
| 2017-01-13 | 3 | HGV |
Hilton Grand Vacations Inc.
Common Stock |
39.770.312 | ||||||||
| 2017-01-13 | 3 | HGV |
Hilton Grand Vacations Inc.
Common Stock |
43.241.058 | ||||||||
| 2017-01-13 | 3 | HGV |
Hilton Grand Vacations Inc.
Common Stock |
39.783.747 | ||||||||
| 2017-01-13 | 3 | HGV |
Hilton Grand Vacations Inc.
Common Stock |
39.767.513 | ||||||||
| 2017-01-12 |
|
4 | HPP |
Hudson Pacific Properties, Inc.
Common Units |
S - Sale | -343.939 | 0 | -100,00 | 35,00 | -12.037.865 | ||
| 2017-01-12 |
|
4 | HPP |
Hudson Pacific Properties, Inc.
Common Units |
S - Sale | -4.299 | 0 | -100,00 | 35,00 | -150.465 | ||
| 2017-01-12 |
|
4 | HPP |
Hudson Pacific Properties, Inc.
Common Units |
S - Sale | -80.415 | 0 | -100,00 | 35,00 | -2.814.525 | ||
| 2017-01-12 |
|
4 | HPP |
Hudson Pacific Properties, Inc.
Common Units |
S - Sale | -23.507 | 0 | -100,00 | 35,00 | -822.745 | ||
| 2017-01-12 |
|
4 | HPP |
Hudson Pacific Properties, Inc.
Common Units |
S - Sale | -4.107 | 0 | -100,00 | 35,00 | -143.745 | ||
| 2017-01-12 |
|
4 | HPP |
Hudson Pacific Properties, Inc.
Common Units |
S - Sale | -659.693 | 0 | -100,00 | 35,00 | -23.089.255 | ||
| 2017-01-12 |
|
4 | HPP |
Hudson Pacific Properties, Inc.
Common Units |
S - Sale | -812.707 | 0 | -100,00 | 35,00 | -28.444.745 | ||
| 2017-01-12 |
|
4 | HPP |
Hudson Pacific Properties, Inc.
Common Units |
S - Sale | -387.643 | 0 | -100,00 | 35,00 | -13.567.505 | ||
| 2017-01-12 |
|
4 | HPP |
Hudson Pacific Properties, Inc.
Common Units |
S - Sale | -1.331.054 | 0 | -100,00 | 35,00 | -46.586.890 | ||
| 2017-01-12 |
|
4 | HPP |
Hudson Pacific Properties, Inc.
Common Units |
S - Sale | -192.137 | 0 | -100,00 | 35,00 | -6.724.795 | ||
| 2017-01-12 |
|
4 | HPP |
Hudson Pacific Properties, Inc.
Common Units |
S - Sale | -468.959 | 0 | -100,00 | 35,00 | -16.413.565 | ||
| 2017-01-12 |
|
4 | HPP |
Hudson Pacific Properties, Inc.
Common Units |
S - Sale | -1.715.068 | 0 | -100,00 | 35,00 | -60.027.380 | ||
| 2017-01-12 |
|
4 | HPP |
Hudson Pacific Properties, Inc.
Common Units |
S - Sale | -667.556 | 0 | -100,00 | 35,00 | -23.364.460 | ||
| 2017-01-12 |
|
4 | HPP |
Hudson Pacific Properties, Inc.
Common Units |
S - Sale | -1.907.396 | 0 | -100,00 | 35,00 | -66.758.860 | ||
| 2017-01-12 |
|
4 | HPP |
Hudson Pacific Properties, Inc.
Common Stock |
S - Sale | -345.053 | 0 | -100,00 | 35,00 | -12.076.855 | ||
| 2017-01-12 |
|
4 | HPP |
Hudson Pacific Properties, Inc.
Common Stock |
S - Sale | -4.313 | 0 | -100,00 | 35,00 | -150.955 | ||
| 2017-01-12 |
|
4 | HPP |
Hudson Pacific Properties, Inc.
Common Stock |
S - Sale | -80.675 | 0 | -100,00 | 35,00 | -2.823.625 | ||
| 2017-01-12 |
|
4 | HPP |
Hudson Pacific Properties, Inc.
Common Stock |
S - Sale | -23.584 | 0 | -100,00 | 35,00 | -825.440 | ||
| 2017-01-12 |
|
4 | HPP |
Hudson Pacific Properties, Inc.
Common Stock |
S - Sale | -4.120 | 0 | -100,00 | 35,00 | -144.200 | ||
| 2017-01-12 |
|
4 | HPP |
Hudson Pacific Properties, Inc.
Common Stock |
S - Sale | -661.829 | 0 | -100,00 | 35,00 | -23.164.015 | ||
| 2017-01-12 |
|
4 | HPP |
Hudson Pacific Properties, Inc.
Common Stock |
S - Sale | -815.338 | 0 | -100,00 | 35,00 | -28.536.830 | ||
| 2017-01-12 |
|
4 | HPP |
Hudson Pacific Properties, Inc.
Common Stock |
S - Sale | -388.898 | 0 | -100,00 | 35,00 | -13.611.430 | ||
| 2017-01-12 |
|
4 | HPP |
Hudson Pacific Properties, Inc.
Common Stock |
S - Sale | -1.335.362 | 0 | -100,00 | 35,00 | -46.737.670 | ||
| 2017-01-12 |
|
4 | HPP |
Hudson Pacific Properties, Inc.
Common Stock |
S - Sale | -192.760 | 0 | -100,00 | 35,00 | -6.746.600 | ||
| 2017-01-12 |
|
4 | HPP |
Hudson Pacific Properties, Inc.
Common Stock |
S - Sale | -470.476 | 0 | -100,00 | 35,00 | -16.466.660 | ||
| 2017-01-12 |
|
4 | HPP |
Hudson Pacific Properties, Inc.
Common Stock |
S - Sale | -1.720.620 | 0 | -100,00 | 35,00 | -60.221.700 | ||
| 2017-01-12 |
|
4 | HPP |
Hudson Pacific Properties, Inc.
Common Stock |
S - Sale | -669.716 | 0 | -100,00 | 35,00 | -23.440.060 | ||
| 2017-01-12 |
|
4 | HPP |
Hudson Pacific Properties, Inc.
Common Stock |
S - Sale | -1.913.567 | 0 | -100,00 | 35,00 | -66.974.845 | ||
| 2016-12-20 |
|
4 | MIK |
Michaels Companies, Inc.
Common Stock |
S - Sale | -306.533 | 980.739 | -23,81 | 22,04 | -6.755.987 | 21.615.488 | |
| 2016-12-20 |
|
4 | MIK |
Michaels Companies, Inc.
Common Stock |
S - Sale | -403.982 | 1.292.525 | -23,81 | 22,04 | -8.903.763 | 28.487.251 | |
| 2016-12-20 |
|
4 | MIK |
Michaels Companies, Inc.
Common Stock |
S - Sale | -27.544 | 88.125 | -23,81 | 22,04 | -607.070 | 1.942.275 | |
| 2016-12-20 |
|
4 | MIK |
Michaels Companies, Inc.
Common Stock |
S - Sale | -129.765 | 415.176 | -23,81 | 22,04 | -2.860.021 | 9.150.479 | |
| 2016-12-20 |
|
4 | MIK |
Michaels Companies, Inc.
Common Stock |
S - Sale | -2.072.133 | 6.629.709 | -23,81 | 22,04 | -45.669.811 | 146.118.786 | |
| 2016-12-20 |
|
4 | MIK |
Michaels Companies, Inc.
Common Stock |
S - Sale | -9.060.043 | 28.987.257 | -23,81 | 22,04 | -199.683.348 | 638.879.144 | |
| 2016-12-20 |
|
4 | STAY |
Extended Stay America, Inc.
Paired Shares |
S - Sale | -13.410 | 86.962 | -13,36 | 16,41 | -220.058 | 1.427.046 | |
| 2016-12-20 |
|
4 | STAY |
Extended Stay America, Inc.
Paired Shares |
S - Sale | -842.203 | 5.535.460 | -13,21 | 16,41 | -13.820.551 | 90.836.899 | |
| 2016-12-20 |
|
4 | STAY |
Extended Stay America, Inc.
Paired Shares |
S - Sale | -1.114.508 | 7.227.208 | -13,36 | 16,41 | -18.289.076 | 118.598.483 | |
| 2016-12-20 |
|
4 | STAY |
Extended Stay America, Inc.
Paired Shares |
S - Sale | -518.453 | 3.361.984 | -13,36 | 16,41 | -8.507.814 | 55.170.157 | |
| 2016-12-20 |
|
4 | STAY |
Extended Stay America, Inc.
Paired Shares |
S - Sale | -5.447 | 35.786 | -13,21 | 16,41 | -89.385 | 587.248 | |
| 2016-12-20 |
|
4 | STAY |
Extended Stay America, Inc.
Paired Shares |
S - Sale | -270.354 | 1.773.639 | -13,23 | 16,41 | -4.436.509 | 29.105.416 | |
| 2016-12-20 |
|
4 | STAY |
Extended Stay America, Inc.
Paired Shares |
S - Sale | -810.613 | 5.317.947 | -13,23 | 16,41 | -13.302.159 | 87.267.510 | |
| 2016-12-20 |
|
4 | STAY |
Extended Stay America, Inc.
Paired Shares |
S - Sale | -800.012 | 5.248.410 | -13,23 | 16,41 | -13.128.197 | 86.126.408 | |
| 2016-12-20 |
|
4 | NONE |
ESH Hospitality, Inc.
Paired Shares |
S - Sale | -13.410 | 86.962 | -13,36 | 16,41 | -220.058 | 1.427.046 | |
| 2016-12-20 |
|
4 | NONE |
ESH Hospitality, Inc.
Paired Shares |
S - Sale | -842.203 | 5.535.460 | -13,21 | 16,41 | -13.820.551 | 90.836.899 | |
| 2016-12-20 |
|
4 | NONE |
ESH Hospitality, Inc.
Paired Shares |
S - Sale | -1.114.508 | 7.227.208 | -13,36 | 16,41 | -18.289.076 | 118.598.483 | |
| 2016-12-20 |
|
4 | NONE |
ESH Hospitality, Inc.
Paired Shares |
S - Sale | -518.453 | 3.361.984 | -13,36 | 16,41 | -8.507.814 | 55.170.157 | |
| 2016-12-20 |
|
4 | NONE |
ESH Hospitality, Inc.
Paired Shares |
S - Sale | -5.447 | 35.786 | -13,21 | 16,41 | -89.385 | 587.248 | |
| 2016-12-20 |
|
4 | NONE |
ESH Hospitality, Inc.
Paired Shares |
S - Sale | -270.354 | 1.773.639 | -13,23 | 16,41 | -4.436.509 | 29.105.416 | |
| 2016-12-20 |
|
4 | NONE |
ESH Hospitality, Inc.
Paired Shares |
S - Sale | -810.613 | 5.317.947 | -13,23 | 16,41 | -13.302.159 | 87.267.510 | |
| 2016-12-20 |
|
4 | NONE |
ESH Hospitality, Inc.
Paired Shares |
S - Sale | -800.012 | 5.248.410 | -13,23 | 16,41 | -13.128.197 | 86.126.408 | |
| 2016-12-13 |
|
4 | UAN |
CVR PARTNERS, LP
Common Units representing Limited Partner Interests |
S - Sale | -20.649 | 3.372.086 | -0,61 | 5,62 | -115.950 | 18.935.275 | |
| 2016-12-13 |
|
4 | UAN |
CVR PARTNERS, LP
Common Units representing Limited Partner Interests |
S - Sale | -29.351 | 4.792.967 | -0,61 | 5,62 | -164.815 | 26.913.948 | |
| 2016-12-13 |
|
4 | UAN |
CVR PARTNERS, LP
Common Units representing Limited Partner Interests |
S - Sale | -20.649 | 3.392.735 | -0,60 | 5,75 | -118.767 | 19.513.994 | |
| 2016-12-13 |
|
4 | UAN |
CVR PARTNERS, LP
Common Units representing Limited Partner Interests |
S - Sale | -29.351 | 4.822.318 | -0,60 | 5,75 | -168.818 | 27.736.526 | |
| 2016-11-30 |
|
4 | HPP |
Hudson Pacific Properties, Inc.
Common Units |
S - Sale | -148.092 | 80.415 | -64,81 | 32,50 | -4.812.990 | 2.613.488 | |
| 2016-11-30 |
|
4 | HPP |
Hudson Pacific Properties, Inc.
Common Units |
S - Sale | -43.292 | 23.507 | -64,81 | 32,50 | -1.406.990 | 763.978 | |
| 2016-11-30 |
|
4 | HPP |
Hudson Pacific Properties, Inc.
Common Units |
S - Sale | -7.564 | 4.107 | -64,81 | 32,50 | -245.830 | 133.478 | |
| 2016-11-30 |
|
4 | HPP |
Hudson Pacific Properties, Inc.
Common Units |
S - Sale | -1.214.894 | 659.693 | -64,81 | 32,50 | -39.484.055 | 21.440.022 | |
| 2016-11-30 |
|
4 | HPP |
Hudson Pacific Properties, Inc.
Common Units |
S - Sale | -1.496.685 | 812.707 | -64,81 | 32,50 | -48.642.262 | 26.412.978 | |
| 2016-11-30 |
|
4 | HPP |
Hudson Pacific Properties, Inc.
Common Units |
S - Sale | -713.884 | 387.643 | -64,81 | 32,50 | -23.201.230 | 12.598.398 | |
| 2016-11-30 |
|
4 | HPP |
Hudson Pacific Properties, Inc.
Common Units |
S - Sale | -2.451.274 | 1.331.054 | -64,81 | 32,50 | -79.666.405 | 43.259.255 | |
| 2016-11-30 |
|
4 | HPP |
Hudson Pacific Properties, Inc.
Common Units |
S - Sale | -354.823 | 192.137 | -64,87 | 32,50 | -11.531.748 | 6.244.452 | |
| 2016-11-30 |
|
4 | HPP |
Hudson Pacific Properties, Inc.
Common Units |
S - Sale | -865.168 | 468.959 | -64,85 | 32,50 | -28.117.960 | 15.241.168 | |
| 2016-11-30 |
|
4 | HPP |
Hudson Pacific Properties, Inc.
Common Units |
S - Sale | -3.164.080 | 1.715.068 | -64,85 | 32,50 | -102.832.600 | 55.739.710 | |
| 2016-11-30 |
|
4 | HPP |
Hudson Pacific Properties, Inc.
Common Units |
S - Sale | -1.231.555 | 667.556 | -64,85 | 32,50 | -40.025.538 | 21.695.570 | |
| 2016-11-30 |
|
4 | HPP |
Hudson Pacific Properties, Inc.
Common Units |
S - Sale | -3.518.893 | 1.907.396 | -64,85 | 32,50 | -114.364.022 | 61.990.370 | |
| 2016-11-30 |
|
4 | HPP |
Hudson Pacific Properties, Inc.
Common Units |
S - Sale | -690.000 | 343.939 | -66,74 | 32,50 | -22.425.000 | 11.178.018 | |
| 2016-11-30 |
|
4 | HPP |
Hudson Pacific Properties, Inc.
Common Units |
S - Sale | -8.624 | 4.299 | -66,73 | 32,50 | -280.280 | 139.718 | |
| 2016-11-30 |
|
4 | HPP |
Hudson Pacific Properties, Inc.
Common Units |
S - Sale | -13.234 | 0 | -100,00 | 32,50 | -430.105 | ||
| 2016-11-30 |
|
4 | HPP |
Hudson Pacific Properties, Inc.
Common Units |
S - Sale | -3.868 | 0 | -100,00 | 32,50 | -125.710 | ||
| 2016-11-30 |
|
4 | HPP |
Hudson Pacific Properties, Inc.
Common Units |
S - Sale | -676 | 0 | -100,00 | 32,50 | -21.970 | ||
| 2016-11-30 |
|
4 | HPP |
Hudson Pacific Properties, Inc.
Common Units |
S - Sale | -108.563 | 0 | -100,00 | 32,50 | -3.528.298 | ||
| 2016-11-30 |
|
4 | HPP |
Hudson Pacific Properties, Inc.
Common Units |
S - Sale | -133.743 | 0 | -100,00 | 32,50 | -4.346.648 | ||
| 2016-11-30 |
|
4 | HPP |
Hudson Pacific Properties, Inc.
Common Units |
S - Sale | -63.793 | 0 | -100,00 | 32,50 | -2.073.272 | ||
| 2016-11-30 |
|
4 | HPP |
Hudson Pacific Properties, Inc.
Common Units |
S - Sale | -219.045 | 0 | -100,00 | 32,50 | -7.118.962 | ||
| 2016-11-30 |
|
4 | HPP |
Hudson Pacific Properties, Inc.
Common Units |
S - Sale | -30.638 | 0 | -100,00 | 32,50 | -995.735 | ||
| 2016-11-30 |
|
4 | HPP |
Hudson Pacific Properties, Inc.
Common Units |
S - Sale | -75.642 | 0 | -100,00 | 32,50 | -2.458.365 | ||
| 2016-11-30 |
|
4 | HPP |
Hudson Pacific Properties, Inc.
Common Units |
S - Sale | -276.637 | 0 | -100,00 | 32,50 | -8.990.702 | ||
| 2016-11-30 |
|
4 | HPP |
Hudson Pacific Properties, Inc.
Common Units |
S - Sale | -107.674 | 0 | -100,00 | 32,50 | -3.499.405 | ||
| 2016-11-30 |
|
4 | HPP |
Hudson Pacific Properties, Inc.
Common Units |
S - Sale | -307.659 | 0 | -100,00 | 32,50 | -9.998.918 | ||
| 2016-11-23 |
|
4 | PFGC |
Performance Food Group Co
Common Stock |
S - Sale | -127.663 | 484.072 | -20,87 | 22,66 | -2.892.844 | 10.969.072 | |
| 2016-11-23 |
|
4 | PFGC |
Performance Food Group Co
Common Stock |
S - Sale | -20.874 | 79.149 | -20,87 | 22,66 | -473.005 | 1.793.516 | |
| 2016-11-23 |
|
4 | PFGC |
Performance Food Group Co
Common Stock |
S - Sale | -103.697 | 393.196 | -20,87 | 22,66 | -2.349.774 | 8.909.821 | |
| 2016-11-23 |
|
4 | PFGC |
Performance Food Group Co
Common Stock |
S - Sale | -1.308.369 | 4.961.066 | -20,87 | 22,66 | -29.647.642 | 112.417.756 | |
| 2016-11-23 |
|
4 | PFGC |
Performance Food Group Co
Common Stock |
S - Sale | -8.167.694 | 30.970.220 | -20,87 | 22,66 | -185.079.946 | 701.785.185 | |
| 2016-11-22 |
|
4 | STAY |
Extended Stay America, Inc.
Paired Shares |
S - Sale | -14.336 | 100.372 | -12,50 | 14,76 | -211.599 | 1.481.491 | |
| 2016-11-22 |
|
4 | STAY |
Extended Stay America, Inc.
Paired Shares |
S - Sale | -899.649 | 6.377.663 | -12,36 | 14,76 | -13.278.819 | 94.134.306 | |
| 2016-11-22 |
|
4 | STAY |
Extended Stay America, Inc.
Paired Shares |
S - Sale | -1.191.456 | 8.341.716 | -12,50 | 14,76 | -17.585.891 | 123.123.728 | |
| 2016-11-22 |
|
4 | STAY |
Extended Stay America, Inc.
Paired Shares |
S - Sale | -554.247 | 3.880.437 | -12,50 | 14,76 | -8.180.686 | 57.275.250 | |
| 2016-11-22 |
|
4 | STAY |
Extended Stay America, Inc.
Paired Shares |
S - Sale | -5.816 | 41.233 | -12,36 | 14,76 | -85.844 | 608.599 | |
| 2016-11-22 |
|
4 | STAY |
Extended Stay America, Inc.
Paired Shares |
S - Sale | -288.826 | 2.043.993 | -12,38 | 14,76 | -4.263.072 | 30.169.337 | |
| 2016-11-22 |
|
4 | STAY |
Extended Stay America, Inc.
Paired Shares |
S - Sale | -865.997 | 6.128.560 | -12,38 | 14,76 | -12.782.116 | 90.457.546 | |
| 2016-11-22 |
|
4 | STAY |
Extended Stay America, Inc.
Paired Shares |
S - Sale | -854.673 | 6.048.422 | -12,38 | 14,76 | -12.614.973 | 89.274.709 | |
| 2016-11-22 |
|
4 | NONE |
ESH Hospitality, Inc.
Paired Shares |
S - Sale | -14.336 | 100.372 | -12,50 | 14,76 | -211.599 | 1.481.491 | |
| 2016-11-22 |
|
4 | NONE |
ESH Hospitality, Inc.
Paired Shares |
S - Sale | -899.649 | 6.377.663 | -12,36 | 14,76 | -13.278.819 | 94.134.306 | |
| 2016-11-22 |
|
4 | NONE |
ESH Hospitality, Inc.
Paired Shares |
S - Sale | -1.191.456 | 8.341.716 | -12,50 | 14,76 | -17.585.891 | 123.123.728 | |
| 2016-11-22 |
|
4 | NONE |
ESH Hospitality, Inc.
Paired Shares |
S - Sale | -554.247 | 3.880.437 | -12,50 | 14,76 | -8.180.686 | 57.275.250 | |
| 2016-11-22 |
|
4 | NONE |
ESH Hospitality, Inc.
Paired Shares |
S - Sale | -5.816 | 41.233 | -12,36 | 14,76 | -85.844 | 608.599 | |
| 2016-11-22 |
|
4 | NONE |
ESH Hospitality, Inc.
Paired Shares |
S - Sale | -288.826 | 2.043.993 | -12,38 | 14,76 | -4.263.072 | 30.169.337 | |
| 2016-11-22 |
|
4 | NONE |
ESH Hospitality, Inc.
Paired Shares |
S - Sale | -865.997 | 6.128.560 | -12,38 | 14,76 | -12.782.116 | 90.457.546 | |
| 2016-11-22 |
|
4 | NONE |
ESH Hospitality, Inc.
Paired Shares |
S - Sale | -854.673 | 6.048.422 | -12,38 | 14,76 | -12.614.973 | 89.274.709 | |
| 2016-11-18 |
|
4 | SUM |
Summit Materials, Inc.
LP Units of Summit Materials Holdings L.P. |
C - Conversion | -12.501 | 0 | -100,00 | ||||
| 2016-11-18 |
|
4 | SUM |
Summit Materials, Inc.
LP Units of Summit Materials Holdings L.P. |
C - Conversion | -21.513 | 0 | -100,00 | ||||
| 2016-11-18 |
|
4 | SUM |
Summit Materials, Inc.
LP Units of Summit Materials Holdings L.P. |
C - Conversion | -253.891 | 0 | -100,00 | ||||
| 2016-11-18 |
|
4 | SUM |
Summit Materials, Inc.
LP Units of Summit Materials Holdings L.P. |
C - Conversion | -2.814.207 | 0 | -100,00 | ||||
| 2016-11-18 |
|
4 | SUM |
Summit Materials, Inc.
LP Units of Summit Materials Holdings L.P. |
C - Conversion | -13.349.610 | 0 | -100,00 | ||||
| 2016-11-18 |
|
4 | SUM |
Summit Materials, Inc.
Class A Common Stock |
S - Sale | -12.501 | 0 | -100,00 | 21,87 | -273.397 | ||
| 2016-11-18 |
|
4 | SUM |
Summit Materials, Inc.
Class A Common Stock |
C - Conversion | 12.501 | 12.501 | |||||
| 2016-11-18 |
|
4 | SUM |
Summit Materials, Inc.
Class A Common Stock |
S - Sale | -21.513 | 0 | -100,00 | 21,87 | -470.489 | ||
| 2016-11-18 |
|
4 | SUM |
Summit Materials, Inc.
Class A Common Stock |
C - Conversion | 21.513 | 21.513 | |||||
| 2016-11-18 |
|
4 | SUM |
Summit Materials, Inc.
Class A Common Stock |
S - Sale | -253.891 | 0 | -100,00 | 21,87 | -5.552.596 | ||
| 2016-11-18 |
|
4 | SUM |
Summit Materials, Inc.
Class A Common Stock |
C - Conversion | 253.891 | 253.891 | |||||
| 2016-11-18 |
|
4 | SUM |
Summit Materials, Inc.
Class A Common Stock |
S - Sale | -2.814.207 | 0 | -100,00 | 21,87 | -61.546.707 | ||
| 2016-11-18 |
|
4 | SUM |
Summit Materials, Inc.
Class A Common Stock |
C - Conversion | 2.814.207 | 2.814.207 | |||||
| 2016-11-18 |
|
4 | SUM |
Summit Materials, Inc.
Class A Common Stock |
S - Sale | -13.349.610 | 0 | -100,00 | 21,87 | -291.955.971 | ||
| 2016-11-18 |
|
4 | SUM |
Summit Materials, Inc.
Class A Common Stock |
C - Conversion | 13.349.610 | 13.349.610 | |||||
| 2016-11-17 |
|
4 | HLT |
Hilton Worldwide Holdings Inc.
Common Stock |
S - Sale | -29.075 | 206.467 | -12,34 | 23,37 | -679.483 | 4.825.134 | |
| 2016-11-17 |
|
4 | HLT |
Hilton Worldwide Holdings Inc.
Common Stock |
S - Sale | -4.959.412 | 34.779.575 | -12,48 | 23,37 | -115.901.458 | 812.798.668 | |
| 2016-11-17 |
|
4 | HLT |
Hilton Worldwide Holdings Inc.
Common Stock |
S - Sale | -172.522 | 1.225.127 | -12,34 | 23,37 | -4.031.839 | 28.631.218 | |
| 2016-11-17 |
|
4 | HLT |
Hilton Worldwide Holdings Inc.
Common Stock |
S - Sale | -10.151 | 72.087 | -12,34 | 23,37 | -237.229 | 1.684.673 | |
| 2016-11-17 |
|
4 | HLT |
Hilton Worldwide Holdings Inc.
Common Stock |
S - Sale | -1.660.485 | 12.039.985 | -12,12 | 23,37 | -38.805.534 | 281.374.449 | |
| 2016-11-17 |
|
4 | HLT |
Hilton Worldwide Holdings Inc.
Common Stock |
S - Sale | -34.135.600 | 349.468.083 | -8,90 | 23,37 | -797.748.972 | 8.167.069.100 | |
| 2016-11-17 |
|
4 | HLT |
Hilton Worldwide Holdings Inc.
Common Stock |
S - Sale | -14.032.755 | 0 | -100,00 | 23,37 | -327.945.484 | ||
| 2016-10-06 |
|
4 | NONE |
ESH Hospitality, Inc.
Paired Shares |
S - Sale | -15.206 | 114.708 | -11,70 | 14,16 | -215.317 | 1.624.265 | |
| 2016-10-06 |
|
4 | NONE |
ESH Hospitality, Inc.
Paired Shares |
S - Sale | -962.659 | 7.277.312 | -11,68 | 14,16 | -13.631.251 | 103.046.738 | |
| 2016-10-06 |
|
4 | NONE |
ESH Hospitality, Inc.
Paired Shares |
S - Sale | -1.263.748 | 9.533.172 | -11,70 | 14,16 | -17.894.672 | 134.989.716 | |
| 2016-10-06 |
|
4 | NONE |
ESH Hospitality, Inc.
Paired Shares |
S - Sale | -587.874 | 4.434.684 | -11,70 | 14,16 | -8.324.296 | 62.795.125 | |
| 2016-10-06 |
|
4 | NONE |
ESH Hospitality, Inc.
Paired Shares |
S - Sale | -6.224 | 47.049 | -11,68 | 14,16 | -88.132 | 666.214 | |
| 2016-10-06 |
|
4 | NONE |
ESH Hospitality, Inc.
Paired Shares |
S - Sale | -308.679 | 2.332.819 | -11,69 | 14,16 | -4.370.895 | 33.032.717 | |
| 2016-10-06 |
|
4 | NONE |
ESH Hospitality, Inc.
Paired Shares |
S - Sale | -925.524 | 6.994.557 | -11,69 | 14,16 | -13.105.420 | 99.042.927 | |
| 2016-10-06 |
|
4 | NONE |
ESH Hospitality, Inc.
Paired Shares |
S - Sale | -913.420 | 6.903.095 | -11,69 | 14,16 | -12.934.027 | 97.747.825 | |
| 2016-10-06 |
|
4 | STAY |
Extended Stay America, Inc.
Paired Shares |
S - Sale | -15.206 | 114.708 | -11,70 | 14,16 | -215.317 | 1.624.265 | |
| 2016-10-06 |
|
4 | STAY |
Extended Stay America, Inc.
Paired Shares |
S - Sale | -962.659 | 7.277.312 | -11,68 | 14,16 | -13.631.251 | 103.046.738 | |
| 2016-10-06 |
|
4 | STAY |
Extended Stay America, Inc.
Paired Shares |
S - Sale | -1.263.748 | 9.533.172 | -11,70 | 14,16 | -17.894.672 | 134.989.716 | |
| 2016-10-06 |
|
4 | STAY |
Extended Stay America, Inc.
Paired Shares |
S - Sale | -587.874 | 4.434.684 | -11,70 | 14,16 | -8.324.296 | 62.795.125 | |
| 2016-10-06 |
|
4 | STAY |
Extended Stay America, Inc.
Paired Shares |
S - Sale | -6.224 | 47.049 | -11,68 | 14,16 | -88.132 | 666.214 | |
| 2016-10-06 |
|
4 | STAY |
Extended Stay America, Inc.
Paired Shares |
S - Sale | -308.679 | 2.332.819 | -11,69 | 14,16 | -4.370.895 | 33.032.717 | |
| 2016-10-06 |
|
4 | STAY |
Extended Stay America, Inc.
Paired Shares |
S - Sale | -925.524 | 6.994.557 | -11,69 | 14,16 | -13.105.420 | 99.042.927 | |
| 2016-10-06 |
|
4 | STAY |
Extended Stay America, Inc.
Paired Shares |
S - Sale | -913.420 | 6.903.095 | -11,69 | 14,16 | -12.934.027 | 97.747.825 | |
| 2016-10-04 | 3 | SD |
SANDRIDGE ENERGY INC
Common Stock |
995.116 | ||||||||
| 2016-10-04 | 3 | SD |
SANDRIDGE ENERGY INC
Common Stock |
951.996 | ||||||||
| 2016-10-04 | 3 | SD |
SANDRIDGE ENERGY INC
Common Stock |
1.382.718 | ||||||||
| 2016-10-04 | 3 | SD |
SANDRIDGE ENERGY INC
Common Stock |
1.122.081 | ||||||||
| 2016-10-04 | 3 | SD |
SANDRIDGE ENERGY INC
Common Stock |
1.047.339 | ||||||||
| 2016-10-04 | 3 | SD |
SANDRIDGE ENERGY INC
Common Stock |
1.047.339 | ||||||||
| 2016-10-04 | 3 | SD |
SANDRIDGE ENERGY INC
Common Stock |
995.116 | ||||||||
| 2016-10-04 | 3 | SD |
SANDRIDGE ENERGY INC
Common Stock |
951.996 | ||||||||
| 2016-10-04 | 3 | SD |
SANDRIDGE ENERGY INC
Common Stock |
1.382.718 | ||||||||
| 2016-10-04 | 3 | SD |
SANDRIDGE ENERGY INC
Common Stock |
1.122.081 | ||||||||
| 2016-10-04 | 3 | SD |
SANDRIDGE ENERGY INC
Common Stock |
1.047.339 | ||||||||
| 2016-10-04 | 3 | SD |
SANDRIDGE ENERGY INC
Common Stock |
1.047.339 | ||||||||
| 2016-09-13 |
|
4 | CTLT |
Catalent, Inc.
Common Stock |
S - Sale | -17.100.705 | 0 | -100,00 | 23,58 | -403.234.624 | ||
| 2016-09-12 | 3 | NONE |
Titan Energy, LLC
Common Shares |
1.003.457 | ||||||||
| 2016-09-12 | 3 | NONE |
Titan Energy, LLC
Common Shares |
1.090.684 | ||||||||
| 2016-09-12 | 3 | NONE |
Titan Energy, LLC
Common Shares |
1.442.636 | ||||||||
| 2016-09-12 | 3 | NONE |
Titan Energy, LLC
Common Shares |
1.061.139 | ||||||||
| 2016-09-12 | 3 | NONE |
Titan Energy, LLC
Common Shares |
1.108.139 | ||||||||
| 2016-09-12 | 3 | NONE |
Titan Energy, LLC
Common Shares |
1.040.179 | ||||||||
| 2016-09-12 | 3 | NONE |
Titan Energy, LLC
Common Shares |
1.046.878 | ||||||||
| 2016-09-12 | 3 | NONE |
Titan Energy, LLC
Common Shares |
1.003.457 | ||||||||
| 2016-09-12 | 3 | NONE |
Titan Energy, LLC
Common Shares |
1.090.684 | ||||||||
| 2016-09-12 | 3 | NONE |
Titan Energy, LLC
Common Shares |
1.442.636 | ||||||||
| 2016-09-12 | 3 | NONE |
Titan Energy, LLC
Common Shares |
1.061.139 | ||||||||
| 2016-09-12 | 3 | NONE |
Titan Energy, LLC
Common Shares |
1.108.139 | ||||||||
| 2016-09-12 | 3 | NONE |
Titan Energy, LLC
Common Shares |
1.040.179 | ||||||||
| 2016-09-12 | 3 | NONE |
Titan Energy, LLC
Common Shares |
1.046.878 | ||||||||
| 2016-08-18 |
|
4 | BRX |
Brixmor Property Group Inc.
Common Units of Brixmor Operating Partnership LP |
C - Conversion | -1.622.312 | 0 | -100,00 | ||||
| 2016-08-18 |
|
4 | BRX |
Brixmor Property Group Inc.
Common Units of Brixmor Operating Partnership LP |
C - Conversion | -268.738 | 0 | -100,00 | ||||
| 2016-08-18 |
|
4 | BRX |
Brixmor Property Group Inc.
Common Stock |
S - Sale | -6.605 | 0 | -100,00 | 27,30 | -180.316 | ||
| 2016-08-18 |
|
4 | BRX |
Brixmor Property Group Inc.
Common Stock |
S - Sale | -1.286 | 0 | -100,00 | 27,30 | -35.108 | ||
| 2016-08-18 |
|
4 | BRX |
Brixmor Property Group Inc.
Common Stock |
S - Sale | -963.517 | 0 | -100,00 | 27,30 | -26.304.014 | ||
| 2016-08-18 |
|
4 | BRX |
Brixmor Property Group Inc.
Common Stock |
S - Sale | -61.424 | 0 | -100,00 | 27,30 | -1.676.875 | ||
| 2016-08-18 |
|
4 | BRX |
Brixmor Property Group Inc.
Common Stock |
S - Sale | -35.802 | 0 | -100,00 | 27,30 | -977.395 | ||
| 2016-08-18 |
|
4 | BRX |
Brixmor Property Group Inc.
Common Stock |
S - Sale | -4.822.187 | 0 | -100,00 | 27,30 | -131.645.705 | ||
| 2016-08-18 |
|
4 | BRX |
Brixmor Property Group Inc.
Common Stock |
S - Sale | -2.241.198 | 0 | -100,00 | 27,30 | -61.184.705 | ||
| 2016-08-18 |
|
4 | BRX |
Brixmor Property Group Inc.
Common Stock |
S - Sale | -20.986.898 | 0 | -100,00 | 27,30 | -572.942.315 | ||
| 2016-08-18 |
|
4 | BRX |
Brixmor Property Group Inc.
Common Stock |
S - Sale | -934.828 | 341.326 | -73,25 | 27,30 | -25.520.804 | 9.318.200 | |
| 2016-08-18 |
|
4 | BRX |
Brixmor Property Group Inc.
Common Stock |
S - Sale | -461.453 | 114.259 | -80,15 | 27,30 | -12.597.667 | 3.119.271 | |
| 2016-08-18 |
|
4 | BRX |
Brixmor Property Group Inc.
Common Stock |
S - Sale | -9.993.752 | 0 | -100,00 | 27,30 | -272.829.430 | ||
| 2016-08-18 |
|
4 | BRX |
Brixmor Property Group Inc.
Common Stock |
S - Sale | -1.622.312 | 0 | -100,00 | 27,30 | -44.289.118 | ||
| 2016-08-18 |
|
4 | BRX |
Brixmor Property Group Inc.
Common Stock |
S - Sale | -268.738 | 0 | -100,00 | 27,30 | -7.336.547 | ||
| 2016-08-18 |
|
4 | BRX |
Brixmor Property Group Inc.
Common Stock |
C - Conversion | 1.622.312 | 1.622.312 | |||||
| 2016-08-18 |
|
4 | BRX |
Brixmor Property Group Inc.
Common Stock |
C - Conversion | 268.738 | 268.738 | |||||
| 2016-08-18 |
|
4 | BRX |
Brixmor Property Group Inc.
Common Stock |
P - Purchase | 426.960 | 0 | -100,00 | 28,30 | 12.082.968 | ||
| 2016-08-18 |
|
4 | BRX |
Brixmor Property Group Inc.
Common Stock |
S - Sale | -31.800 | 0 | -100,00 | 25,95 | -825.210 | ||
| 2016-08-18 |
|
4 | BRX |
Brixmor Property Group Inc.
Common Stock |
S - Sale | -66.037 | 0 | -100,00 | 25,73 | -1.699.132 | ||
| 2016-08-18 |
|
4 | BRX |
Brixmor Property Group Inc.
Common Stock |
S - Sale | -23.275 | 0 | -100,00 | 24,74 | -575.824 | ||
| 2016-08-18 |
|
4 | BRX |
Brixmor Property Group Inc.
Common Stock |
S - Sale | -63.325 | 0 | -100,00 | 25,07 | -1.587.558 | ||
| 2016-08-18 |
|
4 | BRX |
Brixmor Property Group Inc.
Common Stock |
P - Purchase | 62.221 | 0 | -100,00 | 26,57 | 1.653.212 | ||
| 2016-08-18 |
|
4 | BRX |
Brixmor Property Group Inc.
Common Stock |
S - Sale | -46.972 | 0 | -100,00 | 25,56 | -1.200.604 | ||
| 2016-08-18 |
|
4 | BRX |
Brixmor Property Group Inc.
Common Stock |
S - Sale | -104.228 | 0 | -100,00 | 25,31 | -2.638.011 | ||
| 2016-08-18 |
|
4 | BRX |
Brixmor Property Group Inc.
Common Stock |
S - Sale | -153.544 | 0 | -100,00 | 25,38 | -3.896.947 | ||
| 2016-08-09 |
|
4 | BRX |
Brixmor Property Group Inc.
Common Units of Brixmor Operating Partnership LP |
C - Conversion | -1.135.660 | 1.622.312 | -41,18 | ||||
| 2016-08-09 |
|
4 | BRX |
Brixmor Property Group Inc.
Common Units of Brixmor Operating Partnership LP |
C - Conversion | -188.124 | 268.738 | -41,18 | ||||
| 2016-08-09 |
|
4 | BRX |
Brixmor Property Group Inc.
Common Stock |
S - Sale | -4.624 | 6.605 | -41,18 | 27,43 | -126.836 | 181.175 | |
| 2016-08-09 |
|
4 | BRX |
Brixmor Property Group Inc.
Common Stock |
S - Sale | -901 | 1.286 | -41,20 | 27,43 | -24.714 | 35.275 | |
| 2016-08-09 |
|
4 | BRX |
Brixmor Property Group Inc.
Common Stock |
S - Sale | -674.487 | 963.517 | -41,18 | 27,43 | -18.501.178 | 26.429.271 | |
| 2016-08-09 |
|
4 | BRX |
Brixmor Property Group Inc.
Common Stock |
S - Sale | -43.518 | 61.424 | -41,47 | 27,43 | -1.193.699 | 1.684.860 | |
| 2016-08-09 |
|
4 | BRX |
Brixmor Property Group Inc.
Common Stock |
S - Sale | -25.367 | 35.802 | -41,47 | 27,43 | -695.817 | 982.049 | |
| 2016-08-09 |
|
4 | BRX |
Brixmor Property Group Inc.
Common Stock |
S - Sale | -3.416.529 | 4.822.187 | -41,47 | 27,43 | -93.715.390 | 132.272.589 | |
| 2016-08-09 |
|
4 | BRX |
Brixmor Property Group Inc.
Common Stock |
S - Sale | -1.587.894 | 2.241.198 | -41,47 | 27,43 | -43.555.932 | 61.476.061 | |
| 2016-08-09 |
|
4 | BRX |
Brixmor Property Group Inc.
Common Stock |
S - Sale | -15.524.003 | 20.986.898 | -42,52 | 27,43 | -425.823.402 | 575.670.612 | |
| 2016-08-09 |
|
4 | BRX |
Brixmor Property Group Inc.
Common Stock |
S - Sale | -7.398.893 | 9.993.752 | -42,54 | 27,43 | -202.951.635 | 274.128.617 | |
| 2016-08-09 |
|
4 | BRX |
Brixmor Property Group Inc.
Common Stock |
S - Sale | -1.135.660 | 0 | -100,00 | 27,43 | -31.151.154 | ||
| 2016-08-09 |
|
4 | BRX |
Brixmor Property Group Inc.
Common Stock |
S - Sale | -188.124 | 0 | -100,00 | 27,43 | -5.160.241 | ||
| 2016-08-09 |
|
4 | BRX |
Brixmor Property Group Inc.
Common Stock |
C - Conversion | 1.135.660 | 1.135.660 | |||||
| 2016-08-09 |
|
4 | BRX |
Brixmor Property Group Inc.
Common Stock |
C - Conversion | 188.124 | 188.124 | |||||
| 2016-08-09 |
|
4 | BRX |
Brixmor Property Group Inc.
Common Stock |
G - Gift | -24.875 | 36.243 | -40,70 | ||||
| 2016-07-21 |
|
4 | SUM |
Summit Materials, Inc.
LP Units of Summit Materials Holdings L.P. |
C - Conversion | -9.278 | 12.501 | -42,60 | ||||
| 2016-07-21 |
|
4 | SUM |
Summit Materials, Inc.
LP Units of Summit Materials Holdings L.P. |
C - Conversion | -15.966 | 21.513 | -42,60 | ||||
| 2016-07-21 |
|
4 | SUM |
Summit Materials, Inc.
LP Units of Summit Materials Holdings L.P. |
C - Conversion | -188.427 | 253.891 | -42,60 | ||||
| 2016-07-21 |
|
4 | SUM |
Summit Materials, Inc.
LP Units of Summit Materials Holdings L.P. |
C - Conversion | -2.088.574 | 2.814.207 | -42,60 | ||||
| 2016-07-21 |
|
4 | SUM |
Summit Materials, Inc.
LP Units of Summit Materials Holdings L.P. |
C - Conversion | -9.907.459 | 13.349.610 | -42,60 | ||||
| 2016-07-21 |
|
4 | SUM |
Summit Materials, Inc.
Class A Common Stock |
S - Sale | -9.278 | 0 | -100,00 | 20,67 | -191.776 | ||
| 2016-07-21 |
|
4 | SUM |
Summit Materials, Inc.
Class A Common Stock |
C - Conversion | 9.278 | 9.278 | |||||
| 2016-07-21 |
|
4 | SUM |
Summit Materials, Inc.
Class A Common Stock |
S - Sale | -15.966 | 0 | -100,00 | 20,67 | -330.017 | ||
| 2016-07-21 |
|
4 | SUM |
Summit Materials, Inc.
Class A Common Stock |
C - Conversion | 15.966 | 15.966 | |||||
| 2016-07-21 |
|
4 | SUM |
Summit Materials, Inc.
Class A Common Stock |
S - Sale | -188.427 | 0 | -100,00 | 20,67 | -3.894.786 | ||
| 2016-07-21 |
|
4 | SUM |
Summit Materials, Inc.
Class A Common Stock |
C - Conversion | 188.427 | 188.427 | |||||
| 2016-07-21 |
|
4 | SUM |
Summit Materials, Inc.
Class A Common Stock |
S - Sale | -2.088.574 | 0 | -100,00 | 20,67 | -43.170.825 | ||
| 2016-07-21 |
|
4 | SUM |
Summit Materials, Inc.
Class A Common Stock |
C - Conversion | 2.088.574 | 2.088.574 | |||||
| 2016-07-21 |
|
4 | SUM |
Summit Materials, Inc.
Class A Common Stock |
S - Sale | -9.907.459 | 0 | -100,00 | 20,67 | -204.787.178 | ||
| 2016-07-21 |
|
4 | SUM |
Summit Materials, Inc.
Class A Common Stock |
C - Conversion | 9.907.459 | 9.907.459 | |||||
| 2016-07-21 |
|
4 | HPP |
Hudson Pacific Properties, Inc.
Common Units |
S - Sale | -760.000 | 1.033.939 | -42,36 | 30,32 | -23.043.200 | 31.349.030 | |
| 2016-07-21 |
|
4 | HPP |
Hudson Pacific Properties, Inc.
Common Units |
S - Sale | -9.500 | 12.923 | -42,37 | 30,32 | -288.040 | 391.825 | |
| 2016-07-21 |
|
4 | HPP |
Hudson Pacific Properties, Inc.
Common Units |
S - Sale | -177.693 | 13.234 | -93,07 | 30,32 | -5.387.652 | 401.255 | |
| 2016-07-21 |
|
4 | HPP |
Hudson Pacific Properties, Inc.
Common Units |
S - Sale | -51.945 | 3.868 | -93,07 | 30,32 | -1.574.972 | 117.278 | |
| 2016-07-21 |
|
4 | HPP |
Hudson Pacific Properties, Inc.
Common Units |
S - Sale | -9.075 | 676 | -93,07 | 30,32 | -275.154 | 20.496 | |
| 2016-07-21 |
|
4 | HPP |
Hudson Pacific Properties, Inc.
Common Units |
S - Sale | -1.457.720 | 108.563 | -93,07 | 30,32 | -44.198.070 | 3.291.630 | |
| 2016-07-21 |
|
4 | HPP |
Hudson Pacific Properties, Inc.
Common Units |
S - Sale | -1.795.834 | 133.743 | -93,07 | 30,32 | -54.449.687 | 4.055.088 | |
| 2016-07-21 |
|
4 | HPP |
Hudson Pacific Properties, Inc.
Common Units |
S - Sale | -856.572 | 63.793 | -93,07 | 30,32 | -25.971.263 | 1.934.204 | |
| 2016-07-21 |
|
4 | HPP |
Hudson Pacific Properties, Inc.
Common Units |
S - Sale | -2.941.221 | 219.045 | -93,07 | 30,32 | -89.177.821 | 6.641.444 | |
| 2016-07-21 |
|
4 | HPP |
Hudson Pacific Properties, Inc.
Common Units |
S - Sale | -424.566 | 30.638 | -93,27 | 30,32 | -12.872.841 | 928.944 | |
| 2016-07-21 |
|
4 | HPP |
Hudson Pacific Properties, Inc.
Common Units |
S - Sale | -1.036.254 | 75.642 | -93,20 | 30,32 | -31.419.221 | 2.293.465 | |
| 2016-07-21 |
|
4 | HPP |
Hudson Pacific Properties, Inc.
Common Units |
S - Sale | -3.789.775 | 276.637 | -93,20 | 30,32 | -114.905.978 | 8.387.634 | |
| 2016-07-21 |
|
4 | HPP |
Hudson Pacific Properties, Inc.
Common Units |
S - Sale | -1.475.093 | 107.674 | -93,20 | 30,32 | -44.724.820 | 3.264.676 | |
| 2016-07-21 |
|
4 | HPP |
Hudson Pacific Properties, Inc.
Common Units |
S - Sale | -4.214.752 | 307.659 | -93,20 | 30,32 | -127.791.281 | 9.328.221 | |
| 2016-07-20 |
|
4 | MIK |
Michaels Companies, Inc.
Common Stock |
S - Sale | -140.494 | 1.287.272 | -9,84 | 27,71 | -3.893.089 | 35.670.307 | |
| 2016-07-20 |
|
4 | MIK |
Michaels Companies, Inc.
Common Stock |
S - Sale | -185.158 | 1.696.507 | -9,84 | 27,71 | -5.130.728 | 47.010.209 | |
| 2016-07-20 |
|
4 | MIK |
Michaels Companies, Inc.
Common Stock |
S - Sale | -12.624 | 115.669 | -9,84 | 27,71 | -349.811 | 3.205.188 | |
| 2016-07-20 |
|
4 | MIK |
Michaels Companies, Inc.
Common Stock |
S - Sale | -59.475 | 554.941 | -9,68 | 27,71 | -1.648.052 | 15.377.415 | |
| 2016-07-20 |
|
4 | MIK |
Michaels Companies, Inc.
Common Stock |
S - Sale | -949.728 | 8.701.842 | -9,84 | 27,71 | -26.316.963 | 241.128.042 | |
| 2016-07-20 |
|
4 | MIK |
Michaels Companies, Inc.
Common Stock |
S - Sale | -4.152.521 | 38.047.300 | -9,84 | 27,71 | -115.066.357 | 1.054.290.683 | |
| 2016-07-08 |
|
4 | BRX |
Brixmor Property Group Inc.
Common Units of Brixmor Operating Partnership LP |
C - Conversion | -755.710 | 2.757.972 | -21,51 | ||||
| 2016-07-08 |
|
4 | BRX |
Brixmor Property Group Inc.
Common Units of Brixmor Operating Partnership LP |
C - Conversion | -125.185 | 456.862 | -21,51 | ||||
| 2016-07-08 |
|
4 | BRX |
Brixmor Property Group Inc.
Common Stock |
S - Sale | -3.077 | 11.229 | -21,51 | 26,01 | -80.033 | 292.066 | |
| 2016-07-08 |
|
4 | BRX |
Brixmor Property Group Inc.
Common Stock |
S - Sale | -599 | 2.187 | -21,50 | 26,01 | -15.580 | 56.884 | |
| 2016-07-08 |
|
4 | BRX |
Brixmor Property Group Inc.
Common Stock |
S - Sale | -448.828 | 1.638.004 | -21,51 | 26,01 | -11.674.016 | 42.604.484 | |
| 2016-07-08 |
|
4 | BRX |
Brixmor Property Group Inc.
Common Stock |
S - Sale | -29.169 | 104.942 | -21,75 | 26,01 | -758.686 | 2.729.541 | |
| 2016-07-08 |
|
4 | BRX |
Brixmor Property Group Inc.
Common Stock |
S - Sale | -17.001 | 61.169 | -21,75 | 26,01 | -442.196 | 1.591.006 | |
| 2016-07-08 |
|
4 | BRX |
Brixmor Property Group Inc.
Common Stock |
S - Sale | -2.289.929 | 8.238.716 | -21,75 | 26,01 | -59.561.053 | 214.289.003 | |
| 2016-07-08 |
|
4 | BRX |
Brixmor Property Group Inc.
Common Stock |
S - Sale | -1.064.286 | 3.829.092 | -21,75 | 26,01 | -27.682.079 | 99.594.683 | |
| 2016-07-08 |
|
4 | BRX |
Brixmor Property Group Inc.
Common Stock |
S - Sale | -10.333.989 | 36.510.901 | -22,06 | 26,01 | -268.787.054 | 949.648.535 | |
| 2016-07-08 |
|
4 | BRX |
Brixmor Property Group Inc.
Common Stock |
S - Sale | -4.932.227 | 17.392.645 | -22,09 | 26,01 | -128.287.224 | 452.382.696 | |
| 2016-07-08 |
|
4 | BRX |
Brixmor Property Group Inc.
Common Stock |
S - Sale | -755.710 | 0 | -100,00 | 26,01 | -19.656.017 | ||
| 2016-07-08 |
|
4 | BRX |
Brixmor Property Group Inc.
Common Stock |
S - Sale | -125.185 | 0 | -100,00 | 26,01 | -3.256.062 | ||
| 2016-07-08 |
|
4 | BRX |
Brixmor Property Group Inc.
Common Stock |
C - Conversion | 755.710 | 755.710 | |||||
| 2016-07-08 |
|
4 | BRX |
Brixmor Property Group Inc.
Common Stock |
C - Conversion | 125.185 | 125.185 | |||||
| 2016-06-13 |
|
4 | CTLT |
Catalent, Inc.
Common Stock |
S - Sale | -8.785.539 | 17.100.705 | -33,94 | 24,51 | -215.333.561 | 419.138.280 | |
| 2016-06-01 |
|
4 | PFGC |
Performance Food Group Co
Common Stock |
S - Sale | -22.979 | 611.735 | -3,62 | 23,34 | -536.344 | 14.278.262 | |
| 2016-06-01 |
|
4 | PFGC |
Performance Food Group Co
Common Stock |
S - Sale | -3.757 | 100.023 | -3,62 | 23,34 | -87.691 | 2.334.597 | |
| 2016-06-01 |
|
4 | PFGC |
Performance Food Group Co
Common Stock |
S - Sale | -18.666 | 496.893 | -3,62 | 23,34 | -435.676 | 11.597.781 | |
| 2016-06-01 |
|
4 | PFGC |
Performance Food Group Co
Common Stock |
S - Sale | -235.507 | 6.269.435 | -3,62 | 23,34 | -5.496.875 | 146.332.375 | |
| 2016-06-01 |
|
4 | PFGC |
Performance Food Group Co
Common Stock |
S - Sale | -1.470.185 | 39.137.914 | -3,62 | 23,34 | -34.315.000 | 913.502.396 | |
| 2016-05-26 |
|
4 | PFGC |
Performance Food Group Co
Common Stock |
S - Sale | -153.195 | 634.714 | -19,44 | 23,34 | -3.575.663 | 14.814.606 | |
| 2016-05-26 |
|
4 | PFGC |
Performance Food Group Co
Common Stock |
S - Sale | -25.049 | 103.780 | -19,44 | 23,34 | -584.659 | 2.422.287 | |
| 2016-05-26 |
|
4 | PFGC |
Performance Food Group Co
Common Stock |
S - Sale | -124.436 | 515.559 | -19,44 | 23,34 | -2.904.411 | 12.033.456 | |
| 2016-05-26 |
|
4 | PFGC |
Performance Food Group Co
Common Stock |
S - Sale | -1.570.043 | 6.504.942 | -19,44 | 23,34 | -36.645.746 | 151.829.249 | |
| 2016-05-26 |
|
4 | PFGC |
Performance Food Group Co
Common Stock |
S - Sale | -9.801.233 | 40.608.099 | -19,44 | 23,34 | -228.766.659 | 947.817.396 | |
| 2016-05-16 |
|
4 | HPP |
Hudson Pacific Properties, Inc.
Common Units |
S - Sale | -400.000 | 1.793.939 | -18,23 | 29,08 | -11.632.000 | 52.167.746 | |
| 2016-05-16 |
|
4 | HPP |
Hudson Pacific Properties, Inc.
Common Units |
S - Sale | -5.000 | 22.423 | -18,23 | 29,08 | -145.400 | 652.061 | |
| 2016-05-16 |
|
4 | HPP |
Hudson Pacific Properties, Inc.
Common Units |
S - Sale | -93.522 | 190.927 | -32,88 | 29,08 | -2.719.620 | 5.552.157 | |
| 2016-05-16 |
|
4 | HPP |
Hudson Pacific Properties, Inc.
Common Units |
S - Sale | -27.339 | 55.813 | -32,88 | 29,08 | -795.018 | 1.623.042 | |
| 2016-05-16 |
|
4 | HPP |
Hudson Pacific Properties, Inc.
Common Units |
S - Sale | -4.777 | 9.751 | -32,88 | 29,08 | -138.915 | 283.559 | |
| 2016-05-16 |
|
4 | HPP |
Hudson Pacific Properties, Inc.
Common Units |
S - Sale | -767.221 | 1.566.283 | -32,88 | 29,08 | -22.310.787 | 45.547.510 | |
| 2016-05-16 |
|
4 | HPP |
Hudson Pacific Properties, Inc.
Common Units |
S - Sale | -945.176 | 1.929.577 | -32,88 | 29,08 | -27.485.718 | 56.112.099 | |
| 2016-05-16 |
|
4 | HPP |
Hudson Pacific Properties, Inc.
Common Units |
S - Sale | -450.827 | 920.365 | -32,88 | 29,08 | -13.110.049 | 26.764.214 | |
| 2016-05-16 |
|
4 | HPP |
Hudson Pacific Properties, Inc.
Common Units |
S - Sale | -1.548.011 | 3.160.266 | -32,88 | 29,08 | -45.016.160 | 91.900.535 | |
| 2016-05-16 |
|
4 | HPP |
Hudson Pacific Properties, Inc.
Common Units |
S - Sale | -223.455 | 455.204 | -32,93 | 29,08 | -6.498.071 | 13.237.332 | |
| 2016-05-16 |
|
4 | HPP |
Hudson Pacific Properties, Inc.
Common Units |
S - Sale | -545.397 | 1.111.896 | -32,91 | 29,08 | -15.860.145 | 32.333.936 | |
| 2016-05-16 |
|
4 | HPP |
Hudson Pacific Properties, Inc.
Common Units |
S - Sale | -1.994.618 | 4.066.412 | -32,91 | 29,08 | -58.003.491 | 118.251.261 | |
| 2016-05-16 |
|
4 | HPP |
Hudson Pacific Properties, Inc.
Common Units |
S - Sale | -776.365 | 1.582.767 | -32,91 | 29,08 | -22.576.694 | 46.026.864 | |
| 2016-05-16 |
|
4 | HPP |
Hudson Pacific Properties, Inc.
Common Units |
S - Sale | -2.218.292 | 4.522.411 | -32,91 | 29,08 | -64.507.931 | 131.511.712 | |
| 2016-05-06 |
|
4 | BRX |
Brixmor Property Group Inc.
Common Units of Brixmor Operating Partnership LP |
C - Conversion | -755.388 | 3.513.682 | -17,69 | ||||
| 2016-05-06 |
|
4 | BRX |
Brixmor Property Group Inc.
Common Units of Brixmor Operating Partnership LP |
C - Conversion | -125.131 | 582.047 | -17,69 | ||||
| 2016-05-06 |
|
4 | BRX |
Brixmor Property Group Inc.
Common Stock |
S - Sale | -3.075 | 14.306 | -17,69 | 25,13 | -77.275 | 359.510 | |
| 2016-05-06 |
|
4 | BRX |
Brixmor Property Group Inc.
Common Stock |
S - Sale | -599 | 2.786 | -17,70 | 25,13 | -15.053 | 70.012 | |
| 2016-05-06 |
|
4 | BRX |
Brixmor Property Group Inc.
Common Stock |
S - Sale | -448.637 | 2.086.832 | -17,69 | 25,13 | -11.274.248 | 52.442.088 | |
| 2016-05-06 |
|
4 | BRX |
Brixmor Property Group Inc.
Common Stock |
S - Sale | -28.720 | 134.111 | -17,64 | 25,13 | -721.734 | 3.370.209 | |
| 2016-05-06 |
|
4 | BRX |
Brixmor Property Group Inc.
Common Stock |
S - Sale | -16.741 | 78.170 | -17,64 | 25,13 | -420.701 | 1.964.412 | |
| 2016-05-06 |
|
4 | BRX |
Brixmor Property Group Inc.
Common Stock |
S - Sale | -2.254.721 | 10.528.645 | -17,64 | 25,13 | -56.661.139 | 264.584.849 | |
| 2016-05-06 |
|
4 | BRX |
Brixmor Property Group Inc.
Common Stock |
S - Sale | -1.047.922 | 4.893.378 | -17,64 | 25,13 | -26.334.280 | 122.970.589 | |
| 2016-05-06 |
|
4 | BRX |
Brixmor Property Group Inc.
Common Stock |
S - Sale | -10.386.256 | 46.844.890 | -18,15 | 25,13 | -261.006.613 | 1.177.212.086 | |
| 2016-05-06 |
|
4 | BRX |
Brixmor Property Group Inc.
Common Stock |
S - Sale | -4.932.810 | 22.324.872 | -18,10 | 25,13 | -123.961.515 | 561.024.033 | |
| 2016-05-06 |
|
4 | BRX |
Brixmor Property Group Inc.
Common Stock |
S - Sale | -755.388 | 0 | -100,00 | 25,13 | -18.982.900 | ||
| 2016-05-06 |
|
4 | BRX |
Brixmor Property Group Inc.
Common Stock |
S - Sale | -125.131 | 0 | -100,00 | 25,13 | -3.144.542 | ||
| 2016-05-06 |
|
4 | BRX |
Brixmor Property Group Inc.
Common Stock |
C - Conversion | 755.388 | 755.388 | |||||
| 2016-05-06 |
|
4 | BRX |
Brixmor Property Group Inc.
Common Stock |
C - Conversion | 125.131 | 125.131 | |||||
| 2016-05-06 |
|
4 | BRX |
Brixmor Property Group Inc.
Common Stock |
G - Gift | -47.108 | 24.875 | -65,44 | ||||
| 2016-04-21 |
|
4 | SUM |
Summit Materials, Inc.
LP Units of Summit Materials Holdings L.P. |
C - Conversion | -7.047 | 21.779 | -24,45 | ||||
| 2016-04-21 |
|
4 | SUM |
Summit Materials, Inc.
LP Units of Summit Materials Holdings L.P. |
C - Conversion | -12.126 | 37.479 | -24,45 | ||||
| 2016-04-21 |
|
4 | SUM |
Summit Materials, Inc.
LP Units of Summit Materials Holdings L.P. |
C - Conversion | -143.097 | 442.318 | -24,44 | ||||
| 2016-04-21 |
|
4 | SUM |
Summit Materials, Inc.
LP Units of Summit Materials Holdings L.P. |
C - Conversion | -1.586.120 | 4.902.781 | -24,44 | ||||
| 2016-04-21 |
|
4 | SUM |
Summit Materials, Inc.
LP Units of Summit Materials Holdings L.P. |
C - Conversion | -7.523.988 | 23.257.069 | -24,44 | ||||
| 2016-04-21 |
|
4 | SUM |
Summit Materials, Inc.
Class A Common Stock |
S - Sale | -7.047 | 0 | -100,00 | 20,00 | -140.940 | ||
| 2016-04-21 |
|
4 | SUM |
Summit Materials, Inc.
Class A Common Stock |
C - Conversion | 7.047 | 7.047 | |||||
| 2016-04-21 |
|
4 | SUM |
Summit Materials, Inc.
Class A Common Stock |
S - Sale | -12.126 | 0 | -100,00 | 20,00 | -242.520 | ||
| 2016-04-21 |
|
4 | SUM |
Summit Materials, Inc.
Class A Common Stock |
C - Conversion | 12.126 | 12.126 | |||||
| 2016-04-21 |
|
4 | SUM |
Summit Materials, Inc.
Class A Common Stock |
S - Sale | -143.097 | 0 | -100,00 | 20,00 | -2.861.940 | ||
| 2016-04-21 |
|
4 | SUM |
Summit Materials, Inc.
Class A Common Stock |
C - Conversion | 143.097 | 143.097 | |||||
| 2016-04-21 |
|
4 | SUM |
Summit Materials, Inc.
Class A Common Stock |
S - Sale | -1.586.120 | 0 | -100,00 | 20,00 | -31.722.400 | ||
| 2016-04-21 |
|
4 | SUM |
Summit Materials, Inc.
Class A Common Stock |
C - Conversion | 1.586.120 | 1.586.120 | |||||
| 2016-04-21 |
|
4 | SUM |
Summit Materials, Inc.
Class A Common Stock |
S - Sale | -7.523.988 | 0 | -100,00 | 20,00 | -150.479.760 | ||
| 2016-04-21 |
|
4 | SUM |
Summit Materials, Inc.
Class A Common Stock |
C - Conversion | 7.523.988 | 7.523.988 | |||||
| 2016-04-11 | 3 | UAN |
CVR PARTNERS, LP
Common Units representing Limited Partner Interests |
18.609.706 | ||||||||
| 2016-04-11 | 3 | UAN |
CVR PARTNERS, LP
Common Units representing Limited Partner Interests |
17.625.348 | ||||||||
| 2016-04-11 | 3 | UAN |
CVR PARTNERS, LP
Common Units representing Limited Partner Interests |
17.625.808 | ||||||||
| 2016-04-11 | 3 | UAN |
CVR PARTNERS, LP
Common Units representing Limited Partner Interests |
19.115.513 | ||||||||
| 2016-04-11 | 3 | UAN |
CVR PARTNERS, LP
Common Units representing Limited Partner Interests |
18.133.335 | ||||||||
| 2016-04-11 | 3 | UAN |
CVR PARTNERS, LP
Common Units representing Limited Partner Interests |
19.625.237 | ||||||||
| 2016-04-11 | 3 | UAN |
CVR PARTNERS, LP
Common Units representing Limited Partner Interests |
21.851.669 | ||||||||
| 2016-04-11 | 3 | UAN |
CVR PARTNERS, LP
Common Units representing Limited Partner Interests |
20.413.384 | ||||||||
| 2016-04-11 | 3 | UAN |
CVR PARTNERS, LP
Common Units representing Limited Partner Interests |
18.609.706 | ||||||||
| 2016-04-11 | 3 | UAN |
CVR PARTNERS, LP
Common Units representing Limited Partner Interests |
17.625.348 | ||||||||
| 2016-04-11 | 3 | UAN |
CVR PARTNERS, LP
Common Units representing Limited Partner Interests |
17.625.808 | ||||||||
| 2016-04-11 | 3 | UAN |
CVR PARTNERS, LP
Common Units representing Limited Partner Interests |
19.115.513 | ||||||||
| 2016-04-11 | 3 | UAN |
CVR PARTNERS, LP
Common Units representing Limited Partner Interests |
18.133.335 | ||||||||
| 2016-04-11 | 3 | UAN |
CVR PARTNERS, LP
Common Units representing Limited Partner Interests |
19.625.237 | ||||||||
| 2016-04-11 | 3 | UAN |
CVR PARTNERS, LP
Common Units representing Limited Partner Interests |
21.851.669 | ||||||||
| 2016-04-11 | 3 | UAN |
CVR PARTNERS, LP
Common Units representing Limited Partner Interests |
20.413.384 | ||||||||
| 2016-04-05 |
|
4 | RTK |
RENTECH, INC.
Call Right (Obligation to Buy) |
E - Other | -806.306 | 0 | -100,00 | ||||
| 2016-04-05 |
|
4 | RTK |
RENTECH, INC.
Call Right (Obligation to Sell) |
E - Other | 17.900 | 0 | -100,00 | ||||
| 2016-04-05 |
|
4 | RTK |
RENTECH, INC.
Call Right (Obligation to Buy) |
E - Other | -1.295.106 | 0 | -100,00 | ||||
| 2016-04-05 |
|
4 | RTK |
RENTECH, INC.
Call Right (Obligation to Sell) |
E - Other | 28.751 | 0 | -100,00 | ||||
| 2016-04-05 |
|
4 | RTK |
RENTECH, INC.
Call Right (Obligation to Buy) |
E - Other | -726.204 | 0 | -100,00 | ||||
| 2016-04-05 |
|
4 | RTK |
RENTECH, INC.
Call Right (Obligation to Sell) |
E - Other | 16.122 | 0 | -100,00 | ||||
| 2016-04-05 |
|
4 | RTK |
RENTECH, INC.
Call Right (Obligation to Buy) |
E - Other | -300.300 | 0 | -100,00 | ||||
| 2016-04-05 |
|
4 | RTK |
RENTECH, INC.
Call Right (Obligation to Sell) |
E - Other | 6.667 | 0 | -100,00 | ||||
| 2016-04-05 |
|
4 | RTK |
RENTECH, INC.
Call Right (Obligation to Buy) |
E - Other | -585.202 | 0 | -100,00 | ||||
| 2016-04-05 |
|
4 | RTK |
RENTECH, INC.
Call Right (Obligation to Sell) |
E - Other | 12.991 | 0 | -100,00 | ||||
| 2016-04-05 |
|
4 | RTK |
RENTECH, INC.
Call Right (Obligation to Buy) |
E - Other | -173.113 | 0 | -100,00 | ||||
| 2016-04-05 |
|
4 | RTK |
RENTECH, INC.
Call Right (Obligation to Sell) |
E - Other | 3.843 | 0 | -100,00 | ||||
| 2016-04-05 |
|
4 | RTK |
RENTECH, INC.
Call Right (Obligation to Buy) |
E - Other | -172.986 | 0 | -100,00 | ||||
| 2016-04-05 |
|
4 | RTK |
RENTECH, INC.
Call Right (Obligation to Sell) |
E - Other | 3.840 | 0 | -100,00 | ||||
| 2016-04-05 |
|
4 | RTK |
RENTECH, INC.
Call Right (Obligation to Buy) |
E - Other | -445.283 | 0 | -100,00 | ||||
| 2016-04-05 |
|
4 | RTK |
RENTECH, INC.
Call Right (Obligation to Sell) |
E - Other | 9.885 | 0 | -100,00 | ||||
| 2016-04-05 |
|
4 | RTK |
RENTECH, INC.
Series E Convertible Preferred Stock |
J - Other | -17.900 | 0 | -100,00 | ||||
| 2016-04-05 |
|
4 | RTK |
RENTECH, INC.
Series E Convertible Preferred Stock |
J - Other | -28.751 | 0 | -100,00 | ||||
| 2016-04-05 |
|
4 | RTK |
RENTECH, INC.
Series E Convertible Preferred Stock |
J - Other | -16.122 | 0 | -100,00 | ||||
| 2016-04-05 |
|
4 | RTK |
RENTECH, INC.
Series E Convertible Preferred Stock |
J - Other | -6.667 | 0 | -100,00 | ||||
| 2016-04-05 |
|
4 | RTK |
RENTECH, INC.
Series E Convertible Preferred Stock |
J - Other | -12.991 | 0 | -100,00 | ||||
| 2016-04-05 |
|
4 | RTK |
RENTECH, INC.
Series E Convertible Preferred Stock |
J - Other | -3.843 | 0 | -100,00 | ||||
| 2016-04-05 |
|
4 | RTK |
RENTECH, INC.
Series E Convertible Preferred Stock |
J - Other | -3.840 | 0 | -100,00 | ||||
| 2016-04-05 |
|
4 | RTK |
RENTECH, INC.
Series E Convertible Preferred Stock |
J - Other | -9.885 | 0 | -100,00 | ||||
| 2016-03-31 |
|
4 | MIK |
Michaels Companies, Inc.
Common Stock |
S - Sale | -212.554 | 1.427.766 | -12,96 | 26,08 | -5.543.408 | 37.236.137 | |
| 2016-03-31 |
|
4 | MIK |
Michaels Companies, Inc.
Common Stock |
S - Sale | -280.126 | 1.881.665 | -12,96 | 26,08 | -7.305.686 | 49.073.823 | |
| 2016-03-31 |
|
4 | MIK |
Michaels Companies, Inc.
Common Stock |
S - Sale | -19.099 | 128.293 | -12,96 | 26,08 | -498.102 | 3.345.881 | |
| 2016-03-31 |
|
4 | MIK |
Michaels Companies, Inc.
Common Stock |
S - Sale | -89.980 | 604.416 | -12,96 | 26,08 | -2.346.678 | 15.763.169 | |
| 2016-03-31 |
|
4 | MIK |
Michaels Companies, Inc.
Common Stock |
S - Sale | -1.436.844 | 9.651.570 | -12,96 | 26,08 | -37.472.892 | 251.712.946 | |
| 2016-03-31 |
|
4 | MIK |
Michaels Companies, Inc.
Common Stock |
S - Sale | -6.282.349 | 42.199.821 | -12,96 | 26,08 | -163.843.662 | 1.100.571.332 | |
| 2016-03-22 |
|
4 | NCR |
NCR CORP
Common Stock |
J - Other | -2.996 | 0 | -100,00 | ||||
| 2016-02-18 |
|
4 | EARN |
Ellington Residential Mortgage REIT
Common Stock |
P - Purchase | 2.938 | 2.689.702 | 0,11 | 11,80 | 34.668 | 31.738.484 | |
| 2016-02-18 |
|
4 | EARN |
Ellington Residential Mortgage REIT
Common Stock |
P - Purchase | 2.527 | 2.686.764 | 0,09 | 11,70 | 29.566 | 31.435.139 | |
| 2016-02-18 |
|
4 | EARN |
Ellington Residential Mortgage REIT
Common Stock |
P - Purchase | 2.140 | 2.684.237 | 0,08 | 11,44 | 24.482 | 30.707.671 | |
| 2016-02-12 |
|
4 | ZBH |
ZIMMER BIOMET HOLDINGS, INC.
Common Stock |
S - Sale | -1.538.284 | 0 | -100,00 | 95,91 | -147.536.818 | ||
| 2016-02-12 |
|
4 | ZBH |
ZIMMER BIOMET HOLDINGS, INC.
Common Stock |
S - Sale | -12.874 | 0 | -100,00 | 95,91 | -1.234.745 | ||
| 2016-02-12 |
|
4 | ZBH |
ZIMMER BIOMET HOLDINGS, INC.
Common Stock |
S - Sale | -17.370 | 0 | -100,00 | 95,91 | -1.665.957 | ||
| 2016-02-12 |
|
4 | ZBH |
ZIMMER BIOMET HOLDINGS, INC.
Common Stock |
S - Sale | -181.782 | 0 | -100,00 | 95,91 | -17.434.712 | ||
| 2016-02-12 |
|
4 | ZBH |
ZIMMER BIOMET HOLDINGS, INC.
Common Stock |
S - Sale | -1.624.106 | 0 | -100,00 | 95,91 | -155.768.006 | ||
| 2016-02-12 |
|
4 | ZBH |
ZIMMER BIOMET HOLDINGS, INC.
Common Stock |
S - Sale | -549.148 | 0 | -100,00 | 95,91 | -52.668.785 | ||
| 2016-02-12 |
|
4 | ZBH |
ZIMMER BIOMET HOLDINGS, INC.
Common Stock |
S - Sale | -3.428.144 | 0 | -100,00 | 95,91 | -328.793.291 | ||
| 2016-01-05 |
|
4 | NCR |
NCR CORP
Common Stock |
J - Other | 2.996 | 2.996 | |||||
| 2015-12-09 |
|
4 | FSL |
Freescale Semiconductor, Ltd.
Common Shares |
D - Sale to Issuer | -94.504.498 | 0 | -100,00 | ||||
| 2015-12-01 |
|
4/A | KODK |
EASTMAN KODAK CO
Common Stock |
P - Purchase | 44.286 | 285.769 | 18,34 | 13,79 | 610.633 | 3.940.297 | |
| 2015-12-01 |
|
4/A | KODK |
EASTMAN KODAK CO
Common Stock |
P - Purchase | 15.714 | 272.869 | 6,11 | 13,79 | 216.671 | 3.762.427 | |
| 2015-12-01 |
|
4/A | KODK |
EASTMAN KODAK CO
Common Stock |
P - Purchase | 73.811 | 241.483 | 44,02 | 12,72 | 939.112 | 3.072.437 | |
| 2015-12-01 |
|
4/A | KODK |
EASTMAN KODAK CO
Common Stock |
P - Purchase | 26.189 | 257.155 | 11,34 | 12,72 | 333.208 | 3.271.834 | |
| 2015-12-01 |
|
4/A | KODK |
EASTMAN KODAK CO
Common Stock |
P - Purchase | 36.905 | 167.672 | 28,22 | 12,37 | 456.519 | 2.074.119 | |
| 2015-12-01 |
|
4/A | KODK |
EASTMAN KODAK CO
Common Stock |
P - Purchase | 13.095 | 230.966 | 6,01 | 12,37 | 161.986 | 2.857.073 | |
| 2015-11-20 |
|
4 | NONE |
ESH Hospitality, Inc.
Paired Shares |
S - Sale | -15.329 | 129.914 | -10,55 | 16,64 | -255.075 | 2.161.769 | |
| 2015-11-20 |
|
4 | NONE |
ESH Hospitality, Inc.
Paired Shares |
S - Sale | -962.389 | 8.239.971 | -10,46 | 16,64 | -16.014.153 | 137.113.117 | |
| 2015-11-20 |
|
4 | NONE |
ESH Hospitality, Inc.
Paired Shares |
S - Sale | -1.273.946 | 10.796.920 | -10,55 | 16,64 | -21.198.461 | 179.660.749 | |
| 2015-11-20 |
|
4 | NONE |
ESH Hospitality, Inc.
Paired Shares |
S - Sale | -592.620 | 5.022.558 | -10,55 | 16,64 | -9.861.197 | 83.575.365 | |
| 2015-11-20 |
|
4 | NONE |
ESH Hospitality, Inc.
Paired Shares |
S - Sale | -6.222 | 53.273 | -10,46 | 16,64 | -103.534 | 886.463 | |
| 2015-11-20 |
|
4 | NONE |
ESH Hospitality, Inc.
Paired Shares |
S - Sale | -308.949 | 2.641.498 | -10,47 | 16,64 | -5.140.911 | 43.954.527 | |
| 2015-11-20 |
|
4 | NONE |
ESH Hospitality, Inc.
Paired Shares |
S - Sale | -926.328 | 7.920.081 | -10,47 | 16,64 | -15.414.098 | 131.790.148 | |
| 2015-11-20 |
|
4 | NONE |
ESH Hospitality, Inc.
Paired Shares |
S - Sale | -914.217 | 7.816.515 | -10,47 | 16,64 | -15.212.571 | 130.066.810 | |
| 2015-11-20 |
|
4 | STAY |
Extended Stay America, Inc.
Paired Shares |
S - Sale | -15.329 | 129.914 | -10,55 | 16,64 | -255.075 | 2.161.769 | |
| 2015-11-20 |
|
4 | STAY |
Extended Stay America, Inc.
Paired Shares |
S - Sale | -962.389 | 8.239.971 | -10,46 | 16,64 | -16.014.153 | 137.113.117 | |
| 2015-11-20 |
|
4 | STAY |
Extended Stay America, Inc.
Paired Shares |
S - Sale | -1.273.946 | 10.796.920 | -10,55 | 16,64 | -21.198.461 | 179.660.749 | |
| 2015-11-20 |
|
4 | STAY |
Extended Stay America, Inc.
Paired Shares |
S - Sale | -592.620 | 5.022.558 | -10,55 | 16,64 | -9.861.197 | 83.575.365 | |
| 2015-11-20 |
|
4 | STAY |
Extended Stay America, Inc.
Paired Shares |
S - Sale | -6.222 | 53.273 | -10,46 | 16,64 | -103.534 | 886.463 | |
| 2015-11-20 |
|
4 | STAY |
Extended Stay America, Inc.
Paired Shares |
S - Sale | -308.949 | 2.641.498 | -10,47 | 16,64 | -5.140.911 | 43.954.527 | |
| 2015-11-20 |
|
4 | STAY |
Extended Stay America, Inc.
Paired Shares |
S - Sale | -926.328 | 7.920.081 | -10,47 | 16,64 | -15.414.098 | 131.790.148 | |
| 2015-11-20 |
|
4 | STAY |
Extended Stay America, Inc.
Paired Shares |
S - Sale | -914.217 | 7.816.515 | -10,47 | 16,64 | -15.212.571 | 130.066.810 | |
| 2015-11-12 |
|
4 | TVPT |
Travelport Worldwide LTD
Common Shares |
S - Sale | -4.900.000 | 7.604.740 | -39,19 | 14,16 | -69.384.000 | 107.683.118 | |
| 2015-11-10 |
|
4 | EARN |
Ellington Residential Mortgage REIT
Common Stock |
P - Purchase | 20.346 | 2.682.097 | 0,76 | 13,16 | 267.753 | 35.296.397 | |
| 2015-11-10 |
|
4 | EARN |
Ellington Residential Mortgage REIT
Common Stock |
P - Purchase | 56.152 | 2.661.751 | 2,16 | 12,77 | 717.061 | 33.990.560 | |
| 2015-11-10 |
|
4 | EARN |
Ellington Residential Mortgage REIT
Common Stock |
P - Purchase | 50.000 | 2.605.599 | 1,96 | 12,47 | 623.500 | 32.491.820 | |
| 2015-11-10 |
|
4 | BRX |
Brixmor Property Group Inc.
Common Units of Brixmor Operating Partnership LP |
C - Conversion | -528.213 | 4.269.070 | -11,01 | ||||
| 2015-11-10 |
|
4 | BRX |
Brixmor Property Group Inc.
Common Units of Brixmor Operating Partnership LP |
C - Conversion | -87.499 | 707.178 | -11,01 | ||||
| 2015-11-10 |
|
4 | BRX |
Brixmor Property Group Inc.
Common Stock |
S - Sale | -2.150 | 17.381 | -11,01 | 25,96 | -55.814 | 451.211 | |
| 2015-11-10 |
|
4 | BRX |
Brixmor Property Group Inc.
Common Stock |
S - Sale | -419 | 3.385 | -11,01 | 25,96 | -10.877 | 87.875 | |
| 2015-11-10 |
|
4 | BRX |
Brixmor Property Group Inc.
Common Stock |
S - Sale | -313.714 | 2.535.469 | -11,01 | 25,96 | -8.144.015 | 65.820.775 | |
| 2015-11-10 |
|
4 | BRX |
Brixmor Property Group Inc.
Common Stock |
S - Sale | -20.347 | 162.831 | -11,11 | 25,96 | -528.208 | 4.227.093 | |
| 2015-11-10 |
|
4 | BRX |
Brixmor Property Group Inc.
Common Stock |
S - Sale | -11.859 | 94.911 | -11,11 | 25,96 | -307.860 | 2.463.890 | |
| 2015-11-10 |
|
4 | BRX |
Brixmor Property Group Inc.
Common Stock |
S - Sale | -1.597.288 | 12.783.366 | -11,11 | 25,96 | -41.465.596 | 331.856.181 | |
| 2015-11-10 |
|
4 | BRX |
Brixmor Property Group Inc.
Common Stock |
S - Sale | -742.369 | 5.941.300 | -11,11 | 25,96 | -19.271.899 | 154.236.148 | |
| 2015-11-10 |
|
4 | BRX |
Brixmor Property Group Inc.
Common Stock |
S - Sale | -7.242.740 | 57.231.146 | -11,23 | 25,96 | -188.021.530 | 1.485.720.550 | |
| 2015-11-10 |
|
4 | BRX |
Brixmor Property Group Inc.
Common Stock |
S - Sale | -3.453.402 | 27.257.682 | -11,24 | 25,96 | -89.650.316 | 707.609.425 | |
| 2015-11-10 |
|
4 | BRX |
Brixmor Property Group Inc.
Common Stock |
S - Sale | -528.213 | 0 | -100,00 | 25,96 | -13.712.409 | ||
| 2015-11-10 |
|
4 | BRX |
Brixmor Property Group Inc.
Common Stock |
S - Sale | -87.499 | 0 | -100,00 | 25,96 | -2.271.474 | ||
| 2015-11-10 |
|
4 | BRX |
Brixmor Property Group Inc.
Common Stock |
C - Conversion | 528.213 | 528.213 | |||||
| 2015-11-10 |
|
4 | BRX |
Brixmor Property Group Inc.
Common Stock |
C - Conversion | 87.499 | 87.499 | |||||
| 2015-11-04 |
|
4 | KODK |
EASTMAN KODAK CO
Common Stock |
P - Purchase | 44.286 | 284.959 | 18,40 | 13,79 | 610.633 | 3.929.129 | |
| 2015-11-04 |
|
4 | KODK |
EASTMAN KODAK CO
Common Stock |
P - Purchase | 15.714 | 273.679 | 6,09 | 13,79 | 216.671 | 3.773.596 | |
| 2015-11-04 |
|
4 | KODK |
EASTMAN KODAK CO
Common Stock |
P - Purchase | 73.811 | 240.673 | 44,23 | 12,72 | 939.112 | 3.062.131 | |
| 2015-11-04 |
|
4 | KODK |
EASTMAN KODAK CO
Common Stock |
P - Purchase | 26.189 | 257.965 | 11,30 | 12,72 | 333.208 | 3.282.140 | |
| 2015-11-04 |
|
4 | KODK |
EASTMAN KODAK CO
Common Stock |
P - Purchase | 36.095 | 166.862 | 27,60 | 12,37 | 446.499 | 2.064.100 | |
| 2015-11-04 |
|
4 | KODK |
EASTMAN KODAK CO
Common Stock |
P - Purchase | 13.905 | 231.776 | 6,38 | 12,37 | 172.006 | 2.867.092 | |
| 2015-11-03 |
|
4 | KODK |
EASTMAN KODAK CO
Common Stock |
P - Purchase | 37.791 | 130.767 | 40,65 | 12,36 | 467.135 | 1.616.411 | |
| 2015-11-03 |
|
4 | KODK |
EASTMAN KODAK CO
Common Stock |
P - Purchase | 24.997 | 92.976 | 36,77 | 12,41 | 310.245 | 1.153.953 | |
| 2015-11-03 |
|
4 | KODK |
EASTMAN KODAK CO
Common Stock |
P - Purchase | 67.979 | 67.979 | 12,23 | 831.635 | 831.635 | ||
| 2015-11-03 |
|
4 | KODK |
EASTMAN KODAK CO
Common Stock |
P - Purchase | 13.409 | 217.871 | 6,56 | 12,36 | 165.749 | 2.693.103 | |
| 2015-11-03 |
|
4 | KODK |
EASTMAN KODAK CO
Common Stock |
P - Purchase | 8.870 | 204.462 | 4,53 | 12,41 | 110.088 | 2.537.639 | |
| 2015-11-03 |
|
4 | KODK |
EASTMAN KODAK CO
Common Stock |
P - Purchase | 24.121 | 195.592 | 14,07 | 12,23 | 295.089 | 2.392.814 | |
| 2015-10-08 |
|
4 | PFGC |
Performance Food Group Co
Common Stock |
S - Sale | -15.570 | 0 | -100,00 | 17,96 | -279.559 | ||
| 2015-10-08 |
|
4 | PFGC |
Performance Food Group Co
Common Stock |
S - Sale | -646.997 | 0 | -100,00 | 17,96 | -11.616.831 | ||
| 2015-10-08 |
|
4 | PFGC |
Performance Food Group Co
Common Stock |
S - Sale | -21.511 | 787.909 | -2,66 | 17,96 | -386.230 | 14.146.906 | |
| 2015-10-08 |
|
4 | PFGC |
Performance Food Group Co
Common Stock |
S - Sale | -3.517 | 128.829 | -2,66 | 17,96 | -63.148 | 2.313.125 | |
| 2015-10-08 |
|
4 | PFGC |
Performance Food Group Co
Common Stock |
S - Sale | -17.472 | 639.995 | -2,66 | 17,96 | -313.710 | 11.491.110 | |
| 2015-10-08 |
|
4 | PFGC |
Performance Food Group Co
Common Stock |
S - Sale | -220.454 | 8.074.985 | -2,66 | 17,96 | -3.958.252 | 144.986.356 | |
| 2015-10-08 |
|
4 | PFGC |
Performance Food Group Co
Common Stock |
S - Sale | -1.376.220 | 50.409.332 | -2,66 | 17,96 | -24.710.030 | 905.099.556 | |
| 2015-10-02 |
|
4 | PJT |
PJT Partners Inc.
Common Stock |
J - Other | -100 | 0 | -100,00 | ||||
| 2015-10-01 | 3 | PFGC |
Performance Food Group Co
Common Stock |
114.128.344 | ||||||||
| 2015-10-01 | 3 | PFGC |
Performance Food Group Co
Common Stock |
70.638.231 | ||||||||
| 2015-10-01 | 3 | PFGC |
Performance Food Group Co
Common Stock |
63.000.259 | ||||||||
| 2015-10-01 | 3 | PFGC |
Performance Food Group Co
Common Stock |
62.475.138 | ||||||||
| 2015-10-01 | 3 | PFGC |
Performance Food Group Co
Common Stock |
63.152.212 | ||||||||
| 2015-10-01 | 3 | PFGC |
Performance Food Group Co
Common Stock |
62.989.790 | ||||||||
| 2015-10-01 | 3 | PFGC |
Performance Food Group Co
Common Stock |
62.358.362 | ||||||||
| 2015-10-01 | 3 | PFGC |
Performance Food Group Co
Common Stock |
114.128.344 | ||||||||
| 2015-10-01 | 3 | PFGC |
Performance Food Group Co
Common Stock |
70.638.231 | ||||||||
| 2015-10-01 | 3 | PFGC |
Performance Food Group Co
Common Stock |
63.000.259 | ||||||||
| 2015-10-01 | 3 | PFGC |
Performance Food Group Co
Common Stock |
62.475.138 | ||||||||
| 2015-10-01 | 3 | PFGC |
Performance Food Group Co
Common Stock |
63.152.212 | ||||||||
| 2015-10-01 | 3 | PFGC |
Performance Food Group Co
Common Stock |
62.989.790 | ||||||||
| 2015-10-01 | 3 | PFGC |
Performance Food Group Co
Common Stock |
62.358.362 | ||||||||
| 2015-09-09 | 3 | PJT |
PJT Partners Inc.
Class A Common Stock |
200 | ||||||||
| 2015-09-09 | 3 | PJT |
PJT Partners Inc.
Class A Common Stock |
200 | ||||||||
| 2015-09-09 | 3 | PJT |
PJT Partners Inc.
Class A Common Stock |
200 | ||||||||
| 2015-09-09 | 3 | PJT |
PJT Partners Inc.
Class A Common Stock |
200 | ||||||||
| 2015-09-09 | 3 | PJT |
PJT Partners Inc.
Class A Common Stock |
200 | ||||||||
| 2015-08-13 |
|
4 | SUM |
Summit Materials, Inc.
LP Units of Summit Materials Holdings L.P. |
S - Sale | -12.867 | 28.826 | -30,86 | ||||
| 2015-08-13 |
|
4 | SUM |
Summit Materials, Inc.
LP Units of Summit Materials Holdings L.P. |
S - Sale | -22.143 | 49.605 | -30,86 | ||||
| 2015-08-13 |
|
4 | SUM |
Summit Materials, Inc.
LP Units of Summit Materials Holdings L.P. |
S - Sale | -261.315 | 585.415 | -30,86 | ||||
| 2015-08-13 |
|
4 | SUM |
Summit Materials, Inc.
LP Units of Summit Materials Holdings L.P. |
S - Sale | -2.896.494 | 6.488.901 | -30,86 | ||||
| 2015-08-13 |
|
4 | SUM |
Summit Materials, Inc.
LP Units of Summit Materials Holdings L.P. |
S - Sale | -13.739.945 | 30.781.057 | -30,86 | ||||
| 2015-07-15 |
|
4 | MIK |
Michaels Companies, Inc.
Common Stock |
S - Sale | -156.289 | 1.640.320 | -8,70 | 26,51 | -4.143.221 | 43.484.883 | |
| 2015-07-15 |
|
4 | MIK |
Michaels Companies, Inc.
Common Stock |
S - Sale | -205.975 | 2.161.791 | -8,70 | 26,51 | -5.460.397 | 57.309.079 | |
| 2015-07-15 |
|
4 | MIK |
Michaels Companies, Inc.
Common Stock |
S - Sale | -14.043 | 147.392 | -8,70 | 26,51 | -372.280 | 3.907.362 | |
| 2015-07-15 |
|
4 | MIK |
Michaels Companies, Inc.
Common Stock |
S - Sale | -66.162 | 694.396 | -8,70 | 26,51 | -1.753.955 | 18.408.438 | |
| 2015-07-15 |
|
4 | MIK |
Michaels Companies, Inc.
Common Stock |
S - Sale | -1.022.136 | 11.088.414 | -8,44 | 26,51 | -27.096.825 | 293.953.855 | |
| 2015-07-15 |
|
4 | MIK |
Michaels Companies, Inc.
Common Stock |
S - Sale | -4.653.742 | 48.482.170 | -8,76 | 26,51 | -123.370.700 | 1.285.262.327 | |
| 2015-06-26 |
|
4 | NONE |
LVB Acquisition, Inc.
Common Stock |
J - Other | -27.377.587 | 0 | -100,00 | ||||
| 2015-06-26 |
|
4 | NONE |
LVB Acquisition, Inc.
Common Stock |
J - Other | -229.127 | 0 | -100,00 | ||||
| 2015-06-26 |
|
4 | NONE |
LVB Acquisition, Inc.
Common Stock |
J - Other | -2.171.255 | 0 | -100,00 | ||||
| 2015-06-26 |
|
4 | NONE |
LVB Acquisition, Inc.
Common Stock |
J - Other | -1.373.175 | 0 | -100,00 | ||||
| 2015-06-26 |
|
4 | NONE |
LVB Acquisition, Inc.
Common Stock |
J - Other | -28.905.000 | 0 | -100,00 | ||||
| 2015-06-26 |
|
4 | NONE |
LVB Acquisition, Inc.
Common Stock |
J - Other | -9.773.455 | 0 | -100,00 | ||||
| 2015-06-26 |
|
4 | NONE |
LVB Acquisition, Inc.
Common Stock |
J - Other | -61.012.316 | 0 | -100,00 | ||||
| 2015-06-26 |
|
4 | ZBH |
ZIMMER BIOMET HOLDINGS, INC.
Cash-Settled Equity Swap |
X - Other | -42.594 | 0 | -100,00 | ||||
| 2015-06-26 |
|
4 | ZBH |
ZIMMER BIOMET HOLDINGS, INC.
Cash-Settled Equity Swap |
X - Other | -14.152 | 42.594 | -24,94 | ||||
| 2015-06-26 | 3 | ZBH |
ZIMMER BIOMET HOLDINGS, INC.
Common Stock |
10.779.857 | ||||||||
| 2015-06-26 | 3 | ZBH |
ZIMMER BIOMET HOLDINGS, INC.
Common Stock |
7.900.860 | ||||||||
| 2015-06-26 | 3 | ZBH |
ZIMMER BIOMET HOLDINGS, INC.
Common Stock |
8.975.819 | ||||||||
| 2015-06-26 | 3 | ZBH |
ZIMMER BIOMET HOLDINGS, INC.
Common Stock |
7.533.495 | ||||||||
| 2015-06-26 | 3 | ZBH |
ZIMMER BIOMET HOLDINGS, INC.
Common Stock |
7.369.083 | ||||||||
| 2015-06-26 | 3 | ZBH |
ZIMMER BIOMET HOLDINGS, INC.
Common Stock |
7.364.586 | ||||||||
| 2015-06-26 | 3 | ZBH |
ZIMMER BIOMET HOLDINGS, INC.
Common Stock |
8.889.997 | ||||||||
| 2015-06-26 | 3 | ZBH |
ZIMMER BIOMET HOLDINGS, INC.
Common Stock |
10.779.857 | ||||||||
| 2015-06-26 | 3 | ZBH |
ZIMMER BIOMET HOLDINGS, INC.
Common Stock |
7.900.860 | ||||||||
| 2015-06-26 | 3 | ZBH |
ZIMMER BIOMET HOLDINGS, INC.
Common Stock |
8.975.819 | ||||||||
| 2015-06-26 | 3 | ZBH |
ZIMMER BIOMET HOLDINGS, INC.
Common Stock |
7.533.495 | ||||||||
| 2015-06-26 | 3 | ZBH |
ZIMMER BIOMET HOLDINGS, INC.
Common Stock |
7.369.083 | ||||||||
| 2015-06-26 | 3 | ZBH |
ZIMMER BIOMET HOLDINGS, INC.
Common Stock |
7.364.586 | ||||||||
| 2015-06-26 | 3 | ZBH |
ZIMMER BIOMET HOLDINGS, INC.
Common Stock |
8.889.997 | ||||||||
| 2015-06-11 |
|
4 | CTLT |
Catalent, Inc.
Common Stock |
S - Sale | -1.844.963 | 25.886.244 | -6,65 | 28,13 | -51.898.809 | 728.180.044 | |
| 2015-06-10 |
|
4 | CTLT |
Catalent, Inc.
Common Stock |
S - Sale | -12.299.753 | 27.731.207 | -30,73 | 28,13 | -345.992.052 | 780.078.853 | |
| 2015-05-18 |
|
4 | HLT |
Hilton Worldwide Holdings Inc.
Common Stock |
S - Sale | -46.737 | 235.542 | -16,56 | 29,71 | -1.388.556 | 6.997.953 | |
| 2015-05-18 |
|
4 | HLT |
Hilton Worldwide Holdings Inc.
Common Stock |
S - Sale | -7.872.900 | 39.738.987 | -16,54 | 29,71 | -233.903.859 | 1.180.645.304 | |
| 2015-05-18 |
|
4 | HLT |
Hilton Worldwide Holdings Inc.
Common Stock |
S - Sale | -277.327 | 1.397.649 | -16,56 | 29,71 | -8.239.385 | 41.524.152 | |
| 2015-05-18 |
|
4 | HLT |
Hilton Worldwide Holdings Inc.
Common Stock |
S - Sale | -16.318 | 82.238 | -16,56 | 29,71 | -484.808 | 2.443.291 | |
| 2015-05-18 |
|
4 | HLT |
Hilton Worldwide Holdings Inc.
Common Stock |
S - Sale | -2.723.604 | 13.749.289 | -16,53 | 29,71 | -80.918.275 | 408.491.376 | |
| 2015-05-18 |
|
4 | HLT |
Hilton Worldwide Holdings Inc.
Common Stock |
S - Sale | -79.063.114 | 15.587.545 | -83,53 | 29,71 | -2.348.965.117 | 463.105.962 | |
| 2015-05-11 |
|
4 | FSL |
Freescale Semiconductor, Ltd.
Warrants |
X - Other | -9.534.587 | 0 | -100,00 | ||||
| 2015-05-11 |
|
4 | FSL |
Freescale Semiconductor, Ltd.
Common Shares |
J - Other | -8.691.432 | 196.980.050 | -4,23 | 39,62 | -344.354.536 | 7.804.349.581 | |
| 2015-05-11 |
|
4 | FSL |
Freescale Semiconductor, Ltd.
Common Shares |
X - Other | 9.534.587 | 205.671.482 | 4,86 | 36,12 | 344.389.282 | 7.428.853.930 | |
| 2015-04-16 |
|
4 | KODK |
EASTMAN KODAK CO
135% Warrants |
P - Purchase | 5.884 | 5.884 | 6,29 | 37.010 | 37.010 | ||
| 2015-04-16 |
|
4 | KODK |
EASTMAN KODAK CO
125% Warrants |
P - Purchase | 5.884 | 5.884 | 5,59 | 32.892 | 32.892 | ||
| 2015-04-16 |
|
4 | KODK |
EASTMAN KODAK CO
Common Stock |
P - Purchase | 171.471 | 171.471 | 20,56 | 3.525.444 | 3.525.444 | ||
| 2015-04-13 | 3 | HPP |
Hudson Pacific Properties, Inc.
Common Stock |
10.539.878 | ||||||||
| 2015-04-13 | 3 | HPP |
Hudson Pacific Properties, Inc.
Common Stock |
9.296.027 | ||||||||
| 2015-04-13 | 3 | HPP |
Hudson Pacific Properties, Inc.
Common Stock |
10.346.931 | ||||||||
| 2015-04-13 | 3 | HPP |
Hudson Pacific Properties, Inc.
Common Stock |
9.096.787 | ||||||||
| 2015-04-13 | 3 | HPP |
Hudson Pacific Properties, Inc.
Common Stock |
8.819.071 | ||||||||
| 2015-04-13 | 3 | HPP |
Hudson Pacific Properties, Inc.
Common Stock |
9.961.673 | ||||||||
| 2015-04-13 | 3 | HPP |
Hudson Pacific Properties, Inc.
Common Stock |
9.015.209 | ||||||||
| 2015-04-13 | 3 | HPP |
Hudson Pacific Properties, Inc.
Common Stock |
9.441.649 | ||||||||
| 2015-04-13 | 3 | HPP |
Hudson Pacific Properties, Inc.
Common Stock |
9.288.140 | ||||||||
| 2015-04-13 | 3 | HPP |
Hudson Pacific Properties, Inc.
Common Stock |
8.630.431 | ||||||||
| 2015-04-13 | 3 | HPP |
Hudson Pacific Properties, Inc.
Common Stock |
8.649.895 | ||||||||
| 2015-04-13 | 3 | HPP |
Hudson Pacific Properties, Inc.
Common Stock |
8.706.986 | ||||||||
| 2015-04-13 | 3 | HPP |
Hudson Pacific Properties, Inc.
Common Stock |
8.630.624 | ||||||||
| 2015-04-13 | 3 | HPP |
Hudson Pacific Properties, Inc.
Common Stock |
8.971.364 | ||||||||
| 2015-04-13 | 3 | HPP |
Hudson Pacific Properties, Inc.
Common Stock |
10.539.878 | ||||||||
| 2015-04-13 | 3 | HPP |
Hudson Pacific Properties, Inc.
Common Stock |
9.296.027 | ||||||||
| 2015-04-13 | 3 | HPP |
Hudson Pacific Properties, Inc.
Common Stock |
10.346.931 | ||||||||
| 2015-04-13 | 3 | HPP |
Hudson Pacific Properties, Inc.
Common Stock |
9.096.787 | ||||||||
| 2015-04-13 | 3 | HPP |
Hudson Pacific Properties, Inc.
Common Stock |
8.819.071 | ||||||||
| 2015-04-13 | 3 | HPP |
Hudson Pacific Properties, Inc.
Common Stock |
9.961.673 | ||||||||
| 2015-04-13 | 3 | HPP |
Hudson Pacific Properties, Inc.
Common Stock |
9.015.209 | ||||||||
| 2015-04-13 | 3 | HPP |
Hudson Pacific Properties, Inc.
Common Stock |
9.441.649 | ||||||||
| 2015-04-13 | 3 | HPP |
Hudson Pacific Properties, Inc.
Common Stock |
9.288.140 | ||||||||
| 2015-04-13 | 3 | HPP |
Hudson Pacific Properties, Inc.
Common Stock |
8.630.431 | ||||||||
| 2015-04-13 | 3 | HPP |
Hudson Pacific Properties, Inc.
Common Stock |
8.649.895 | ||||||||
| 2015-04-13 | 3 | HPP |
Hudson Pacific Properties, Inc.
Common Stock |
8.706.986 | ||||||||
| 2015-04-13 | 3 | HPP |
Hudson Pacific Properties, Inc.
Common Stock |
8.630.624 | ||||||||
| 2015-04-13 | 3 | HPP |
Hudson Pacific Properties, Inc.
Common Stock |
8.971.364 | ||||||||
| 2015-04-08 |
|
4 | BRX |
Brixmor Property Group Inc.
Common Units of Brixmor Operating Partnership LP |
C - Conversion | -127.111 | 4.797.283 | -2,58 | ||||
| 2015-04-08 |
|
4 | BRX |
Brixmor Property Group Inc.
Common Units of Brixmor Operating Partnership LP |
C - Conversion | -21.056 | 794.677 | -2,58 | ||||
| 2015-04-08 |
|
4 | BRX |
Brixmor Property Group Inc.
Common Stock |
S - Sale | -518 | 19.531 | -2,58 | 25,98 | -13.460 | 507.499 | |
| 2015-04-08 |
|
4 | BRX |
Brixmor Property Group Inc.
Common Stock |
S - Sale | -101 | 3.804 | -2,59 | 25,98 | -2.624 | 98.844 | |
| 2015-04-08 |
|
4 | BRX |
Brixmor Property Group Inc.
Common Stock |
S - Sale | -75.493 | 2.849.183 | -2,58 | 25,98 | -1.961.633 | 74.034.026 | |
| 2015-04-08 |
|
4 | BRX |
Brixmor Property Group Inc.
Common Stock |
S - Sale | -4.873 | 183.178 | -2,59 | 25,98 | -126.621 | 4.759.752 | |
| 2015-04-08 |
|
4 | BRX |
Brixmor Property Group Inc.
Common Stock |
S - Sale | -2.841 | 106.770 | -2,59 | 25,98 | -73.821 | 2.774.344 | |
| 2015-04-08 |
|
4 | BRX |
Brixmor Property Group Inc.
Common Stock |
S - Sale | -382.590 | 14.380.654 | -2,59 | 25,98 | -9.941.333 | 373.671.228 | |
| 2015-04-08 |
|
4 | BRX |
Brixmor Property Group Inc.
Common Stock |
S - Sale | -177.815 | 6.683.669 | -2,59 | 25,98 | -4.620.398 | 173.670.460 | |
| 2015-04-08 |
|
4 | BRX |
Brixmor Property Group Inc.
Common Stock |
S - Sale | -1.750.034 | 64.473.886 | -2,64 | 25,98 | -45.473.408 | 1.675.308.796 | |
| 2015-04-08 |
|
4 | BRX |
Brixmor Property Group Inc.
Common Stock |
S - Sale | -127.111 | 0 | -100,00 | 25,98 | -3.302.890 | ||
| 2015-04-08 |
|
4 | BRX |
Brixmor Property Group Inc.
Common Stock |
S - Sale | -21.056 | 0 | -100,00 | 25,98 | -547.125 | ||
| 2015-04-08 |
|
4 | BRX |
Brixmor Property Group Inc.
Common Stock |
S - Sale | -832.568 | 30.711.084 | -2,64 | 25,98 | -21.633.697 | 798.006.020 | |
| 2015-04-08 |
|
4 | BRX |
Brixmor Property Group Inc.
Common Stock |
C - Conversion | 127.111 | 127.111 | |||||
| 2015-04-08 |
|
4 | BRX |
Brixmor Property Group Inc.
Common Stock |
C - Conversion | 21.056 | 21.056 | |||||
| 2015-04-07 |
|
4 | LQ |
La Quinta Holdings Inc.
Common Stock |
S - Sale | -78.633 | 888.596 | -8,13 | ||||
| 2015-04-07 |
|
4 | LQ |
La Quinta Holdings Inc.
Common Stock |
S - Sale | -15.626 | 176.582 | -8,13 | ||||
| 2015-04-07 |
|
4 | LQ |
La Quinta Holdings Inc.
Common Stock |
S - Sale | -498.730 | 5.635.931 | -8,13 | ||||
| 2015-04-07 |
|
4 | LQ |
La Quinta Holdings Inc.
Common Stock |
S - Sale | -194.120 | 2.193.670 | -8,13 | ||||
| 2015-04-07 |
|
4 | LQ |
La Quinta Holdings Inc.
Common Stock |
S - Sale | -136.369 | 1.541.053 | -8,13 | ||||
| 2015-04-07 |
|
4 | LQ |
La Quinta Holdings Inc.
Common Stock |
S - Sale | -539.029 | 6.091.344 | -8,13 | ||||
| 2015-04-07 |
|
4 | LQ |
La Quinta Holdings Inc.
Common Stock |
S - Sale | -15.780 | 178.324 | -8,13 | ||||
| 2015-04-07 |
|
4 | LQ |
La Quinta Holdings Inc.
Common Stock |
S - Sale | -53.816 | 608.156 | -8,13 | ||||
| 2015-04-07 |
|
4 | LQ |
La Quinta Holdings Inc.
Common Stock |
S - Sale | -46.373 | 524.036 | -8,13 | ||||
| 2015-04-07 |
|
4 | LQ |
La Quinta Holdings Inc.
Common Stock |
S - Sale | -33.759 | 381.502 | -8,13 | ||||
| 2015-04-07 |
|
4 | LQ |
La Quinta Holdings Inc.
Common Stock |
S - Sale | -12.678 | 143.262 | -8,13 | ||||
| 2015-04-07 |
|
4 | LQ |
La Quinta Holdings Inc.
Common Stock |
S - Sale | -31.335 | 354.094 | -8,13 | ||||
| 2015-04-07 |
|
4 | LQ |
La Quinta Holdings Inc.
Common Stock |
S - Sale | -93.169 | 1.052.872 | -8,13 | ||||
| 2015-04-07 |
|
4 | LQ |
La Quinta Holdings Inc.
Common Stock |
S - Sale | -164.977 | 1.864.344 | -8,13 | ||||
| 2015-04-07 |
|
4 | LQ |
La Quinta Holdings Inc.
Common Stock |
S - Sale | -1.198.106 | 13.539.310 | -8,13 | ||||
| 2015-04-01 |
|
4 | LQ |
La Quinta Holdings Inc.
Common Stock |
S - Sale | -524.219 | 967.229 | -35,15 | ||||
| 2015-04-01 |
|
4 | LQ |
La Quinta Holdings Inc.
Common Stock |
S - Sale | -104.173 | 192.208 | -35,15 | ||||
| 2015-04-01 |
|
4 | LQ |
La Quinta Holdings Inc.
Common Stock |
S - Sale | -3.324.860 | 6.134.661 | -35,15 | ||||
| 2015-04-01 |
|
4 | LQ |
La Quinta Holdings Inc.
Common Stock |
S - Sale | -1.294.134 | 2.387.790 | -35,15 | ||||
| 2015-04-01 |
|
4 | LQ |
La Quinta Holdings Inc.
Common Stock |
S - Sale | -909.128 | 1.677.422 | -35,15 | ||||
| 2015-04-01 |
|
4 | LQ |
La Quinta Holdings Inc.
Common Stock |
S - Sale | -3.593.527 | 6.630.373 | -35,15 | ||||
| 2015-04-01 |
|
4 | LQ |
La Quinta Holdings Inc.
Common Stock |
S - Sale | -105.200 | 194.104 | -35,15 | ||||
| 2015-04-01 |
|
4 | LQ |
La Quinta Holdings Inc.
Common Stock |
S - Sale | -358.776 | 661.972 | -35,15 | ||||
| 2015-04-01 |
|
4 | LQ |
La Quinta Holdings Inc.
Common Stock |
S - Sale | -309.150 | 570.409 | -35,15 | ||||
| 2015-04-01 |
|
4 | LQ |
La Quinta Holdings Inc.
Common Stock |
S - Sale | -225.063 | 415.261 | -35,15 | ||||
| 2015-04-01 |
|
4 | LQ |
La Quinta Holdings Inc.
Common Stock |
S - Sale | -84.516 | 155.940 | -35,15 | ||||
| 2015-04-01 |
|
4 | LQ |
La Quinta Holdings Inc.
Common Stock |
S - Sale | -208.894 | 385.429 | -35,15 | ||||
| 2015-04-01 |
|
4 | LQ |
La Quinta Holdings Inc.
Common Stock |
S - Sale | -621.131 | 1.146.041 | -35,15 | ||||
| 2015-04-01 |
|
4 | LQ |
La Quinta Holdings Inc.
Common Stock |
S - Sale | -1.099.851 | 2.029.321 | -35,15 | ||||
| 2015-04-01 |
|
4 | LQ |
La Quinta Holdings Inc.
Common Stock |
S - Sale | -7.987.378 | 14.737.416 | -35,15 | ||||
| 2015-03-31 |
|
4 | BRX |
Brixmor Property Group Inc.
Common Units of Brixmor Operating Partnership LP |
C - Conversion | -847.405 | 4.924.394 | -14,68 | ||||
| 2015-03-31 |
|
4 | BRX |
Brixmor Property Group Inc.
Common Units of Brixmor Operating Partnership LP |
C - Conversion | -140.374 | 815.733 | -14,68 | ||||
| 2015-03-31 |
|
4 | BRX |
Brixmor Property Group Inc.
Common Stock |
S - Sale | -898 | 0 | -100,00 | 25,98 | -23.334 | ||
| 2015-03-31 |
|
4 | BRX |
Brixmor Property Group Inc.
Common Stock |
S - Sale | -2.552 | 20.049 | -11,29 | 25,98 | -66.312 | 520.959 | |
| 2015-03-31 |
|
4 | BRX |
Brixmor Property Group Inc.
Common Stock |
S - Sale | -174 | 0 | -100,00 | 25,98 | -4.521 | ||
| 2015-03-31 |
|
4 | BRX |
Brixmor Property Group Inc.
Common Stock |
S - Sale | -499 | 3.905 | -11,33 | 25,98 | -12.966 | 101.469 | |
| 2015-03-31 |
|
4 | BRX |
Brixmor Property Group Inc.
Common Stock |
S - Sale | -131.115 | 0 | -100,00 | 25,98 | -3.406.931 | ||
| 2015-03-31 |
|
4 | BRX |
Brixmor Property Group Inc.
Common Stock |
S - Sale | -372.172 | 2.924.676 | -11,29 | 25,98 | -9.670.629 | 75.995.659 | |
| 2015-03-31 |
|
4 | BRX |
Brixmor Property Group Inc.
Common Stock |
S - Sale | -32.769 | 188.051 | -14,84 | 25,98 | -851.480 | 4.886.374 | |
| 2015-03-31 |
|
4 | BRX |
Brixmor Property Group Inc.
Common Stock |
S - Sale | -19.100 | 109.611 | -14,84 | 25,98 | -496.300 | 2.848.165 | |
| 2015-03-31 |
|
4 | BRX |
Brixmor Property Group Inc.
Common Stock |
S - Sale | -2.572.607 | 14.763.244 | -14,84 | 25,98 | -66.847.392 | 383.612.561 | |
| 2015-03-31 |
|
4 | BRX |
Brixmor Property Group Inc.
Common Stock |
S - Sale | -1.195.666 | 6.861.484 | -14,84 | 25,98 | -31.068.544 | 178.290.859 | |
| 2015-03-31 |
|
4 | BRX |
Brixmor Property Group Inc.
Common Stock |
S - Sale | -11.634.217 | 66.223.920 | -14,94 | 25,98 | -302.306.985 | 1.720.782.204 | |
| 2015-03-31 |
|
4 | BRX |
Brixmor Property Group Inc.
Common Stock |
S - Sale | -847.405 | 0 | -100,00 | 25,98 | -22.019.226 | ||
| 2015-03-31 |
|
4 | BRX |
Brixmor Property Group Inc.
Common Stock |
S - Sale | -140.374 | 0 | -100,00 | 25,98 | -3.647.520 | ||
| 2015-03-31 |
|
4 | BRX |
Brixmor Property Group Inc.
Common Stock |
S - Sale | -5.550.452 | 31.543.652 | -14,96 | 25,98 | -144.224.610 | 819.639.717 | |
| 2015-03-31 |
|
4 | BRX |
Brixmor Property Group Inc.
Common Stock |
C - Conversion | 847.405 | 847.405 | |||||
| 2015-03-31 |
|
4 | BRX |
Brixmor Property Group Inc.
Common Stock |
C - Conversion | 140.374 | 140.374 | |||||
| 2015-03-17 |
|
4 | PF |
Pinnacle Foods Inc.
Common Stock |
S - Sale | -9.409 | 3.308 | -73,99 | 37,07 | -348.792 | 122.628 | |
| 2015-03-17 |
|
4 | PF |
Pinnacle Foods Inc.
Common Stock |
S - Sale | -118.716 | 41.731 | -73,99 | 37,07 | -4.400.802 | 1.546.968 | |
| 2015-03-17 |
|
4 | PF |
Pinnacle Foods Inc.
Common Stock |
S - Sale | -72.095 | 25.343 | -73,99 | 37,07 | -2.672.562 | 939.465 | |
| 2015-03-17 |
|
4 | PF |
Pinnacle Foods Inc.
Common Stock |
S - Sale | -294.969 | 103.686 | -73,99 | 37,07 | -10.934.501 | 3.843.640 | |
| 2015-03-17 |
|
4 | PF |
Pinnacle Foods Inc.
Common Stock |
S - Sale | -2.323.352 | 816.693 | -73,99 | 37,07 | -86.126.659 | 30.274.810 | |
| 2015-03-17 |
|
4 | PF |
Pinnacle Foods Inc.
Common Stock |
S - Sale | -2.667.062 | 937.511 | -73,99 | 37,07 | -98.867.988 | 34.753.533 | |
| 2015-03-17 |
|
4 | PF |
Pinnacle Foods Inc.
Common Stock |
S - Sale | -19.225 | 6.758 | -73,99 | 37,07 | -712.671 | 250.519 | |
| 2015-03-17 |
|
4 | PF |
Pinnacle Foods Inc.
Common Stock |
S - Sale | -248.436 | 87.329 | -73,99 | 37,07 | -9.209.523 | 3.237.286 | |
| 2015-03-17 |
|
4 | PF |
Pinnacle Foods Inc.
Common Stock |
S - Sale | -51.298 | 18.032 | -73,99 | 37,07 | -1.901.617 | 668.446 | |
| 2015-03-17 |
|
4 | PF |
Pinnacle Foods Inc.
Common Stock |
S - Sale | -469.883 | 165.171 | -73,99 | 37,07 | -17.418.563 | 6.122.889 | |
| 2015-03-17 |
|
4 | PF |
Pinnacle Foods Inc.
Common Stock |
S - Sale | -7.949.700 | 2.794.438 | -73,99 | 37,07 | -294.695.379 | 103.589.817 | |
| 2015-03-12 | 3 | SUM |
Summit Materials, Inc.
Class B Common Stock |
138.014.594 | ||||||||
| 2015-03-12 | 3 | SUM |
Summit Materials, Inc.
Class B Common Stock |
138.014.594 | ||||||||
| 2015-03-12 | 3 | SUM |
Summit Materials, Inc.
Class B Common Stock |
138.014.594 | ||||||||
| 2015-03-12 | 3 | SUM |
Summit Materials, Inc.
Class B Common Stock |
138.014.594 | ||||||||
| 2015-03-12 | 3 | SUM |
Summit Materials, Inc.
Class B Common Stock |
138.014.594 | ||||||||
| 2015-03-12 | 3 | SUM |
Summit Materials, Inc.
Class B Common Stock |
138.014.594 | ||||||||
| 2015-03-11 |
|
4 | CTLT |
Catalent, Inc.
Common Stock |
S - Sale | -23.982.522 | 40.553.630 | -37,16 | ||||
| 2015-02-25 |
|
4 | RTK |
RENTECH, INC.
Put Right (Obligation to Buy) |
J - Other | 8.063.063 | 8.063.063 | |||||
| 2015-02-25 |
|
4 | RTK |
RENTECH, INC.
Call Right (Obligation to Sell) |
J - Other | -17.900 | 17.900 | -50,00 | ||||
| 2015-02-25 |
|
4 | RTK |
RENTECH, INC.
Put Right (Obligation to Buy) |
J - Other | 12.951.069 | 12.951.069 | |||||
| 2015-02-25 |
|
4 | RTK |
RENTECH, INC.
Call Right (Obligation to Sell) |
J - Other | -28.751 | 28.751 | -50,00 | ||||
| 2015-02-25 |
|
4 | RTK |
RENTECH, INC.
Call Right (Obligation to Buy) |
J - Other | 7.262.046 | 7.262.046 | |||||
| 2015-02-25 |
|
4 | RTK |
RENTECH, INC.
Call Right (Obligation to Sell) |
J - Other | -16.122 | 16.122 | -50,00 | ||||
| 2015-02-25 |
|
4 | RTK |
RENTECH, INC.
Call Right (Obligation to Buy) |
J - Other | 3.003.003 | 3.003.003 | |||||
| 2015-02-25 |
|
4 | RTK |
RENTECH, INC.
Call Right (Obligation to Sell) |
J - Other | -6.667 | 6.667 | -50,00 | ||||
| 2015-02-25 |
|
4 | RTK |
RENTECH, INC.
Call Right (Obligation to Buy) |
J - Other | 5.852.021 | 5.852.021 | |||||
| 2015-02-25 |
|
4 | RTK |
RENTECH, INC.
Call Right (Obligation to Sell) |
J - Other | -12.991 | 12.991 | -50,00 | ||||
| 2015-02-25 |
|
4 | RTK |
RENTECH, INC.
Call Right (Obligation to Buy) |
J - Other | 1.731.140 | 1.731.140 | |||||
| 2015-02-25 |
|
4 | RTK |
RENTECH, INC.
Call Right (Obligation to Sell) |
J - Other | -3.843 | 3.843 | -50,00 | ||||
| 2015-02-25 |
|
4 | RTK |
RENTECH, INC.
Call Right(Obligation to Buy) |
J - Other | 1.729.863 | 1.729.863 | |||||
| 2015-02-25 |
|
4 | RTK |
RENTECH, INC.
Call Right (Obligation to Sell) |
J - Other | -3.840 | 3.840 | -50,00 | ||||
| 2015-02-25 |
|
4 | RTK |
RENTECH, INC.
Call Right(Obligation to Buy) |
J - Other | 4.452.840 | 4.452.840 | |||||
| 2015-02-25 |
|
4 | RTK |
RENTECH, INC.
Call Right (Obligation to Sell) |
J - Other | -9.885 | 9.885 | -50,00 | ||||
| 2015-02-20 |
|
4 | KODK |
EASTMAN KODAK CO
125% Warrants |
J - Other | 1.593 | 16.113 | 10,97 | ||||
| 2015-02-20 |
|
4 | KODK |
EASTMAN KODAK CO
135% Warrants |
J - Other | 1.593 | 16.113 | 10,97 | ||||
| 2015-02-20 |
|
4 | KODK |
EASTMAN KODAK CO
125% Warrants |
J - Other | 1.269 | 12.841 | 10,97 | ||||
| 2015-02-20 |
|
4 | KODK |
EASTMAN KODAK CO
135% Warrants |
J - Other | 1.269 | 12.841 | 10,97 | ||||
| 2015-02-20 |
|
4 | KODK |
EASTMAN KODAK CO
125% Warrants |
J - Other | 3.843 | 38.851 | 10,98 | ||||
| 2015-02-20 |
|
4 | KODK |
EASTMAN KODAK CO
135% Warrants |
J - Other | 3.843 | 38.851 | 10,98 | ||||
| 2015-02-20 |
|
4 | KODK |
EASTMAN KODAK CO
125% Warrants |
J - Other | 4.126 | 41.721 | 10,97 | ||||
| 2015-02-20 |
|
4 | KODK |
EASTMAN KODAK CO
135% Warrants |
J - Other | 4.126 | 41.721 | 10,97 | ||||
| 2015-02-20 |
|
4 | KODK |
EASTMAN KODAK CO
Common Stock |
J - Other | 4.566 | 1.226.470 | 0,37 | ||||
| 2015-02-20 |
|
4 | KODK |
EASTMAN KODAK CO
Common Stock |
J - Other | 3.639 | 986.236 | 0,37 | ||||
| 2015-02-20 |
|
4 | KODK |
EASTMAN KODAK CO
Common Stock |
J - Other | 11.008 | 2.958.768 | 0,37 | ||||
| 2015-02-20 |
|
4 | KODK |
EASTMAN KODAK CO
Common Stock |
J - Other | 11.822 | 3.145.099 | 0,38 | ||||
| 2015-02-05 |
|
4/A | SARA |
SARATOGA RESOURCES INC /TX
Common Stock |
P - Purchase | 800.000 | 4.800.000 | 20,00 | 6,25 | 5.000.000 | 30.000.000 | |
| 2015-02-05 | 3/A | SARA |
SARATOGA RESOURCES INC /TX
Common Stock |
2.982.321 | ||||||||
| 2015-02-05 | 3/A | SARA |
SARATOGA RESOURCES INC /TX
Common Stock |
1.017.679 | ||||||||
| 2015-01-28 |
|
4 | MIK |
Michaels Companies, Inc.
Common Stock |
S - Sale | -284.125 | 1.796.609 | -13,66 | 22,58 | -6.415.542 | 40.567.431 | |
| 2015-01-28 |
|
4 | MIK |
Michaels Companies, Inc.
Common Stock |
S - Sale | -374.450 | 2.367.766 | -13,66 | 22,58 | -8.455.081 | 53.464.156 | |
| 2015-01-28 |
|
4 | MIK |
Michaels Companies, Inc.
Common Stock |
S - Sale | -25.530 | 161.435 | -13,65 | 22,58 | -576.467 | 3.645.202 | |
| 2015-01-28 |
|
4 | MIK |
Michaels Companies, Inc.
Common Stock |
S - Sale | -120.280 | 760.558 | -13,66 | 22,58 | -2.715.922 | 17.173.400 | |
| 2015-01-28 |
|
4 | MIK |
Michaels Companies, Inc.
Common Stock |
S - Sale | -1.955.026 | 12.110.550 | -13,90 | 22,58 | -44.144.487 | 273.456.219 | |
| 2015-01-28 |
|
4 | MIK |
Michaels Companies, Inc.
Common Stock |
S - Sale | -8.363.389 | 53.135.912 | -13,60 | 22,58 | -188.845.324 | 1.199.808.893 | |
| 2015-01-22 |
|
4/A | BRX |
Brixmor Property Group Inc.
Common Units of Brixmor Operating Partnership LP |
C - Conversion | -658.459 | 5.771.799 | -10,24 | ||||
| 2015-01-22 |
|
4/A | BRX |
Brixmor Property Group Inc.
Common Units of Brixmor Operating Partnership LP |
C - Conversion | -109.075 | 956.107 | -10,24 | ||||
| 2015-01-22 |
|
4/A | BRX |
Brixmor Property Group Inc.
Common Stock |
S - Sale | -617 | 898 | -40,73 | 26,00 | -16.042 | 23.348 | |
| 2015-01-22 |
|
4/A | BRX |
Brixmor Property Group Inc.
Common Stock |
S - Sale | -121 | 174 | -41,02 | 26,00 | -3.146 | 4.524 | |
| 2015-01-22 |
|
4/A | BRX |
Brixmor Property Group Inc.
Common Stock |
S - Sale | -89.944 | 131.115 | -40,69 | 26,00 | -2.338.544 | 3.408.990 | |
| 2015-01-22 |
|
4/A | BRX |
Brixmor Property Group Inc.
Common Stock |
S - Sale | -303.590 | 0 | -100,00 | 26,00 | -7.893.340 | ||
| 2015-01-22 |
|
4/A | BRX |
Brixmor Property Group Inc.
Common Stock |
S - Sale | -25.444 | 220.820 | -10,33 | 26,00 | -661.544 | 5.741.320 | |
| 2015-01-22 |
|
4/A | BRX |
Brixmor Property Group Inc.
Common Stock |
S - Sale | -14.831 | 128.711 | -10,33 | 26,00 | -385.606 | 3.346.486 | |
| 2015-01-22 |
|
4/A | BRX |
Brixmor Property Group Inc.
Common Stock |
S - Sale | -1.997.585 | 17.335.851 | -10,33 | 26,00 | -51.937.210 | 450.732.126 | |
| 2015-01-22 |
|
4/A | BRX |
Brixmor Property Group Inc.
Common Stock |
S - Sale | -928.413 | 8.057.150 | -10,33 | 26,00 | -24.138.738 | 209.485.900 | |
| 2015-01-22 |
|
4/A | BRX |
Brixmor Property Group Inc.
Common Stock |
S - Sale | -9.054.586 | 77.858.137 | -10,42 | 26,00 | -235.419.236 | 2.024.311.562 | |
| 2015-01-22 |
|
4/A | BRX |
Brixmor Property Group Inc.
Common Stock |
S - Sale | -658.459 | 0 | -100,00 | 26,00 | -17.119.934 | ||
| 2015-01-22 |
|
4/A | BRX |
Brixmor Property Group Inc.
Common Stock |
S - Sale | -109.075 | 0 | -100,00 | 26,00 | -2.835.950 | ||
| 2015-01-22 |
|
4/A | BRX |
Brixmor Property Group Inc.
Common Stock |
S - Sale | -4.317.335 | 37.094.104 | -10,43 | 26,00 | -112.250.710 | 964.446.704 | |
| 2015-01-22 |
|
4/A | BRX |
Brixmor Property Group Inc.
Common Stock |
C - Conversion | 658.459 | 658.459 | |||||
| 2015-01-22 |
|
4/A | BRX |
Brixmor Property Group Inc.
Common Stock |
C - Conversion | 109.075 | 109.075 | |||||
| 2015-01-21 |
|
4 | BRX |
Brixmor Property Group Inc.
Common Units of Brixmor Operating Partnership LP |
C - Conversion | -658.459 | 5.771.799 | -10,24 | ||||
| 2015-01-21 |
|
4 | BRX |
Brixmor Property Group Inc.
Common Units of Brixmor Operating Partnership LP |
C - Conversion | -109.107 | 956.075 | -10,24 | ||||
| 2015-01-21 |
|
4 | BRX |
Brixmor Property Group Inc.
Common Stock |
S - Sale | -617 | 898 | -40,73 | 26,00 | -16.042 | 23.348 | |
| 2015-01-21 |
|
4 | BRX |
Brixmor Property Group Inc.
Common Stock |
S - Sale | -121 | 174 | -41,02 | 26,00 | -3.146 | 4.524 | |
| 2015-01-21 |
|
4 | BRX |
Brixmor Property Group Inc.
Common Stock |
S - Sale | -89.944 | 131.115 | -40,69 | 26,00 | -2.338.544 | 3.408.990 | |
| 2015-01-21 |
|
4 | BRX |
Brixmor Property Group Inc.
Common Stock |
S - Sale | -303.590 | 0 | -100,00 | 26,00 | -7.893.340 | ||
| 2015-01-21 |
|
4 | BRX |
Brixmor Property Group Inc.
Common Stock |
S - Sale | -25.444 | 220.820 | -10,33 | 26,00 | -661.544 | 5.741.320 | |
| 2015-01-21 |
|
4 | BRX |
Brixmor Property Group Inc.
Common Stock |
S - Sale | -14.831 | 128.711 | -10,33 | 26,00 | -385.606 | 3.346.486 | |
| 2015-01-21 |
|
4 | BRX |
Brixmor Property Group Inc.
Common Stock |
S - Sale | -1.997.585 | 17.335.851 | -10,33 | 26,00 | -51.937.210 | 450.732.126 | |
| 2015-01-21 |
|
4 | BRX |
Brixmor Property Group Inc.
Common Stock |
S - Sale | -928.413 | 8.057.150 | -10,33 | 26,00 | -24.138.738 | 209.485.900 | |
| 2015-01-21 |
|
4 | BRX |
Brixmor Property Group Inc.
Common Stock |
S - Sale | -9.054.586 | 77.858.137 | -10,42 | 26,00 | -235.419.236 | 2.024.311.562 | |
| 2015-01-21 |
|
4 | BRX |
Brixmor Property Group Inc.
Common Stock |
S - Sale | -658.459 | 5.771.799 | -10,24 | 26,00 | -17.119.934 | 150.066.774 | |
| 2015-01-21 |
|
4 | BRX |
Brixmor Property Group Inc.
Common Stock |
S - Sale | -109.075 | 0 | -100,00 | 26,00 | -2.835.950 | ||
| 2015-01-21 |
|
4 | BRX |
Brixmor Property Group Inc.
Common Stock |
S - Sale | -4.317.335 | 37.094.104 | -10,43 | 26,00 | -112.250.710 | 964.446.704 | |
| 2015-01-21 |
|
4 | BRX |
Brixmor Property Group Inc.
Common Stock |
C - Conversion | 658.459 | 658.459 | |||||
| 2015-01-21 |
|
4 | BRX |
Brixmor Property Group Inc.
Common Stock |
C - Conversion | 109.075 | 109.075 | |||||
| 2015-01-12 |
|
4 | KODK |
EASTMAN KODAK CO
125% Warrants |
J - Other | 1.682 | 14.520 | 13,10 | ||||
| 2015-01-12 |
|
4 | KODK |
EASTMAN KODAK CO
135% Warrants |
J - Other | 1.682 | 14.520 | 13,10 | ||||
| 2015-01-12 |
|
4 | KODK |
EASTMAN KODAK CO
125% Warrants |
J - Other | 1.341 | 11.572 | 13,11 | ||||
| 2015-01-12 |
|
4 | KODK |
EASTMAN KODAK CO
135% Warrants |
J - Other | 1.341 | 11.572 | 13,11 | ||||
| 2015-01-12 |
|
4 | KODK |
EASTMAN KODAK CO
125% Warrants |
J - Other | 4.057 | 35.008 | 13,11 | ||||
| 2015-01-12 |
|
4 | KODK |
EASTMAN KODAK CO
135% Warrants |
J - Other | 4.057 | 35.008 | 13,11 | ||||
| 2015-01-12 |
|
4 | KODK |
EASTMAN KODAK CO
125% Warrants |
J - Other | 4.357 | 37.595 | 13,11 | ||||
| 2015-01-12 |
|
4 | KODK |
EASTMAN KODAK CO
135% Warrants |
J - Other | 4.357 | 37.595 | 13,11 | ||||
| 2015-01-12 |
|
4 | KODK |
EASTMAN KODAK CO
Common Stock |
J - Other | 4.843 | 1.221.904 | 0,40 | ||||
| 2015-01-12 |
|
4 | KODK |
EASTMAN KODAK CO
Common Stock |
J - Other | 3.859 | 982.597 | 0,39 | ||||
| 2015-01-12 |
|
4 | KODK |
EASTMAN KODAK CO
Common Stock |
J - Other | 11.674 | 2.947.760 | 0,40 | ||||
| 2015-01-12 |
|
4 | KODK |
EASTMAN KODAK CO
Common Stock |
J - Other | 12.537 | 3.133.277 | 0,40 | ||||
| 2014-12-24 |
|
4 | NONE |
ESH Hospitality, Inc.
Paired Shares |
J - Other | -13.962 | 9.202.360 | -0,15 | ||||
| 2014-12-24 |
|
4 | NONE |
ESH Hospitality, Inc.
Paired Shares |
J - Other | -89 | 59.495 | -0,15 | ||||
| 2014-12-24 |
|
4 | NONE |
ESH Hospitality, Inc.
Paired Shares |
J - Other | -229 | 2.950.447 | -0,01 | ||||
| 2014-12-24 |
|
4 | NONE |
ESH Hospitality, Inc.
Paired Shares |
J - Other | -13.452 | 8.846.409 | -0,15 | ||||
| 2014-12-24 |
|
4 | NONE |
ESH Hospitality, Inc.
Paired Shares |
J - Other | -13.130 | 8.730.732 | -0,15 | ||||
| 2014-12-24 |
|
4 | STAY |
Extended Stay America, Inc.
Paired Shares |
J - Other | -13.962 | 9.202.360 | -0,15 | ||||
| 2014-12-24 |
|
4 | STAY |
Extended Stay America, Inc.
Paired Shares |
J - Other | -89 | 59.495 | -0,15 | ||||
| 2014-12-24 |
|
4 | STAY |
Extended Stay America, Inc.
Paired Shares |
J - Other | -229 | 2.950.447 | -0,01 | ||||
| 2014-12-24 |
|
4 | STAY |
Extended Stay America, Inc.
Paired Shares |
J - Other | -13.452 | 8.846.409 | -0,15 | ||||
| 2014-12-24 |
|
4 | STAY |
Extended Stay America, Inc.
Paired Shares |
J - Other | -13.130 | 8.730.732 | -0,15 | ||||
| 2014-12-18 |
|
4 | NLSN |
Nielsen N.V.
Common Stock |
S - Sale | -172.853 | 402.447 | -30,05 | 42,88 | -7.411.937 | 17.256.927 | |
| 2014-12-18 |
|
4 | NLSN |
Nielsen N.V.
Common Stock |
S - Sale | -39.001 | 90.804 | -30,05 | 42,88 | -1.672.363 | 3.893.676 | |
| 2014-12-18 |
|
4 | NLSN |
Nielsen N.V.
Common Stock |
S - Sale | -193.247 | 449.929 | -30,05 | 42,88 | -8.286.431 | 19.292.956 | |
| 2014-12-18 |
|
4 | NLSN |
Nielsen N.V.
Common Stock |
S - Sale | -2.256.313 | 5.253.266 | -30,05 | 42,88 | -96.750.701 | 225.260.046 | |
| 2014-12-18 |
|
4 | NLSN |
Nielsen N.V.
Common Stock |
S - Sale | -15.787 | 36.756 | -30,05 | 42,88 | -676.947 | 1.576.097 | |
| 2014-12-18 |
|
4 | NLSN |
Nielsen N.V.
Common Stock |
S - Sale | -76.687 | 178.546 | -30,05 | 42,88 | -3.288.339 | 7.656.052 | |
| 2014-12-18 |
|
4 | NLSN |
Nielsen N.V.
Common Stock |
S - Sale | -2.437.079 | 5.674.135 | -30,05 | 42,88 | -104.501.948 | 243.306.909 | |
| 2014-12-09 |
|
4 | PF |
Pinnacle Foods Inc.
Common Stock |
S - Sale | -1.984 | 12.717 | -13,50 | 32,11 | -63.706 | 408.343 | |
| 2014-12-09 |
|
4 | PF |
Pinnacle Foods Inc.
Common Stock |
S - Sale | -25.038 | 160.447 | -13,50 | 32,11 | -803.970 | 5.151.953 | |
| 2014-12-09 |
|
4 | PF |
Pinnacle Foods Inc.
Common Stock |
S - Sale | -15.206 | 97.438 | -13,50 | 32,11 | -488.265 | 3.128.734 | |
| 2014-12-09 |
|
4 | PF |
Pinnacle Foods Inc.
Common Stock |
S - Sale | -62.212 | 398.655 | -13,50 | 32,11 | -1.997.627 | 12.800.812 | |
| 2014-12-09 |
|
4 | PF |
Pinnacle Foods Inc.
Common Stock |
S - Sale | -490.016 | 3.140.045 | -13,50 | 32,11 | -15.734.414 | 100.826.845 | |
| 2014-12-09 |
|
4 | PF |
Pinnacle Foods Inc.
Common Stock |
S - Sale | -562.507 | 3.604.573 | -13,50 | 32,11 | -18.062.100 | 115.742.839 | |
| 2014-12-09 |
|
4 | PF |
Pinnacle Foods Inc.
Common Stock |
S - Sale | -4.055 | 25.983 | -13,50 | 32,11 | -130.206 | 834.314 | |
| 2014-12-09 |
|
4 | PF |
Pinnacle Foods Inc.
Common Stock |
S - Sale | -52.397 | 335.765 | -13,50 | 32,11 | -1.682.468 | 10.781.414 | |
| 2014-12-09 |
|
4 | PF |
Pinnacle Foods Inc.
Common Stock |
S - Sale | -10.819 | 69.330 | -13,50 | 32,11 | -347.398 | 2.226.186 | |
| 2014-12-09 |
|
4 | PF |
Pinnacle Foods Inc.
Common Stock |
S - Sale | -99.102 | 635.054 | -13,50 | 32,11 | -3.182.165 | 20.391.584 | |
| 2014-12-09 |
|
4 | PF |
Pinnacle Foods Inc.
Common Stock |
S - Sale | -1.676.664 | 10.744.138 | -13,50 | 32,11 | -53.837.681 | 344.994.271 | |
| 2014-11-26 |
|
4 | LQ |
La Quinta Holdings Inc.
Common Stock |
S - Sale | -581.062 | 1.491.448 | -28,04 | 19,40 | -11.272.603 | 28.934.091 | |
| 2014-11-26 |
|
4 | LQ |
La Quinta Holdings Inc.
Common Stock |
S - Sale | -115.469 | 296.381 | -28,04 | 19,40 | -2.240.099 | 5.749.791 | |
| 2014-11-26 |
|
4 | LQ |
La Quinta Holdings Inc.
Common Stock |
S - Sale | -3.685.388 | 9.459.521 | -28,04 | 19,40 | -71.496.527 | 183.514.707 | |
| 2014-11-26 |
|
4 | LQ |
La Quinta Holdings Inc.
Common Stock |
S - Sale | -1.434.461 | 3.681.924 | -28,04 | 19,40 | -27.828.543 | 71.429.326 | |
| 2014-11-26 |
|
4 | LQ |
La Quinta Holdings Inc.
Common Stock |
S - Sale | -1.007.709 | 2.586.550 | -28,04 | 19,40 | -19.549.555 | 50.179.070 | |
| 2014-11-26 |
|
4 | LQ |
La Quinta Holdings Inc.
Common Stock |
S - Sale | -3.983.186 | 10.223.900 | -28,04 | 19,40 | -77.273.808 | 198.343.660 | |
| 2014-11-26 |
|
4 | LQ |
La Quinta Holdings Inc.
Common Stock |
S - Sale | -116.607 | 299.304 | -28,04 | 19,40 | -2.262.176 | 5.806.498 | |
| 2014-11-26 |
|
4 | LQ |
La Quinta Holdings Inc.
Common Stock |
S - Sale | -397.679 | 1.020.748 | -28,04 | 19,40 | -7.714.973 | 19.802.511 | |
| 2014-11-26 |
|
4 | LQ |
La Quinta Holdings Inc.
Common Stock |
S - Sale | -342.673 | 879.559 | -28,04 | 19,40 | -6.647.856 | 17.063.445 | |
| 2014-11-26 |
|
4 | LQ |
La Quinta Holdings Inc.
Common Stock |
S - Sale | -249.468 | 640.324 | -28,04 | 19,40 | -4.839.679 | 12.422.286 | |
| 2014-11-26 |
|
4 | LQ |
La Quinta Holdings Inc.
Common Stock |
S - Sale | -93.680 | 240.456 | -28,04 | 19,40 | -1.817.392 | 4.664.846 | |
| 2014-11-26 |
|
4 | LQ |
La Quinta Holdings Inc.
Common Stock |
S - Sale | -231.546 | 594.323 | -28,04 | 19,40 | -4.491.992 | 11.529.866 | |
| 2014-11-26 |
|
4 | LQ |
La Quinta Holdings Inc.
Common Stock |
S - Sale | -688.482 | 1.767.172 | -28,04 | 19,40 | -13.356.551 | 34.283.137 | |
| 2014-11-26 |
|
4 | LQ |
La Quinta Holdings Inc.
Common Stock |
S - Sale | -1.219.112 | 3.129.172 | -28,04 | 19,40 | -23.650.773 | 60.705.937 | |
| 2014-11-26 |
|
4 | LQ |
La Quinta Holdings Inc.
Common Stock |
S - Sale | -8.853.478 | 22.724.794 | -28,04 | 19,40 | -171.757.473 | 440.861.004 | |
| 2014-11-25 |
|
4 | PF |
Pinnacle Foods Inc.
Common Stock |
S - Sale | -661 | 14.701 | -4,30 | 32,11 | -21.225 | 472.049 | |
| 2014-11-25 |
|
4 | PF |
Pinnacle Foods Inc.
Common Stock |
S - Sale | -13.014 | 15.362 | -45,86 | 32,11 | -417.880 | 493.274 | |
| 2014-11-25 |
|
4 | PF |
Pinnacle Foods Inc.
Common Stock |
S - Sale | -8.346 | 185.485 | -4,31 | 32,11 | -267.990 | 5.955.923 | |
| 2014-11-25 |
|
4 | PF |
Pinnacle Foods Inc.
Common Stock |
S - Sale | -164.210 | 193.831 | -45,86 | 32,11 | -5.272.783 | 6.223.913 | |
| 2014-11-25 |
|
4 | PF |
Pinnacle Foods Inc.
Common Stock |
S - Sale | -5.069 | 112.644 | -4,31 | 32,11 | -162.766 | 3.616.999 | |
| 2014-11-25 |
|
4 | PF |
Pinnacle Foods Inc.
Common Stock |
S - Sale | -99.724 | 117.713 | -45,86 | 32,11 | -3.202.138 | 3.779.764 | |
| 2014-11-25 |
|
4 | PF |
Pinnacle Foods Inc.
Common Stock |
S - Sale | -20.737 | 460.867 | -4,31 | 32,11 | -665.865 | 14.798.439 | |
| 2014-11-25 |
|
4 | PF |
Pinnacle Foods Inc.
Common Stock |
S - Sale | -408.004 | 481.604 | -45,86 | 32,11 | -13.101.008 | 15.464.304 | |
| 2014-11-25 |
|
4 | PF |
Pinnacle Foods Inc.
Common Stock |
S - Sale | -163.338 | 3.630.061 | -4,31 | 32,11 | -5.244.783 | 116.561.259 | |
| 2014-11-25 |
|
4 | PF |
Pinnacle Foods Inc.
Common Stock |
S - Sale | -3.213.687 | 3.793.399 | -45,86 | 32,11 | -103.191.490 | 121.806.042 | |
| 2014-11-25 |
|
4 | PF |
Pinnacle Foods Inc.
Common Stock |
S - Sale | -187.503 | 4.167.080 | -4,31 | 32,11 | -6.020.721 | 133.804.939 | |
| 2014-11-25 |
|
4 | PF |
Pinnacle Foods Inc.
Common Stock |
S - Sale | -3.689.111 | 4.354.583 | -45,86 | 32,11 | -118.457.354 | 139.825.660 | |
| 2014-11-25 |
|
4 | PF |
Pinnacle Foods Inc.
Common Stock |
S - Sale | -1.352 | 30.038 | -4,31 | 32,11 | -43.413 | 964.520 | |
| 2014-11-25 |
|
4 | PF |
Pinnacle Foods Inc.
Common Stock |
S - Sale | -26.593 | 31.390 | -45,86 | 32,11 | -853.901 | 1.007.933 | |
| 2014-11-25 |
|
4 | PF |
Pinnacle Foods Inc.
Common Stock |
S - Sale | -17.466 | 388.162 | -4,31 | 32,11 | -560.833 | 12.463.882 | |
| 2014-11-25 |
|
4 | PF |
Pinnacle Foods Inc.
Common Stock |
S - Sale | -343.640 | 405.628 | -45,86 | 32,11 | -11.034.280 | 13.024.715 | |
| 2014-11-25 |
|
4 | PF |
Pinnacle Foods Inc.
Common Stock |
S - Sale | -3.606 | 80.149 | -4,31 | 32,11 | -115.789 | 2.573.584 | |
| 2014-11-25 |
|
4 | PF |
Pinnacle Foods Inc.
Common Stock |
S - Sale | -70.956 | 83.755 | -45,86 | 32,11 | -2.278.397 | 2.689.373 | |
| 2014-11-25 |
|
4 | PF |
Pinnacle Foods Inc.
Common Stock |
S - Sale | -33.034 | 734.156 | -4,31 | 32,11 | -1.060.722 | 23.573.749 | |
| 2014-11-25 |
|
4 | PF |
Pinnacle Foods Inc.
Common Stock |
S - Sale | -649.947 | 767.190 | -45,86 | 32,11 | -20.869.798 | 24.634.471 | |
| 2014-11-25 |
|
4 | PF |
Pinnacle Foods Inc.
Common Stock |
S - Sale | -558.888 | 12.420.802 | -4,31 | 32,11 | -17.945.894 | 398.831.952 | |
| 2014-11-25 |
|
4 | PF |
Pinnacle Foods Inc.
Common Stock |
S - Sale | -10.996.114 | 12.979.690 | -45,86 | 32,11 | -353.085.221 | 416.777.846 | |
| 2014-11-18 |
|
4 | BRX |
Brixmor Property Group Inc.
Common Units of Brixmor Operating Partnership LP |
C - Conversion | -1.079.543 | 6.430.258 | -14,38 | ||||
| 2014-11-18 |
|
4 | BRX |
Brixmor Property Group Inc.
Common Units of Brixmor Operating Partnership LP |
C - Conversion | -178.828 | 1.065.182 | -14,38 | ||||
| 2014-11-18 |
|
4 | BRX |
Brixmor Property Group Inc.
Common Stock of BPG Subsidiary Inc. |
C - Conversion | -49.344.411 | 0 | -100,00 | ||||
| 2014-11-18 |
|
4 | BRX |
Brixmor Property Group Inc.
Common Stock |
S - Sale | -562.096 | 387.904 | -59,17 | 23,16 | -13.016.064 | 8.982.421 | |
| 2014-11-18 |
|
4 | BRX |
Brixmor Property Group Inc.
Common Stock |
S - Sale | -17.617 | 0 | -100,00 | 23,16 | -407.945 | ||
| 2014-11-18 |
|
4 | BRX |
Brixmor Property Group Inc.
Common Stock |
S - Sale | -18.405 | 252.152 | -6,80 | 23,16 | -426.192 | 5.838.907 | |
| 2014-11-18 |
|
4 | BRX |
Brixmor Property Group Inc.
Common Stock |
S - Sale | -10.268 | 0 | -100,00 | 23,16 | -237.769 | ||
| 2014-11-18 |
|
4 | BRX |
Brixmor Property Group Inc.
Common Stock |
S - Sale | -10.729 | 146.973 | -6,80 | 23,16 | -248.444 | 3.403.351 | |
| 2014-11-18 |
|
4 | BRX |
Brixmor Property Group Inc.
Common Stock |
S - Sale | -1.383.041 | 0 | -100,00 | 23,16 | -32.026.112 | ||
| 2014-11-18 |
|
4 | BRX |
Brixmor Property Group Inc.
Common Stock |
S - Sale | -1.444.943 | 19.795.689 | -6,80 | 23,16 | -33.459.534 | 458.394.913 | |
| 2014-11-18 |
|
4 | BRX |
Brixmor Property Group Inc.
Common Stock |
S - Sale | -642.793 | 0 | -100,00 | 23,16 | -14.884.708 | ||
| 2014-11-18 |
|
4 | BRX |
Brixmor Property Group Inc.
Common Stock |
S - Sale | -671.564 | 9.200.403 | -6,80 | 23,16 | -15.550.937 | 213.047.292 | |
| 2014-11-18 |
|
4 | BRX |
Brixmor Property Group Inc.
Common Stock |
S - Sale | -8.627.934 | 88.802.646 | -8,86 | 23,16 | -199.791.028 | 2.056.340.712 | |
| 2014-11-18 |
|
4 | BRX |
Brixmor Property Group Inc.
Common Stock |
S - Sale | -4.344.000 | 2.000.000 | -68,47 | 23,16 | -100.590.967 | 46.312.600 | |
| 2014-11-18 |
|
4 | BRX |
Brixmor Property Group Inc.
Common Stock |
S - Sale | -4.270 | 29.887 | -12,50 | 23,16 | -98.877 | 692.072 | |
| 2014-11-18 |
|
4 | BRX |
Brixmor Property Group Inc.
Common Stock |
S - Sale | -938.733 | 140.810 | -86,96 | 23,16 | -21.737.583 | 3.260.639 | |
| 2014-11-18 |
|
4 | BRX |
Brixmor Property Group Inc.
Common Stock |
C - Conversion | 1.079.543 | 1.079.543 | |||||
| 2014-11-18 |
|
4 | BRX |
Brixmor Property Group Inc.
Common Stock |
S - Sale | -155.503 | 23.325 | -86,96 | 23,16 | -3.600.874 | 540.121 | |
| 2014-11-18 |
|
4 | BRX |
Brixmor Property Group Inc.
Common Stock |
C - Conversion | 178.828 | 178.828 | |||||
| 2014-11-18 |
|
4 | BRX |
Brixmor Property Group Inc.
Common Stock |
S - Sale | -6.168.104 | 43.176.307 | -12,50 | 23,16 | -142.830.467 | 999.803.518 | |
| 2014-11-18 |
|
4 | BRX |
Brixmor Property Group Inc.
Common Stock |
C - Conversion | 49.344.411 | 49.344.411 | |||||
| 2014-11-18 |
|
4 | BRX |
Brixmor Property Group Inc.
Common Stock |
S - Sale | -84.314 | 303.590 | -21,74 | 23,16 | -1.952.400 | 7.030.021 | |
| 2014-11-18 |
|
4 | BRX |
Brixmor Property Group Inc.
Common Stock |
S - Sale | -5.888 | 246.264 | -2,34 | 23,16 | -136.344 | 5.702.563 | |
| 2014-11-18 |
|
4 | BRX |
Brixmor Property Group Inc.
Common Stock |
S - Sale | -3.431 | 143.542 | -2,33 | 23,16 | -79.449 | 3.323.902 | |
| 2014-11-18 |
|
4 | BRX |
Brixmor Property Group Inc.
Common Stock |
S - Sale | -462.253 | 19.333.436 | -2,34 | 23,16 | -10.704.069 | 447.690.844 | |
| 2014-11-18 |
|
4 | BRX |
Brixmor Property Group Inc.
Common Stock |
S - Sale | -214.840 | 8.985.563 | -2,34 | 23,16 | -4.974.899 | 208.072.392 | |
| 2014-11-18 |
|
4 | BRX |
Brixmor Property Group Inc.
Common Stock |
S - Sale | -1.889.923 | 86.912.723 | -2,13 | 23,16 | -43.763.624 | 2.012.577.088 | |
| 2014-11-18 |
|
4 | BRX |
Brixmor Property Group Inc.
Common Stock |
S - Sale | -140.810 | 0 | -100,00 | 23,16 | -3.260.639 | ||
| 2014-11-18 |
|
4 | BRX |
Brixmor Property Group Inc.
Common Stock |
S - Sale | -23.325 | 0 | -100,00 | 23,16 | -540.121 | ||
| 2014-11-18 |
|
4 | BRX |
Brixmor Property Group Inc.
Common Stock |
S - Sale | -925.216 | 42.251.091 | -2,14 | 23,16 | -21.424.579 | 978.378.939 | |
| 2014-11-10 |
|
4 | HLT |
Hilton Worldwide Holdings Inc.
Common Stock |
S - Sale | -8.006 | 282.279 | -2,76 | 24,50 | -196.147 | 6.915.836 | |
| 2014-11-10 |
|
4 | HLT |
Hilton Worldwide Holdings Inc.
Common Stock |
S - Sale | -1.246.888 | 47.611.887 | -2,55 | 24,50 | -30.548.756 | 1.166.491.232 | |
| 2014-11-10 |
|
4 | HLT |
Hilton Worldwide Holdings Inc.
Common Stock |
S - Sale | -47.506 | 1.674.976 | -2,76 | 24,50 | -1.163.897 | 41.036.912 | |
| 2014-11-10 |
|
4 | HLT |
Hilton Worldwide Holdings Inc.
Common Stock |
S - Sale | -2.584 | 98.556 | -2,55 | 24,50 | -63.308 | 2.414.622 | |
| 2014-11-10 |
|
4 | HLT |
Hilton Worldwide Holdings Inc.
Common Stock |
S - Sale | -408.277 | 16.472.893 | -2,42 | 24,50 | -10.002.786 | 403.585.878 | |
| 2014-11-10 |
|
4 | HLT |
Hilton Worldwide Holdings Inc.
Common Stock |
S - Sale | -11.786.739 | 94.650.659 | -11,07 | 24,50 | -288.775.106 | 2.318.941.146 | |
| 2014-11-10 |
|
4 | HLT |
Hilton Worldwide Holdings Inc.
Common Stock |
S - Sale | -46.737 | 290.285 | -13,87 | 24,50 | -1.145.056 | 7.111.982 | |
| 2014-11-10 |
|
4 | HLT |
Hilton Worldwide Holdings Inc.
Common Stock |
S - Sale | -7.872.900 | 48.858.775 | -13,88 | 24,50 | -192.886.050 | 1.197.039.988 | |
| 2014-11-10 |
|
4 | HLT |
Hilton Worldwide Holdings Inc.
Common Stock |
S - Sale | -277.327 | 1.722.482 | -13,87 | 24,50 | -6.794.512 | 42.200.809 | |
| 2014-11-10 |
|
4 | HLT |
Hilton Worldwide Holdings Inc.
Common Stock |
S - Sale | -16.318 | 101.140 | -13,89 | 24,50 | -399.791 | 2.477.930 | |
| 2014-11-10 |
|
4 | HLT |
Hilton Worldwide Holdings Inc.
Common Stock |
S - Sale | -2.723.604 | 16.881.170 | -13,89 | 24,50 | -66.728.298 | 413.588.665 | |
| 2014-11-10 |
|
4 | HLT |
Hilton Worldwide Holdings Inc.
Common Stock |
S - Sale | -79.063.114 | 106.437.398 | -42,62 | 24,50 | -1.937.046.293 | 2.607.716.251 | |
| 2014-10-16 |
|
4 | PF |
Pinnacle Foods Inc.
Common Stock |
S - Sale | -1.492 | 28.377 | -5,00 | 31,90 | -47.595 | 905.226 | |
| 2014-10-16 |
|
4 | PF |
Pinnacle Foods Inc.
Common Stock |
S - Sale | -18.778 | 358.041 | -4,98 | 31,90 | -599.018 | 11.421.508 | |
| 2014-10-16 |
|
4 | PF |
Pinnacle Foods Inc.
Common Stock |
S - Sale | -11.402 | 217.437 | -4,98 | 31,90 | -363.724 | 6.936.240 | |
| 2014-10-16 |
|
4 | PF |
Pinnacle Foods Inc.
Common Stock |
S - Sale | -46.657 | 889.608 | -4,98 | 31,90 | -1.488.358 | 28.378.495 | |
| 2014-10-16 |
|
4 | PF |
Pinnacle Foods Inc.
Common Stock |
S - Sale | -367.515 | 7.007.086 | -4,98 | 31,90 | -11.723.728 | 223.526.043 | |
| 2014-10-16 |
|
4 | PF |
Pinnacle Foods Inc.
Common Stock |
S - Sale | -421.878 | 8.043.694 | -4,98 | 31,90 | -13.457.908 | 256.593.839 | |
| 2014-10-16 |
|
4 | PF |
Pinnacle Foods Inc.
Common Stock |
S - Sale | -3.041 | 57.983 | -4,98 | 31,90 | -97.008 | 1.849.658 | |
| 2014-10-16 |
|
4 | PF |
Pinnacle Foods Inc.
Common Stock |
S - Sale | -39.298 | 749.268 | -4,98 | 31,90 | -1.253.606 | 23.901.649 | |
| 2014-10-16 |
|
4 | PF |
Pinnacle Foods Inc.
Common Stock |
S - Sale | -8.114 | 154.711 | -4,98 | 31,90 | -258.837 | 4.935.281 | |
| 2014-10-16 |
|
4 | PF |
Pinnacle Foods Inc.
Common Stock |
S - Sale | -74.327 | 1.417.137 | -4,98 | 31,90 | -2.371.031 | 45.206.670 | |
| 2014-10-16 |
|
4 | PF |
Pinnacle Foods Inc.
Common Stock |
S - Sale | -1.257.497 | 23.975.804 | -4,98 | 31,90 | -40.114.154 | 764.828.148 | |
| 2014-10-10 |
|
4 | KOS |
Kosmos Energy Ltd.
Common Shares |
S - Sale | -18.345 | 270.001 | -6,36 | 9,33 | -171.159 | 2.519.109 | |
| 2014-10-10 |
|
4 | KOS |
Kosmos Energy Ltd.
Common Shares |
S - Sale | -135.106 | 1.988.529 | -6,36 | 9,33 | -1.260.539 | 18.552.976 | |
| 2014-10-10 |
|
4 | KOS |
Kosmos Energy Ltd.
Common Shares |
S - Sale | -162.720 | 2.394.968 | -6,36 | 9,33 | -1.518.178 | 22.345.051 | |
| 2014-10-10 |
|
4 | KOS |
Kosmos Energy Ltd.
Common Shares |
S - Sale | -103.240 | 1.474.644 | -6,54 | 9,33 | -963.229 | 13.758.429 | |
| 2014-10-10 |
|
4 | KOS |
Kosmos Energy Ltd.
Common Shares |
S - Sale | -6.330.589 | 90.424.370 | -6,54 | 9,33 | -59.064.395 | 843.659.372 | |
| 2014-10-03 |
|
4 | HLT |
Hilton Worldwide Holdings Inc.
Common Stock |
J - Other | -37.402 | 56.731.675 | -0,07 | ||||
| 2014-10-03 |
|
4 | HLT |
Hilton Worldwide Holdings Inc.
Common Stock |
J - Other | -35.429 | 0 | -100,00 | ||||
| 2014-10-03 |
|
4 | HLT |
Hilton Worldwide Holdings Inc.
Common Stock |
J - Other | -1.024.980 | 0 | -100,00 | ||||
| 2014-09-30 | 3 | VSLR |
Vivint Solar, Inc.
Common Stock |
164.718.748 | ||||||||
| 2014-09-30 | 3 | VSLR |
Vivint Solar, Inc.
Common Stock |
164.718.748 | ||||||||
| 2014-09-30 | 3 | VSLR |
Vivint Solar, Inc.
Common Stock |
164.718.748 | ||||||||
| 2014-09-30 | 3 | VSLR |
Vivint Solar, Inc.
Common Stock |
164.718.748 | ||||||||
| 2014-09-30 | 3 | VSLR |
Vivint Solar, Inc.
Common Stock |
164.718.748 | ||||||||
| 2014-09-30 | 3 | VSLR |
Vivint Solar, Inc.
Common Stock |
164.718.748 | ||||||||
| 2014-09-30 | 3 | VSLR |
Vivint Solar, Inc.
Common Stock |
164.718.748 | ||||||||
| 2014-09-30 | 3 | VSLR |
Vivint Solar, Inc.
Common Stock |
164.718.748 | ||||||||
| 2014-09-30 | 3 | VSLR |
Vivint Solar, Inc.
Common Stock |
164.718.748 | ||||||||
| 2014-09-30 | 3 | VSLR |
Vivint Solar, Inc.
Common Stock |
164.718.748 | ||||||||
| 2014-09-30 | 3 | VSLR |
Vivint Solar, Inc.
Common Stock |
164.718.748 | ||||||||
| 2014-09-24 | 3 | TVPT |
Travelport Worldwide LTD
Common Shares, $0.0025 par value per share |
25.009.480 | ||||||||
| 2014-09-24 | 3 | TVPT |
Travelport Worldwide LTD
Common Shares, $0.0025 par value per share |
25.009.480 | ||||||||
| 2014-09-24 | 3 | TVPT |
Travelport Worldwide LTD
Common Shares, $0.0025 par value per share |
25.009.480 | ||||||||
| 2014-09-24 | 3 | TVPT |
Travelport Worldwide LTD
Common Shares, $0.0025 par value per share |
25.009.480 | ||||||||
| 2014-09-24 | 3 | TVPT |
Travelport Worldwide LTD
Common Shares, $0.0025 par value per share |
25.009.480 | ||||||||
| 2014-09-24 | 3 | TVPT |
Travelport Worldwide LTD
Common Shares, $0.0025 par value per share |
25.009.480 | ||||||||
| 2014-09-24 | 3 | TVPT |
Travelport Worldwide LTD
Common Shares, $0.0025 par value per share |
25.009.480 | ||||||||
| 2014-09-24 | 3 | TVPT |
Travelport Worldwide LTD
Common Shares, $0.0025 par value per share |
25.009.480 | ||||||||
| 2014-09-24 | 3 | TVPT |
Travelport Worldwide LTD
Common Shares, $0.0025 par value per share |
25.009.480 | ||||||||
| 2014-09-24 | 3 | TVPT |
Travelport Worldwide LTD
Common Shares, $0.0025 par value per share |
25.009.480 | ||||||||
| 2014-09-16 |
|
4 | PF |
Pinnacle Foods Inc.
Common Stock |
S - Sale | -9.808 | 29.869 | -24,72 | 31,90 | -312.875 | 952.821 | |
| 2014-09-16 |
|
4 | PF |
Pinnacle Foods Inc.
Common Stock |
S - Sale | -123.731 | 376.819 | -24,72 | 31,90 | -3.947.019 | 12.020.526 | |
| 2014-09-16 |
|
4 | PF |
Pinnacle Foods Inc.
Common Stock |
S - Sale | -75.141 | 228.839 | -24,72 | 31,90 | -2.396.998 | 7.299.964 | |
| 2014-09-16 |
|
4 | PF |
Pinnacle Foods Inc.
Common Stock |
S - Sale | -307.428 | 936.265 | -24,72 | 31,90 | -9.806.953 | 29.866.854 | |
| 2014-09-16 |
|
4 | PF |
Pinnacle Foods Inc.
Common Stock |
S - Sale | -2.421.496 | 7.374.601 | -24,72 | 31,90 | -77.245.722 | 235.249.772 | |
| 2014-09-16 |
|
4 | PF |
Pinnacle Foods Inc.
Common Stock |
S - Sale | -2.779.722 | 8.465.572 | -24,72 | 31,90 | -88.673.132 | 270.051.747 | |
| 2014-09-16 |
|
4 | PF |
Pinnacle Foods Inc.
Common Stock |
S - Sale | -20.037 | 61.024 | -24,72 | 31,90 | -639.180 | 1.946.666 | |
| 2014-09-16 |
|
4 | PF |
Pinnacle Foods Inc.
Common Stock |
S - Sale | -258.931 | 788.566 | -24,72 | 31,90 | -8.259.899 | 25.155.255 | |
| 2014-09-16 |
|
4 | PF |
Pinnacle Foods Inc.
Common Stock |
S - Sale | -53.465 | 162.825 | -24,72 | 31,90 | -1.705.534 | 5.194.118 | |
| 2014-09-16 |
|
4 | PF |
Pinnacle Foods Inc.
Common Stock |
S - Sale | -489.731 | 1.491.464 | -24,72 | 31,90 | -15.622.419 | 47.577.702 | |
| 2014-09-16 |
|
4 | PF |
Pinnacle Foods Inc.
Common Stock |
S - Sale | -8.285.510 | 25.233.301 | -24,72 | 31,90 | -264.307.769 | 804.942.302 | |
| 2014-08-13 |
|
4 | STAY |
Extended Stay America, Inc.
Paired Shares |
S - Sale | -24.677 | 145.243 | -14,52 | 21,10 | -520.623 | 3.064.264 | |
| 2014-08-13 |
|
4 | STAY |
Extended Stay America, Inc.
Paired Shares |
S - Sale | -1.549.538 | 9.216.322 | -14,39 | 21,10 | -32.691.378 | 194.441.353 | |
| 2014-08-13 |
|
4 | STAY |
Extended Stay America, Inc.
Paired Shares |
S - Sale | -2.050.865 | 12.070.866 | -14,52 | 21,10 | -43.268.124 | 254.665.095 | |
| 2014-08-13 |
|
4 | STAY |
Extended Stay America, Inc.
Paired Shares |
S - Sale | -954.031 | 5.615.178 | -14,52 | 21,10 | -20.127.669 | 118.466.218 | |
| 2014-08-13 |
|
4 | STAY |
Extended Stay America, Inc.
Paired Shares |
S - Sale | -10.019 | 59.584 | -14,39 | 21,10 | -211.376 | 1.257.073 | |
| 2014-08-13 |
|
4 | STAY |
Extended Stay America, Inc.
Paired Shares |
S - Sale | -501.058 | 2.950.676 | -14,52 | 21,10 | -10.571.071 | 62.251.887 | |
| 2014-08-13 |
|
4 | STAY |
Extended Stay America, Inc.
Paired Shares |
S - Sale | -1.489.572 | 8.859.861 | -14,39 | 21,10 | -31.426.245 | 186.920.917 | |
| 2014-08-13 |
|
4 | STAY |
Extended Stay America, Inc.
Paired Shares |
S - Sale | -1.470.240 | 8.743.862 | -14,39 | 21,10 | -31.018.388 | 184.473.629 | |
| 2014-08-13 |
|
4 | NONE |
ESH Hospitality, Inc.
Paired Shares |
S - Sale | -24.677 | 145.243 | -14,52 | 21,10 | -520.623 | 3.064.264 | |
| 2014-08-13 |
|
4 | NONE |
ESH Hospitality, Inc.
Paired Shares |
S - Sale | -1.549.538 | 9.216.322 | -14,39 | 21,10 | -32.691.378 | 194.441.353 | |
| 2014-08-13 |
|
4 | NONE |
ESH Hospitality, Inc.
Paired Shares |
S - Sale | -2.050.865 | 12.070.866 | -14,52 | 21,10 | -43.268.124 | 254.665.095 | |
| 2014-08-13 |
|
4 | NONE |
ESH Hospitality, Inc.
Paired Shares |
S - Sale | -954.031 | 5.615.178 | -14,52 | 21,10 | -20.127.669 | 118.466.218 | |
| 2014-08-13 |
|
4 | NONE |
ESH Hospitality, Inc.
Paired Shares |
S - Sale | -10.019 | 59.584 | -14,39 | 21,10 | -211.376 | 1.257.073 | |
| 2014-08-13 |
|
4 | NONE |
ESH Hospitality, Inc.
Paired Shares |
S - Sale | -501.058 | 2.950.676 | -14,52 | 21,10 | -10.571.071 | 62.251.887 | |
| 2014-08-13 |
|
4 | NONE |
ESH Hospitality, Inc.
Paired Shares |
S - Sale | -1.489.572 | 8.859.861 | -14,39 | 21,10 | -31.426.245 | 186.920.917 | |
| 2014-08-13 |
|
4 | NONE |
ESH Hospitality, Inc.
Paired Shares |
S - Sale | -1.470.240 | 8.743.862 | -14,39 | 21,10 | -31.018.388 | 184.473.629 | |
| 2014-07-31 | 3 | CTLT |
Catalent, Inc.
Common Stock |
129.072.304 | ||||||||
| 2014-07-31 | 3 | CTLT |
Catalent, Inc.
Common Stock |
129.072.304 | ||||||||
| 2014-07-31 | 3 | CTLT |
Catalent, Inc.
Common Stock |
129.072.304 | ||||||||
| 2014-07-31 | 3 | CTLT |
Catalent, Inc.
Common Stock |
129.072.304 | ||||||||
| 2014-07-31 | 3 | CTLT |
Catalent, Inc.
Common Stock |
129.072.304 | ||||||||
| 2014-07-31 | 3 | CTLT |
Catalent, Inc.
Common Stock |
129.072.304 | ||||||||
| 2014-07-31 | 3 | CTLT |
Catalent, Inc.
Common Stock |
129.072.304 | ||||||||
| 2014-07-31 | 3 | CTLT |
Catalent, Inc.
Common Stock |
129.072.304 | ||||||||
| 2014-07-31 | 3 | CTLT |
Catalent, Inc.
Common Stock |
129.072.304 | ||||||||
| 2014-07-31 | 3 | CTLT |
Catalent, Inc.
Common Stock |
129.072.304 | ||||||||
| 2014-07-31 | 3 | CTLT |
Catalent, Inc.
Common Stock |
129.072.304 | ||||||||
| 2014-07-17 |
|
4 | KOS |
Kosmos Energy Ltd.
Common Shares |
S - Sale | -23.910 | 288.346 | -7,66 | 9,85 | -235.514 | 2.840.208 | |
| 2014-07-17 |
|
4 | KOS |
Kosmos Energy Ltd.
Common Shares |
S - Sale | -176.088 | 2.123.635 | -7,66 | 9,85 | -1.734.467 | 20.917.805 | |
| 2014-07-17 |
|
4 | KOS |
Kosmos Energy Ltd.
Common Shares |
S - Sale | -212.078 | 2.557.688 | -7,66 | 9,85 | -2.088.968 | 25.193.227 | |
| 2014-07-17 |
|
4 | KOS |
Kosmos Energy Ltd.
Common Shares |
S - Sale | -134.556 | 1.577.884 | -7,86 | 9,85 | -1.325.377 | 15.542.157 | |
| 2014-07-17 |
|
4 | KOS |
Kosmos Energy Ltd.
Common Shares |
S - Sale | -8.250.868 | 96.754.959 | -7,86 | 9,85 | -81.271.050 | 953.036.346 | |
| 2014-07-03 |
|
4 | BRX |
Brixmor Property Group Inc.
Common Stock |
S - Sale | -772.827 | 4.496.722 | -14,67 | 21,77 | -16.823.516 | 97.888.242 | |
| 2014-07-03 |
|
4 | BRX |
Brixmor Property Group Inc.
Common Stock |
S - Sale | -213.801 | 0 | -100,00 | 21,77 | -4.654.191 | ||
| 2014-07-03 |
|
4 | BRX |
Brixmor Property Group Inc.
Common Stock |
S - Sale | -1.290.669 | 0 | -100,00 | 21,77 | -28.096.315 | ||
| 2014-07-03 |
|
4 | BRX |
Brixmor Property Group Inc.
Common Stock |
S - Sale | -8.480.555 | 0 | -100,00 | 21,77 | -184.611.506 | ||
| 2014-07-03 |
|
4 | BRX |
Brixmor Property Group Inc.
Common Stock |
S - Sale | -23.684.648 | 137.809.974 | -14,67 | 21,77 | -515.586.365 | 2.999.957.762 | |
| 2014-07-03 |
|
4 | BRX |
Brixmor Property Group Inc.
Common Units of Brixmor Operating Partnership LP |
C - Conversion | -5.483.350 | 1.244.010 | -81,51 | ||||
| 2014-07-03 |
|
4 | BRX |
Brixmor Property Group Inc.
Common Units of Brixmor Operating Partnership LP |
C - Conversion | -1.290.669 | 7.509.801 | -14,67 | ||||
| 2014-07-03 |
|
4 | BRX |
Brixmor Property Group Inc.
Common Stock of BPG Subsidiary Inc. |
C - Conversion | -8.480.555 | 49.344.411 | -14,67 | ||||
| 2014-07-03 |
|
4 | BRX |
Brixmor Property Group Inc.
Common Stock |
J - Other | -5.269.549 | 213.801 | -96,10 | ||||
| 2014-07-03 |
|
4 | BRX |
Brixmor Property Group Inc.
Common Stock |
C - Conversion | 5.483.350 | 5.483.350 | |||||
| 2014-07-03 |
|
4 | BRX |
Brixmor Property Group Inc.
Common Stock |
C - Conversion | 1.290.669 | 1.290.669 | |||||
| 2014-07-03 |
|
4 | BRX |
Brixmor Property Group Inc.
Common Stock |
C - Conversion | 8.480.555 | 8.480.555 | |||||
| 2014-07-01 |
|
4 | HLT |
Hilton Worldwide Holdings Inc.
Common Stock |
J - Other | -59.105.908 | 569.104.195 | -9,41 | ||||
| 2014-07-01 |
|
4 | HLT |
Hilton Worldwide Holdings Inc.
Common Stock |
S - Sale | -3.150.910 | 19.757.661 | -13,75 | 21,94 | -69.123.088 | 433.433.688 | |
| 2014-07-01 |
|
4 | HLT |
Hilton Worldwide Holdings Inc.
Common Stock |
S - Sale | -100.349.090 | 629.235.083 | -13,75 | 21,94 | -2.201.408.162 | 13.803.844.633 | |
| 2014-06-26 | 3 | MIK |
Michaels Companies, Inc.
Common Stock |
142.954.931 | ||||||||
| 2014-06-26 | 3 | MIK |
Michaels Companies, Inc.
Common Stock |
95.521.206 | ||||||||
| 2014-06-26 | 3 | MIK |
Michaels Companies, Inc.
Common Stock |
82.336.468 | ||||||||
| 2014-06-26 | 3 | MIK |
Michaels Companies, Inc.
Common Stock |
81.642.595 | ||||||||
| 2014-06-26 | 3 | MIK |
Michaels Companies, Inc.
Common Stock |
84.197.846 | ||||||||
| 2014-06-26 | 3 | MIK |
Michaels Companies, Inc.
Common Stock |
83.536.364 | ||||||||
| 2014-06-26 | 3 | MIK |
Michaels Companies, Inc.
Common Stock |
142.954.931 | ||||||||
| 2014-06-26 | 3 | MIK |
Michaels Companies, Inc.
Common Stock |
95.521.206 | ||||||||
| 2014-06-26 | 3 | MIK |
Michaels Companies, Inc.
Common Stock |
82.336.468 | ||||||||
| 2014-06-26 | 3 | MIK |
Michaels Companies, Inc.
Common Stock |
81.642.595 | ||||||||
| 2014-06-26 | 3 | MIK |
Michaels Companies, Inc.
Common Stock |
84.197.846 | ||||||||
| 2014-06-26 | 3 | MIK |
Michaels Companies, Inc.
Common Stock |
83.536.364 | ||||||||
| 2014-06-18 |
|
4 | PBF |
PBF Energy Inc.
Series A Units of PBF Energy |
C - Conversion | -31.865 | 6.735 | -82,55 | ||||
| 2014-06-18 |
|
4 | PBF |
PBF Energy Inc.
Series A Units of PBF Energy |
C - Conversion | -263.373 | 55.669 | -82,55 | ||||
| 2014-06-18 |
|
4 | PBF |
PBF Energy Inc.
Series A Units of PBF Energy |
C - Conversion | -69.353 | 14.659 | -82,55 | ||||
| 2014-06-18 |
|
4 | PBF |
PBF Energy Inc.
Series A Units of PBF Energy |
C - Conversion | -2.253.028 | 476.222 | -82,55 | ||||
| 2014-06-18 |
|
4 | PBF |
PBF Energy Inc.
Series A Units of PBF Energy |
C - Conversion | -12.573.720 | 2.657.702 | -82,55 | ||||
| 2014-06-18 |
|
4 | PBF |
PBF Energy Inc.
Class A Common Stock |
S - Sale | -31.865 | 0 | -100,00 | 29,75 | -947.995 | ||
| 2014-06-18 |
|
4 | PBF |
PBF Energy Inc.
Class A Common Stock |
C - Conversion | 31.865 | 31.865 | |||||
| 2014-06-18 |
|
4 | PBF |
PBF Energy Inc.
Class A Common Stock |
S - Sale | -263.373 | 0 | -100,00 | 29,75 | -7.835.335 | ||
| 2014-06-18 |
|
4 | PBF |
PBF Energy Inc.
Class A Common Stock |
C - Conversion | 263.373 | 263.373 | |||||
| 2014-06-18 |
|
4 | PBF |
PBF Energy Inc.
Class A Common Stock |
S - Sale | -69.353 | 0 | -100,00 | 29,75 | -2.063.250 | ||
| 2014-06-18 |
|
4 | PBF |
PBF Energy Inc.
Class A Common Stock |
C - Conversion | 69.353 | 69.353 | |||||
| 2014-06-18 |
|
4 | PBF |
PBF Energy Inc.
Class A Common Stock |
S - Sale | -2.253.028 | 0 | -100,00 | 29,75 | -67.027.581 | ||
| 2014-06-18 |
|
4 | PBF |
PBF Energy Inc.
Class A Common Stock |
C - Conversion | 2.253.028 | 2.253.028 | |||||
| 2014-06-18 |
|
4 | PBF |
PBF Energy Inc.
Class A Common Stock |
S - Sale | -12.573.720 | 0 | -100,00 | 29,75 | -374.068.174 | ||
| 2014-06-18 |
|
4 | PBF |
PBF Energy Inc.
Class A Common Stock |
C - Conversion | 12.573.720 | 12.573.720 | |||||
| 2014-06-10 |
|
4 | NLSN |
Nielsen N.V.
Common Stock |
S - Sale | -173.543 | 575.300 | -23,17 | 47,08 | -8.170.404 | 27.085.124 | |
| 2014-06-10 |
|
4 | NLSN |
Nielsen N.V.
Common Stock |
S - Sale | -39.157 | 129.805 | -23,18 | 47,08 | -1.843.512 | 6.111.219 | |
| 2014-06-10 |
|
4 | NLSN |
Nielsen N.V.
Common Stock |
S - Sale | -194.018 | 643.176 | -23,17 | 47,08 | -9.134.367 | 30.280.726 | |
| 2014-06-10 |
|
4 | NLSN |
Nielsen N.V.
Common Stock |
S - Sale | -2.265.316 | 7.509.579 | -23,17 | 47,08 | -106.651.077 | 353.550.979 | |
| 2014-06-10 |
|
4 | NLSN |
Nielsen N.V.
Common Stock |
S - Sale | -15.850 | 52.543 | -23,17 | 47,08 | -746.218 | 2.473.724 | |
| 2014-06-10 |
|
4 | NLSN |
Nielsen N.V.
Common Stock |
S - Sale | -76.993 | 255.233 | -23,17 | 47,08 | -3.624.830 | 12.016.370 | |
| 2014-06-10 |
|
4 | NLSN |
Nielsen N.V.
Common Stock |
S - Sale | -2.446.804 | 8.111.214 | -23,17 | 47,08 | -115.195.532 | 381.875.955 | |
| 2014-04-14 | 3 | NONE |
FS Investment Corp III
Common Stock |
1.111.112 | ||||||||
| 2014-04-14 | 3 | NONE |
FS Investment Corp III
Common Stock |
1.111.112 | ||||||||
| 2014-04-14 | 3 | NONE |
FS Investment Corp III
Common Stock |
1.111.112 | ||||||||
| 2014-04-14 | 3 | NONE |
FS Investment Corp III
Common Stock |
1.111.112 | ||||||||
| 2014-04-14 | 3 | NONE |
FS Investment Corp III
Common Stock |
1.111.112 | ||||||||
| 2014-04-14 | 3 | NONE |
FS Investment Corp III
Common Stock |
1.111.112 | ||||||||
| 2014-04-14 | 3 | NONE |
FS Investment Corp III
Common Stock |
1.111.112 | ||||||||
| 2014-04-14 | 3 | NONE |
FS Investment Corp III
Common Stock |
1.111.112 | ||||||||
| 2014-04-14 | 3 | NONE |
FS Investment Corp III
Common Stock |
1.111.112 | ||||||||
| 2014-04-14 | 3 | NONE |
FS Investment Corp III
Common Stock |
1.111.112 | ||||||||
| 2014-04-14 | 3 | NONE |
FS Investment Corp III
Common Stock |
1.111.112 | ||||||||
| 2014-04-11 |
|
4/A | N/A |
Blackstone Real Estate Income Fund II
Institutional Class II Common Shares of Beneficial Interest |
P - Purchase | 12.500 | 12.550 | 25.000,00 | 1.000,00 | 12.500.000 | 12.550.000 | |
| 2014-04-09 | 3 | LQ |
La Quinta Holdings Inc.
Common Stock |
113.613.848 | ||||||||
| 2014-04-09 | 3 | LQ |
La Quinta Holdings Inc.
Common Stock |
86.383.860 | ||||||||
| 2014-04-09 | 3 | LQ |
La Quinta Holdings Inc.
Common Stock |
84.491.230 | ||||||||
| 2014-04-09 | 3 | LQ |
La Quinta Holdings Inc.
Common Stock |
82.861.445 | ||||||||
| 2014-04-09 | 3 | LQ |
La Quinta Holdings Inc.
Common Stock |
82.369.712 | ||||||||
| 2014-04-09 | 3 | LQ |
La Quinta Holdings Inc.
Common Stock |
82.925.368 | ||||||||
| 2014-04-09 | 3 | LQ |
La Quinta Holdings Inc.
Common Stock |
83.257.808 | ||||||||
| 2014-04-09 | 3 | LQ |
La Quinta Holdings Inc.
Common Stock |
83.454.003 | ||||||||
| 2014-04-09 | 3 | LQ |
La Quinta Holdings Inc.
Common Stock |
82.451.487 | ||||||||
| 2014-04-09 | 3 | LQ |
La Quinta Holdings Inc.
Common Stock |
96.242.662 | ||||||||
| 2014-04-09 | 3 | LQ |
La Quinta Holdings Inc.
Common Stock |
85.629.835 | ||||||||
| 2014-04-09 | 3 | LQ |
La Quinta Holdings Inc.
Common Stock |
87.151.961 | ||||||||
| 2014-04-09 | 3 | LQ |
La Quinta Holdings Inc.
Common Stock |
95.180.485 | ||||||||
| 2014-04-09 | 3 | LQ |
La Quinta Holdings Inc.
Common Stock |
82.447.426 | ||||||||
| 2014-04-09 | 3 | LQ |
La Quinta Holdings Inc.
Common Stock |
84.108.086 | ||||||||
| 2014-04-09 | 3 | LQ |
La Quinta Holdings Inc.
Common Stock |
113.613.848 | ||||||||
| 2014-04-09 | 3 | LQ |
La Quinta Holdings Inc.
Common Stock |
86.383.860 | ||||||||
| 2014-04-09 | 3 | LQ |
La Quinta Holdings Inc.
Common Stock |
84.491.230 | ||||||||
| 2014-04-09 | 3 | LQ |
La Quinta Holdings Inc.
Common Stock |
82.861.445 | ||||||||
| 2014-04-09 | 3 | LQ |
La Quinta Holdings Inc.
Common Stock |
82.369.712 | ||||||||
| 2014-04-09 | 3 | LQ |
La Quinta Holdings Inc.
Common Stock |
82.925.368 | ||||||||
| 2014-04-09 | 3 | LQ |
La Quinta Holdings Inc.
Common Stock |
83.257.808 | ||||||||
| 2014-04-09 | 3 | LQ |
La Quinta Holdings Inc.
Common Stock |
83.454.003 | ||||||||
| 2014-04-09 | 3 | LQ |
La Quinta Holdings Inc.
Common Stock |
82.451.487 | ||||||||
| 2014-04-09 | 3 | LQ |
La Quinta Holdings Inc.
Common Stock |
96.242.662 | ||||||||
| 2014-04-09 | 3 | LQ |
La Quinta Holdings Inc.
Common Stock |
85.629.835 | ||||||||
| 2014-04-09 | 3 | LQ |
La Quinta Holdings Inc.
Common Stock |
87.151.961 | ||||||||
| 2014-04-09 | 3 | LQ |
La Quinta Holdings Inc.
Common Stock |
95.180.485 | ||||||||
| 2014-04-09 | 3 | LQ |
La Quinta Holdings Inc.
Common Stock |
82.447.426 | ||||||||
| 2014-04-09 | 3 | LQ |
La Quinta Holdings Inc.
Common Stock |
84.108.086 | ||||||||
| 2014-04-09 |
|
4 | SEAS |
SeaWorld Entertainment, Inc.
Common Stock |
S - Sale | -21.426 | 247.882 | -7,96 | 28,88 | -618.676 | 7.157.593 | |
| 2014-04-09 |
|
4 | SEAS |
SeaWorld Entertainment, Inc.
Common Stock |
S - Sale | -64.279 | 743.645 | -7,96 | 28,88 | -1.856.056 | 21.472.749 | |
| 2014-04-09 |
|
4 | SEAS |
SeaWorld Entertainment, Inc.
Common Stock |
S - Sale | -58.696 | 679.058 | -7,96 | 28,88 | -1.694.847 | 19.607.800 | |
| 2014-04-09 |
|
4 | SEAS |
SeaWorld Entertainment, Inc.
Common Stock |
S - Sale | -38.539 | 445.853 | -7,96 | 28,88 | -1.112.814 | 12.874.005 | |
| 2014-04-09 |
|
4 | SEAS |
SeaWorld Entertainment, Inc.
Common Stock |
S - Sale | -49.312 | 570.487 | -7,96 | 28,88 | -1.423.884 | 16.472.812 | |
| 2014-04-09 |
|
4 | SEAS |
SeaWorld Entertainment, Inc.
Common Stock |
S - Sale | -15.735 | 182.040 | -7,96 | 28,88 | -454.348 | 5.256.405 | |
| 2014-04-09 |
|
4 | SEAS |
SeaWorld Entertainment, Inc.
Common Stock |
S - Sale | -43.799 | 506.711 | -7,96 | 28,88 | -1.264.696 | 14.631.280 | |
| 2014-04-09 |
|
4 | SEAS |
SeaWorld Entertainment, Inc.
Common Stock |
S - Sale | -48.007 | 555.394 | -7,96 | 28,88 | -1.386.202 | 16.037.002 | |
| 2014-04-09 |
|
4 | SEAS |
SeaWorld Entertainment, Inc.
Common Stock |
S - Sale | -42.685 | 493.827 | -7,96 | 28,88 | -1.232.529 | 14.259.255 | |
| 2014-04-09 |
|
4 | SEAS |
SeaWorld Entertainment, Inc.
Common Stock |
S - Sale | -1.367.522 | 15.820.811 | -7,96 | 28,88 | -39.487.198 | 456.825.918 | |
| 2014-04-09 |
|
4 | SEAS |
SeaWorld Entertainment, Inc.
Common Stock |
S - Sale | -211.203 | 269.308 | -43,95 | 28,88 | -6.098.487 | 7.776.268 | |
| 2014-04-09 |
|
4 | SEAS |
SeaWorld Entertainment, Inc.
Common Stock |
S - Sale | -633.610 | 807.924 | -43,95 | 28,88 | -18.295.489 | 23.328.806 | |
| 2014-04-09 |
|
4 | SEAS |
SeaWorld Entertainment, Inc.
Common Stock |
S - Sale | -578.579 | 737.754 | -43,95 | 28,88 | -16.706.469 | 21.302.647 | |
| 2014-04-09 |
|
4 | SEAS |
SeaWorld Entertainment, Inc.
Common Stock |
S - Sale | -379.882 | 484.392 | -43,95 | 28,88 | -10.969.093 | 13.986.819 | |
| 2014-04-09 |
|
4 | SEAS |
SeaWorld Entertainment, Inc.
Common Stock |
S - Sale | -486.074 | 619.799 | -43,95 | 28,88 | -14.035.387 | 17.896.696 | |
| 2014-04-09 |
|
4 | SEAS |
SeaWorld Entertainment, Inc.
Common Stock |
S - Sale | -155.104 | 197.775 | -43,95 | 28,88 | -4.478.628 | 5.710.753 | |
| 2014-04-09 |
|
4 | SEAS |
SeaWorld Entertainment, Inc.
Common Stock |
S - Sale | -431.734 | 550.510 | -43,95 | 28,88 | -12.466.319 | 15.895.976 | |
| 2014-04-09 |
|
4 | SEAS |
SeaWorld Entertainment, Inc.
Common Stock |
S - Sale | -473.213 | 603.401 | -43,95 | 28,88 | -13.664.025 | 17.423.204 | |
| 2014-04-09 |
|
4 | SEAS |
SeaWorld Entertainment, Inc.
Common Stock |
S - Sale | -420.756 | 536.512 | -43,95 | 28,88 | -12.149.330 | 15.491.784 | |
| 2014-04-09 |
|
4 | SEAS |
SeaWorld Entertainment, Inc.
Common Stock |
S - Sale | -13.479.845 | 17.188.333 | -43,95 | 28,88 | -389.230.524 | 496.313.115 | |
| 2014-04-03 |
|
4 | N/A |
Blackstone Real Estate Income Fund
Common Shares of Beneficial Interest |
P - Purchase | 12.500 | 12.600 | 12.500,00 | 1.000,00 | 12.500.000 | 12.600.000 | |
| 2014-04-03 |
|
4 | N/A |
Blackstone Real Estate Income Fund II
Institutional Class II Common Shares of Beneficial Interest |
P - Purchase | 12.500 | 12.550 | 25.000,00 | 1.000,00 | 12.500.000 | 12.550.000 | |
| 2014-03-18 |
|
4 | XTXI |
CROSSTEX ENERGY INC
Common Stock, Par Value $0.01 Per Share |
J - Other | -1.878.520 | 0 | -100,00 | ||||
| 2014-03-18 |
|
4 | XTXI |
CROSSTEX ENERGY INC
Common Stock, Par Value $0.01 Per Share |
J - Other | -5.121.480 | 0 | -100,00 | ||||
| 2014-03-12 |
|
4 | NLSN |
Nielsen Holdings N.V.
Common Stock |
S - Sale | -203.284 | 748.843 | -21,35 | 46,25 | -9.401.885 | 34.633.989 | |
| 2014-03-12 |
|
4 | NLSN |
Nielsen Holdings N.V.
Common Stock |
S - Sale | -45.867 | 168.962 | -21,35 | 46,25 | -2.121.349 | 7.814.492 | |
| 2014-03-12 |
|
4 | NLSN |
Nielsen Holdings N.V.
Common Stock |
S - Sale | -227.268 | 837.194 | -21,35 | 46,25 | -10.511.145 | 38.720.222 | |
| 2014-03-12 |
|
4 | NLSN |
Nielsen Holdings N.V.
Common Stock |
S - Sale | -2.653.535 | 9.774.895 | -21,35 | 46,25 | -122.725.994 | 452.088.894 | |
| 2014-03-12 |
|
4 | NLSN |
Nielsen Holdings N.V.
Common Stock |
S - Sale | -18.566 | 68.393 | -21,35 | 46,25 | -858.678 | 3.163.176 | |
| 2014-03-12 |
|
4 | NLSN |
Nielsen Holdings N.V.
Common Stock |
S - Sale | -90.187 | 332.226 | -21,35 | 46,25 | -4.171.149 | 15.365.452 | |
| 2014-03-12 |
|
4 | NLSN |
Nielsen Holdings N.V.
Common Stock |
S - Sale | -2.866.125 | 10.558.018 | -21,35 | 46,25 | -132.558.281 | 488.308.332 | |
| 2014-03-03 |
|
4 | XTEX |
CROSSTEX ENERGY LP
Series A Convertible Preferred Units |
C - Conversion | -17.095.133 | 17.095.133 | -50,00 | ||||
| 2014-03-03 |
|
4 | XTEX |
CROSSTEX ENERGY LP
Common Units |
C - Conversion | 17.095.133 | 17.095.133 | |||||
| 2014-02-03 |
|
4 | XTEX |
CROSSTEX ENERGY LP
Series A Convertible Preferred Units |
J - Other | 452.185 | 17.095.132 | 2,72 | ||||
| 2014-01-29 |
|
4 | CROX |
Crocs, Inc.
Common Stock |
J - Other | 2.479 | 2.479 | |||||
| 2014-01-24 | 3 | N/A |
Blackstone Real Estate Income Fund II
Common Shares of Beneficial Interest |
100 | ||||||||
| 2014-01-24 | 3 | N/A |
Blackstone Real Estate Income Fund
Common Shares of Beneficial Interest |
100 | ||||||||
| 2014-01-14 |
|
4 | PBF |
PBF Energy Inc.
Series A Units of PBF Energy |
C - Conversion | -15.732 | 38.601 | -28,95 | ||||
| 2014-01-14 |
|
4 | PBF |
PBF Energy Inc.
Series A Units of PBF Energy |
C - Conversion | -130.028 | 319.042 | -28,95 | ||||
| 2014-01-14 |
|
4 | PBF |
PBF Energy Inc.
Series A Units of PBF Energy |
C - Conversion | -34.240 | 84.012 | -28,95 | ||||
| 2014-01-14 |
|
4 | PBF |
PBF Energy Inc.
Series A Units of PBF Energy |
C - Conversion | -1.112.325 | 2.729.250 | -28,95 | ||||
| 2014-01-14 |
|
4 | PBF |
PBF Energy Inc.
Series A Units of PBF Energy |
C - Conversion | -6.207.675 | 15.231.423 | -28,95 | ||||
| 2014-01-14 |
|
4 | PBF |
PBF Energy Inc.
Class A Common Stock |
S - Sale | -15.732 | 0 | -100,00 | 27,25 | -428.698 | ||
| 2014-01-14 |
|
4 | PBF |
PBF Energy Inc.
Class A Common Stock |
C - Conversion | 15.732 | 15.732 | |||||
| 2014-01-14 |
|
4 | PBF |
PBF Energy Inc.
Class A Common Stock |
S - Sale | -130.028 | 0 | -100,00 | 27,25 | -3.543.254 | ||
| 2014-01-14 |
|
4 | PBF |
PBF Energy Inc.
Class A Common Stock |
C - Conversion | 130.028 | 130.028 | |||||
| 2014-01-14 |
|
4 | PBF |
PBF Energy Inc.
Class A Common Stock |
S - Sale | -34.240 | 0 | -100,00 | 27,25 | -933.032 | ||
| 2014-01-14 |
|
4 | PBF |
PBF Energy Inc.
Class A Common Stock |
C - Conversion | 34.240 | 34.240 | |||||
| 2014-01-14 |
|
4 | PBF |
PBF Energy Inc.
Class A Common Stock |
S - Sale | -1.112.325 | 0 | -100,00 | 27,25 | -30.310.862 | ||
| 2014-01-14 |
|
4 | PBF |
PBF Energy Inc.
Class A Common Stock |
C - Conversion | 1.112.325 | 1.112.325 | |||||
| 2014-01-14 |
|
4 | PBF |
PBF Energy Inc.
Class A Common Stock |
S - Sale | -6.207.675 | 0 | -100,00 | 27,25 | -169.159.154 | ||
| 2014-01-14 |
|
4 | PBF |
PBF Energy Inc.
Class A Common Stock |
C - Conversion | 6.207.675 | 6.207.675 | |||||
| 2013-12-26 |
|
4 | PF |
Pinnacle Foods Inc.
Common Stock |
S - Sale | -1.688 | 39.677 | -4,08 | 25,75 | -43.461 | 1.021.560 | |
| 2013-12-26 |
|
4 | PF |
Pinnacle Foods Inc.
Common Stock |
S - Sale | -21.282 | 500.550 | -4,08 | 25,75 | -547.946 | 12.887.611 | |
| 2013-12-26 |
|
4 | PF |
Pinnacle Foods Inc.
Common Stock |
S - Sale | -12.926 | 303.980 | -4,08 | 25,75 | -332.804 | 7.826.543 | |
| 2013-12-26 |
|
4 | PF |
Pinnacle Foods Inc.
Common Stock |
S - Sale | -52.879 | 1.243.693 | -4,08 | 25,75 | -1.361.470 | 32.021.239 | |
| 2013-12-26 |
|
4 | PF |
Pinnacle Foods Inc.
Common Stock |
S - Sale | -416.514 | 9.796.097 | -4,08 | 25,75 | -10.723.944 | 252.219.130 | |
| 2013-12-26 |
|
4 | PF |
Pinnacle Foods Inc.
Common Stock |
S - Sale | -478.130 | 11.245.294 | -4,08 | 25,75 | -12.310.365 | 289.531.460 | |
| 2013-12-26 |
|
4 | PF |
Pinnacle Foods Inc.
Common Stock |
S - Sale | -3.445 | 81.061 | -4,08 | 25,75 | -88.698 | 2.087.069 | |
| 2013-12-26 |
|
4 | PF |
Pinnacle Foods Inc.
Common Stock |
S - Sale | -44.538 | 1.047.497 | -4,08 | 25,75 | -1.146.715 | 26.969.801 | |
| 2013-12-26 |
|
4 | PF |
Pinnacle Foods Inc.
Common Stock |
S - Sale | -9.195 | 216.290 | -4,08 | 25,75 | -236.743 | 5.568.797 | |
| 2013-12-26 |
|
4 | PF |
Pinnacle Foods Inc.
Common Stock |
S - Sale | -84.237 | 1.981.195 | -4,08 | 25,75 | -2.168.842 | 51.009.630 | |
| 2013-12-26 |
|
4 | PF |
Pinnacle Foods Inc.
Common Stock |
S - Sale | -1.425.166 | 33.518.811 | -4,08 | 25,75 | -36.693.606 | 863.005.475 | |
| 2013-12-23 | 3 | NONE |
FS Global Credit Opportunities Fund-A
Common Shares |
1.000.000 | ||||||||
| 2013-12-23 | 3 | XTEX |
CROSSTEX ENERGY LP
Common Units |
829.528 | ||||||||
| 2013-12-23 | 3 | XTEX |
CROSSTEX ENERGY LP
Common Units |
72.634 | ||||||||
| 2013-12-18 |
|
4 | HLT |
Hilton Worldwide Holdings Inc.
Common Stock |
S - Sale | -5.193.203 | 0 | -100,00 | 19,28 | -100.098.988 | ||
| 2013-12-17 |
|
4 | SEAS |
SeaWorld Entertainment, Inc.
Common Stock |
S - Sale | -18.366 | 480.511 | -3,68 | 28,88 | -530.318 | 13.874.755 | |
| 2013-12-17 |
|
4 | SEAS |
SeaWorld Entertainment, Inc.
Common Stock |
S - Sale | -55.096 | 1.441.534 | -3,68 | 28,88 | -1.590.897 | 41.624.294 | |
| 2013-12-17 |
|
4 | SEAS |
SeaWorld Entertainment, Inc.
Common Stock |
S - Sale | -50.311 | 1.316.333 | -3,68 | 28,88 | -1.452.730 | 38.009.115 | |
| 2013-12-17 |
|
4 | SEAS |
SeaWorld Entertainment, Inc.
Common Stock |
S - Sale | -33.033 | 864.274 | -3,68 | 28,88 | -953.828 | 24.955.912 | |
| 2013-12-17 |
|
4 | SEAS |
SeaWorld Entertainment, Inc.
Common Stock |
S - Sale | -42.267 | 1.105.873 | -3,68 | 28,88 | -1.220.460 | 31.932.083 | |
| 2013-12-17 |
|
4 | SEAS |
SeaWorld Entertainment, Inc.
Common Stock |
S - Sale | -13.487 | 352.879 | -3,68 | 28,88 | -389.437 | 10.189.381 | |
| 2013-12-17 |
|
4 | SEAS |
SeaWorld Entertainment, Inc.
Common Stock |
S - Sale | -37.542 | 982.244 | -3,68 | 28,88 | -1.084.025 | 28.362.296 | |
| 2013-12-17 |
|
4 | SEAS |
SeaWorld Entertainment, Inc.
Common Stock |
S - Sale | -41.149 | 1.076.614 | -3,68 | 28,88 | -1.188.177 | 31.087.229 | |
| 2013-12-17 |
|
4 | SEAS |
SeaWorld Entertainment, Inc.
Common Stock |
S - Sale | -36.587 | 957.268 | -3,68 | 28,88 | -1.056.450 | 27.641.114 | |
| 2013-12-17 |
|
4 | SEAS |
SeaWorld Entertainment, Inc.
Common Stock |
S - Sale | -1.172.162 | 30.668.178 | -3,68 | 28,88 | -33.846.178 | 885.543.640 | |
| 2013-12-17 |
|
4 | SEAS |
SeaWorld Entertainment, Inc.
Common Stock |
S - Sale | -220.386 | 498.877 | -30,64 | 28,88 | -6.363.646 | 14.405.073 | |
| 2013-12-17 |
|
4 | SEAS |
SeaWorld Entertainment, Inc.
Common Stock |
S - Sale | -661.158 | 1.496.630 | -30,64 | 28,88 | -19.090.937 | 43.215.191 | |
| 2013-12-17 |
|
4 | SEAS |
SeaWorld Entertainment, Inc.
Common Stock |
S - Sale | -603.734 | 1.366.644 | -30,64 | 28,88 | -17.432.819 | 39.461.846 | |
| 2013-12-17 |
|
4 | SEAS |
SeaWorld Entertainment, Inc.
Common Stock |
S - Sale | -396.398 | 897.307 | -30,64 | 28,88 | -11.445.992 | 25.909.740 | |
| 2013-12-17 |
|
4 | SEAS |
SeaWorld Entertainment, Inc.
Common Stock |
S - Sale | -507.207 | 1.148.140 | -30,64 | 28,88 | -14.645.602 | 33.152.542 | |
| 2013-12-17 |
|
4 | SEAS |
SeaWorld Entertainment, Inc.
Common Stock |
S - Sale | -161.847 | 366.366 | -30,64 | 28,88 | -4.673.332 | 10.578.818 | |
| 2013-12-17 |
|
4 | SEAS |
SeaWorld Entertainment, Inc.
Common Stock |
S - Sale | -450.505 | 1.019.786 | -30,64 | 28,88 | -13.008.332 | 29.446.321 | |
| 2013-12-17 |
|
4 | SEAS |
SeaWorld Entertainment, Inc.
Common Stock |
S - Sale | -493.788 | 1.117.763 | -30,64 | 28,88 | -14.258.128 | 32.275.407 | |
| 2013-12-17 |
|
4 | SEAS |
SeaWorld Entertainment, Inc.
Common Stock |
S - Sale | -439.049 | 993.855 | -30,64 | 28,88 | -12.677.540 | 28.697.563 | |
| 2013-12-17 |
|
4 | SEAS |
SeaWorld Entertainment, Inc.
Common Stock |
S - Sale | -14.065.928 | 31.840.340 | -30,64 | 28,88 | -406.153.671 | 919.389.818 | |
| 2013-12-17 |
|
4 | PF |
Pinnacle Foods Inc.
Common Stock |
S - Sale | -11.254 | 41.365 | -21,39 | 25,75 | -289.756 | 1.065.021 | |
| 2013-12-17 |
|
4 | PF |
Pinnacle Foods Inc.
Common Stock |
S - Sale | -141.882 | 521.832 | -21,38 | 25,75 | -3.653.022 | 13.435.556 | |
| 2013-12-17 |
|
4 | PF |
Pinnacle Foods Inc.
Common Stock |
S - Sale | -86.173 | 316.906 | -21,38 | 25,75 | -2.218.688 | 8.159.347 | |
| 2013-12-17 |
|
4 | PF |
Pinnacle Foods Inc.
Common Stock |
S - Sale | -352.529 | 1.296.572 | -21,38 | 25,75 | -9.076.529 | 33.382.710 | |
| 2013-12-17 |
|
4 | PF |
Pinnacle Foods Inc.
Common Stock |
S - Sale | -2.776.763 | 10.212.611 | -21,38 | 25,75 | -71.493.039 | 262.943.074 | |
| 2013-12-17 |
|
4 | PF |
Pinnacle Foods Inc.
Common Stock |
S - Sale | -3.187.534 | 11.723.424 | -21,38 | 25,75 | -82.069.119 | 301.841.825 | |
| 2013-12-17 |
|
4 | PF |
Pinnacle Foods Inc.
Common Stock |
S - Sale | -22.967 | 84.506 | -21,37 | 25,75 | -591.329 | 2.175.768 | |
| 2013-12-17 |
|
4 | PF |
Pinnacle Foods Inc.
Common Stock |
S - Sale | -296.922 | 1.092.035 | -21,38 | 25,75 | -7.644.821 | 28.116.516 | |
| 2013-12-17 |
|
4 | PF |
Pinnacle Foods Inc.
Common Stock |
S - Sale | -61.302 | 225.485 | -21,38 | 25,75 | -1.578.336 | 5.805.540 | |
| 2013-12-17 |
|
4 | PF |
Pinnacle Foods Inc.
Common Stock |
S - Sale | -561.578 | 2.065.432 | -21,38 | 25,75 | -14.458.893 | 53.178.471 | |
| 2013-12-17 |
|
4 | PF |
Pinnacle Foods Inc.
Common Stock |
S - Sale | -9.501.096 | 34.943.977 | -21,38 | 25,75 | -244.623.769 | 899.699.081 | |
| 2013-12-12 | 3 | HLT |
Hilton Worldwide Holdings Inc.
Common Stock |
729.584.173 | ||||||||
| 2013-12-12 | 3 | HLT |
Hilton Worldwide Holdings Inc.
Common Stock |
22.908.571 | ||||||||
| 2013-12-12 | 3 | HLT |
Hilton Worldwide Holdings Inc.
Common Stock |
5.193.203 | ||||||||
| 2013-11-29 |
|
4 | NLSN |
Nielsen Holdings N.V.
Common Stock |
S - Sale | -203.284 | 952.127 | -17,59 | 39,09 | -7.946.372 | 37.218.644 | |
| 2013-11-29 |
|
4 | NLSN |
Nielsen Holdings N.V.
Common Stock |
S - Sale | -45.867 | 214.829 | -17,59 | 39,09 | -1.792.941 | 8.397.666 | |
| 2013-11-29 |
|
4 | NLSN |
Nielsen Holdings N.V.
Common Stock |
S - Sale | -227.268 | 1.064.462 | -17,59 | 39,09 | -8.883.906 | 41.609.820 | |
| 2013-11-29 |
|
4 | NLSN |
Nielsen Holdings N.V.
Common Stock |
S - Sale | -2.653.535 | 12.428.430 | -17,59 | 39,09 | -103.726.683 | 485.827.329 | |
| 2013-11-29 |
|
4 | NLSN |
Nielsen Holdings N.V.
Common Stock |
S - Sale | -18.566 | 86.959 | -17,59 | 39,09 | -725.745 | 3.399.227 | |
| 2013-11-29 |
|
4 | NLSN |
Nielsen Holdings N.V.
Common Stock |
S - Sale | -90.187 | 422.413 | -17,59 | 39,09 | -3.525.410 | 16.512.124 | |
| 2013-11-29 |
|
4 | NLSN |
Nielsen Holdings N.V.
Common Stock |
S - Sale | -2.866.125 | 13.424.143 | -17,59 | 39,09 | -112.036.826 | 524.749.750 | |
| 2013-11-12 | 3 | NONE |
ESH Hospitality, Inc.
Paired Shares |
10.214.102 | ||||||||
| 2013-11-12 | 3 | NONE |
ESH Hospitality, Inc.
Paired Shares |
10.349.433 | ||||||||
| 2013-11-12 | 3 | NONE |
ESH Hospitality, Inc.
Paired Shares |
3.451.734 | ||||||||
| 2013-11-12 | 3 | NONE |
ESH Hospitality, Inc.
Paired Shares |
69.603 | ||||||||
| 2013-11-12 | 3 | NONE |
ESH Hospitality, Inc.
Paired Shares |
6.569.209 | ||||||||
| 2013-11-12 | 3 | NONE |
ESH Hospitality, Inc.
Paired Shares |
14.121.731 | ||||||||
| 2013-11-12 | 3 | NONE |
ESH Hospitality, Inc.
Paired Shares |
10.765.860 | ||||||||
| 2013-11-12 | 3 | NONE |
ESH Hospitality, Inc.
Paired Shares |
169.920 | ||||||||
| 2013-11-12 | 3 | STAY |
Extended Stay America, Inc.
Paired Shares |
10.214.102 | ||||||||
| 2013-11-12 | 3 | STAY |
Extended Stay America, Inc.
Paired Shares |
10.349.433 | ||||||||
| 2013-11-12 | 3 | STAY |
Extended Stay America, Inc.
Paired Shares |
3.451.734 | ||||||||
| 2013-11-12 | 3 | STAY |
Extended Stay America, Inc.
Paired Shares |
69.603 | ||||||||
| 2013-11-12 | 3 | STAY |
Extended Stay America, Inc.
Paired Shares |
6.569.209 | ||||||||
| 2013-11-12 | 3 | STAY |
Extended Stay America, Inc.
Paired Shares |
14.121.731 | ||||||||
| 2013-11-12 | 3 | STAY |
Extended Stay America, Inc.
Paired Shares |
10.765.860 | ||||||||
| 2013-11-12 | 3 | STAY |
Extended Stay America, Inc.
Paired Shares |
169.920 | ||||||||
| 2013-11-12 | 3 | STAY |
Extended Stay America, Inc.
Series A Preferred Stock of Extended Stay America, Inc. |
1.290 | ||||||||
| 2013-11-12 | 3 | STAY |
Extended Stay America, Inc.
Series A Preferred Stock of Extended Stay America, Inc. |
1.307 | ||||||||
| 2013-11-12 | 3 | STAY |
Extended Stay America, Inc.
Series A Preferred Stock of Extended Stay America, Inc. |
436 | ||||||||
| 2013-11-12 | 3 | STAY |
Extended Stay America, Inc.
Series A Preferred Stock of Extended Stay America, Inc. |
9 | ||||||||
| 2013-11-12 | 3 | STAY |
Extended Stay America, Inc.
Series A Preferred Stock of Extended Stay America, Inc. |
829 | ||||||||
| 2013-11-12 | 3 | STAY |
Extended Stay America, Inc.
Series A Preferred Stock of Extended Stay America, Inc. |
1.783 | ||||||||
| 2013-11-12 | 3 | STAY |
Extended Stay America, Inc.
Series A Preferred Stock of Extended Stay America, Inc. |
1.359 | ||||||||
| 2013-11-12 | 3 | STAY |
Extended Stay America, Inc.
Series A Preferred Stock of Extended Stay America, Inc. |
21 | ||||||||
| 2013-10-30 | 3 | BRX |
Brixmor Property Group Inc.
Common Stock |
161.494.622 | ||||||||
| 2013-10-03 |
|
4 | EK |
EASTMAN KODAK CO
125% Warrants |
J - Other | 12.838 | 12.838 | |||||
| 2013-10-03 |
|
4 | EK |
EASTMAN KODAK CO
135% Warrants |
J - Other | 12.838 | 12.838 | |||||
| 2013-10-03 |
|
4 | EK |
EASTMAN KODAK CO
125% Warrants |
J - Other | 10.231 | 10.231 | |||||
| 2013-10-03 |
|
4 | EK |
EASTMAN KODAK CO
135% Warrants |
J - Other | 10.231 | 10.231 | |||||
| 2013-10-03 |
|
4 | EK |
EASTMAN KODAK CO
125% Warrants |
J - Other | 30.951 | 30.951 | |||||
| 2013-10-03 |
|
4 | EK |
EASTMAN KODAK CO
135% Warrants |
J - Other | 30.951 | 30.951 | |||||
| 2013-10-03 |
|
4 | EK |
EASTMAN KODAK CO
125% Warrants |
J - Other | 33.238 | 33.238 | |||||
| 2013-10-03 |
|
4 | EK |
EASTMAN KODAK CO
135% Warrants |
J - Other | 33.238 | 33.238 | |||||
| 2013-10-03 |
|
4 | EK |
EASTMAN KODAK CO
Common Stock |
J - Other | 36.943 | 1.217.061 | 3,13 | ||||
| 2013-10-03 |
|
4 | EK |
EASTMAN KODAK CO
Common Stock |
J - Other | 29.442 | 978.738 | 3,10 | ||||
| 2013-10-03 |
|
4 | EK |
EASTMAN KODAK CO
Common Stock |
J - Other | 89.068 | 2.936.086 | 3,13 | ||||
| 2013-10-03 |
|
4 | EK |
EASTMAN KODAK CO
Common Stock |
J - Other | 95.651 | 3.120.740 | 3,16 | ||||
| 2013-10-03 |
|
4 | VHS |
VANGUARD HEALTH SYSTEMS INC
Common Stock |
D - Sale to Issuer | -1.487.725 | 0 | -100,00 | 21,00 | -31.242.225 | ||
| 2013-10-03 |
|
4 | VHS |
VANGUARD HEALTH SYSTEMS INC
Common Stock |
D - Sale to Issuer | -1.290.366 | 0 | -100,00 | 21,00 | -27.097.686 | ||
| 2013-10-03 |
|
4 | VHS |
VANGUARD HEALTH SYSTEMS INC
Common Stock |
D - Sale to Issuer | -782.538 | 0 | -100,00 | 21,00 | -16.433.298 | ||
| 2013-10-03 |
|
4 | VHS |
VANGUARD HEALTH SYSTEMS INC
Common Stock |
D - Sale to Issuer | -3.601.578 | 0 | -100,00 | 21,00 | -75.633.138 | ||
| 2013-10-03 |
|
4 | VHS |
VANGUARD HEALTH SYSTEMS INC
Common Stock |
D - Sale to Issuer | -1.248.232 | 0 | -100,00 | 21,00 | -26.212.872 | ||
| 2013-10-03 |
|
4 | VHS |
VANGUARD HEALTH SYSTEMS INC
Common Stock |
D - Sale to Issuer | -385.659 | 0 | -100,00 | 21,00 | -8.098.839 | ||
| 2013-10-03 |
|
4 | VHS |
VANGUARD HEALTH SYSTEMS INC
Common Stock |
D - Sale to Issuer | -20.585.466 | 0 | -100,00 | 21,00 | -432.294.786 | ||
| 2013-09-13 | 3 | EK |
EASTMAN KODAK CO
Common Stock |
3.025.089 | ||||||||
| 2013-09-13 | 3 | EK |
EASTMAN KODAK CO
Common Stock |
2.847.018 | ||||||||
| 2013-09-13 | 3 | EK |
EASTMAN KODAK CO
Common Stock |
949.296 | ||||||||
| 2013-09-13 | 3 | EK |
EASTMAN KODAK CO
Common Stock |
1.180.118 | ||||||||
| 2013-09-13 | 3 | EK |
EASTMAN KODAK CO
Common Stock |
48.006 | ||||||||
| 2013-09-13 | 3 | EK |
EASTMAN KODAK CO
Common Stock |
13.853 | ||||||||
| 2013-09-13 | 3 | EK |
EASTMAN KODAK CO
Common Stock |
1.846 | ||||||||
| 2013-07-03 |
|
4 | KCG |
KNIGHT CAPITAL GROUP, INC.
Restricted Stock Units |
D - Sale to Issuer | -35.461 | 0 | -100,00 | ||||
| 2013-07-03 |
|
4 | KCG |
KNIGHT CAPITAL GROUP, INC.
Class A Common Stock |
D - Sale to Issuer | -344.000 | 0 | -100,00 | ||||
| 2013-07-03 |
|
4 | KCG |
KNIGHT CAPITAL GROUP, INC.
Class A Common Stock |
D - Sale to Issuer | -28.666 | 0 | -100,00 | ||||
| 2013-07-03 |
|
4 | KCG |
KNIGHT CAPITAL GROUP, INC.
Class A Common Stock |
D - Sale to Issuer | -56.502.694 | 0 | -100,00 | ||||
| 2013-06-14 |
|
4 | PBF |
PBF Energy Inc.
Series A Units of PBF Energy |
C - Conversion | -16.728 | 54.333 | -23,54 | ||||
| 2013-06-14 |
|
4 | PBF |
PBF Energy Inc.
Series A Units of PBF Energy |
C - Conversion | -138.263 | 449.069 | -23,54 | ||||
| 2013-06-14 |
|
4 | PBF |
PBF Energy Inc.
Series A Units of PBF Energy |
C - Conversion | -36.408 | 118.252 | -23,54 | ||||
| 2013-06-14 |
|
4 | PBF |
PBF Energy Inc.
Series A Units of PBF Energy |
C - Conversion | -1.182.772 | 3.841.575 | -23,54 | ||||
| 2013-06-14 |
|
4 | PBF |
PBF Energy Inc.
Series A Units of PBF Energy |
C - Conversion | -6.600.828 | 21.439.098 | -23,54 | ||||
| 2013-06-14 |
|
4 | PBF |
PBF Energy Inc.
Class A Common Stock |
S - Sale | -16.728 | 0 | -100,00 | 26,19 | -438.116 | ||
| 2013-06-14 |
|
4 | PBF |
PBF Energy Inc.
Class A Common Stock |
C - Conversion | 16.728 | 16.728 | |||||
| 2013-06-14 |
|
4 | PBF |
PBF Energy Inc.
Class A Common Stock |
S - Sale | -138.263 | 0 | -100,00 | 26,19 | -3.621.102 | ||
| 2013-06-14 |
|
4 | PBF |
PBF Energy Inc.
Class A Common Stock |
C - Conversion | 138.263 | 138.263 | |||||
| 2013-06-14 |
|
4 | PBF |
PBF Energy Inc.
Class A Common Stock |
S - Sale | -36.408 | 0 | -100,00 | 26,19 | -953.532 | ||
| 2013-06-14 |
|
4 | PBF |
PBF Energy Inc.
Class A Common Stock |
C - Conversion | 36.408 | 36.408 | |||||
| 2013-06-14 |
|
4 | PBF |
PBF Energy Inc.
Class A Common Stock |
S - Sale | -1.182.772 | 0 | -100,00 | 26,19 | -30.976.811 | ||
| 2013-06-14 |
|
4 | PBF |
PBF Energy Inc.
Class A Common Stock |
C - Conversion | 1.182.772 | 1.182.772 | |||||
| 2013-06-14 |
|
4 | PBF |
PBF Energy Inc.
Class A Common Stock |
S - Sale | -6.600.828 | 0 | -100,00 | 26,19 | -172.875.689 | ||
| 2013-06-14 |
|
4 | PBF |
PBF Energy Inc.
Class A Common Stock |
C - Conversion | 6.600.828 | 6.600.828 | |||||
| 2013-05-30 |
|
4 | BXMT |
BLACKSTONE MORTGAGE TRUST, INC.
Class A Common Stock |
P - Purchase | 1.960.784 | 2.460.784 | 392,16 | 25,50 | 49.999.992 | 62.749.992 | |
| 2013-05-28 |
|
4 | KCG |
KNIGHT CAPITAL GROUP, INC.
Series A-1 Cumulative Perpetual Convertible Preferred Stock |
C - Conversion | -516 | 0 | -100,00 | ||||
| 2013-05-28 |
|
4 | KCG |
KNIGHT CAPITAL GROUP, INC.
Series A-1 Cumulative Perpetual Convertible Preferred Stock |
C - Conversion | -43 | 0 | -100,00 | ||||
| 2013-05-28 |
|
4 | KCG |
KNIGHT CAPITAL GROUP, INC.
Series A-1 Cumulative Perpetual Convertible Preferred Stock |
C - Conversion | -84.754 | 0 | -100,00 | ||||
| 2013-05-28 |
|
4 | KCG |
KNIGHT CAPITAL GROUP, INC.
Class A Common Stock |
C - Conversion | 344.000 | 344.000 | |||||
| 2013-05-28 |
|
4 | KCG |
KNIGHT CAPITAL GROUP, INC.
Class A Common Stock |
C - Conversion | 28.666 | 28.666 | |||||
| 2013-05-28 |
|
4 | KCG |
KNIGHT CAPITAL GROUP, INC.
Class A Common Stock |
C - Conversion | 56.502.694 | 56.502.694 | |||||
| 2013-05-21 |
|
4 | NLSN |
Nielsen Holdings N.V.
Common Stock |
S - Sale | -272.661 | 1.155.411 | -19,09 | 34,48 | -9.402.687 | 39.844.233 | |
| 2013-05-21 |
|
4 | NLSN |
Nielsen Holdings N.V.
Common Stock |
S - Sale | -61.521 | 260.696 | -19,09 | 34,48 | -2.121.546 | 8.990.075 | |
| 2013-05-21 |
|
4 | NLSN |
Nielsen Holdings N.V.
Common Stock |
S - Sale | -304.831 | 1.291.730 | -19,09 | 34,48 | -10.512.067 | 44.545.180 | |
| 2013-05-21 |
|
4 | NLSN |
Nielsen Holdings N.V.
Common Stock |
S - Sale | -3.559.141 | 15.081.965 | -19,09 | 34,48 | -122.736.621 | 520.100.055 | |
| 2013-05-21 |
|
4 | NLSN |
Nielsen Holdings N.V.
Common Stock |
S - Sale | -24.902 | 105.525 | -19,09 | 34,48 | -858.743 | 3.639.019 | |
| 2013-05-21 |
|
4 | NLSN |
Nielsen Holdings N.V.
Common Stock |
S - Sale | -120.966 | 512.600 | -19,09 | 34,48 | -4.171.500 | 17.676.960 | |
| 2013-05-21 |
|
4 | NLSN |
Nielsen Holdings N.V.
Common Stock |
S - Sale | -3.844.284 | 16.290.268 | -19,09 | 34,48 | -132.569.749 | 561.768.263 | |
| 2013-05-01 | 3 | EARN |
Ellington Residential Mortgage REIT
Common Shares |
2.555.599 | ||||||||
| 2013-04-25 |
|
4 | SEAS |
SeaWorld Entertainment, Inc.
Common Stock |
S - Sale | -243.649 | 719.263 | -25,30 | 25,38 | -6.183.812 | 18.254.895 | |
| 2013-04-25 |
|
4 | SEAS |
SeaWorld Entertainment, Inc.
Common Stock |
S - Sale | -730.946 | 2.157.788 | -25,30 | 25,38 | -18.551.409 | 54.764.659 | |
| 2013-04-25 |
|
4 | SEAS |
SeaWorld Entertainment, Inc.
Common Stock |
S - Sale | -667.462 | 1.970.378 | -25,30 | 25,38 | -16.940.186 | 50.008.194 | |
| 2013-04-25 |
|
4 | SEAS |
SeaWorld Entertainment, Inc.
Common Stock |
S - Sale | -438.240 | 1.293.705 | -25,30 | 25,38 | -11.122.531 | 32.834.233 | |
| 2013-04-25 |
|
4 | SEAS |
SeaWorld Entertainment, Inc.
Common Stock |
S - Sale | -560.746 | 1.655.347 | -25,30 | 25,38 | -14.231.733 | 42.012.707 | |
| 2013-04-25 |
|
4 | SEAS |
SeaWorld Entertainment, Inc.
Common Stock |
S - Sale | -178.931 | 528.213 | -25,30 | 25,38 | -4.541.269 | 13.406.046 | |
| 2013-04-25 |
|
4 | SEAS |
SeaWorld Entertainment, Inc.
Common Stock |
S - Sale | -498.058 | 1.470.291 | -25,30 | 25,38 | -12.640.712 | 37.315.986 | |
| 2013-04-25 |
|
4 | SEAS |
SeaWorld Entertainment, Inc.
Common Stock |
S - Sale | -545.910 | 1.611.551 | -25,30 | 25,38 | -13.855.196 | 40.901.164 | |
| 2013-04-25 |
|
4 | SEAS |
SeaWorld Entertainment, Inc.
Common Stock |
S - Sale | -485.394 | 1.432.904 | -25,30 | 25,38 | -12.319.300 | 36.367.104 | |
| 2013-04-25 |
|
4 | SEAS |
SeaWorld Entertainment, Inc.
Common Stock |
S - Sale | -15.550.664 | 45.906.268 | -25,30 | 25,38 | -394.675.852 | 1.165.101.082 | |
| 2013-03-27 | 3 | PF |
Pinnacle Foods Inc.
Common Stock |
44.445.073 | ||||||||
| 2013-03-27 | 3 | PF |
Pinnacle Foods Inc.
Common Stock |
2.627.010 | ||||||||
| 2013-03-27 | 3 | PF |
Pinnacle Foods Inc.
Common Stock |
286.787 | ||||||||
| 2013-03-27 | 3 | PF |
Pinnacle Foods Inc.
Common Stock |
1.388.957 | ||||||||
| 2013-03-27 | 3 | PF |
Pinnacle Foods Inc.
Common Stock |
107.473 | ||||||||
| 2013-03-27 | 3 | PF |
Pinnacle Foods Inc.
Common Stock |
14.910.958 | ||||||||
| 2013-03-27 | 3 | PF |
Pinnacle Foods Inc.
Common Stock |
12.989.374 | ||||||||
| 2013-03-27 | 3 | PF |
Pinnacle Foods Inc.
Common Stock |
1.649.101 | ||||||||
| 2013-03-27 | 3 | PF |
Pinnacle Foods Inc.
Common Stock |
403.079 | ||||||||
| 2013-03-27 | 3 | PF |
Pinnacle Foods Inc.
Common Stock |
663.719 | ||||||||
| 2013-03-27 | 3 | PF |
Pinnacle Foods Inc.
Common Stock |
52.619 | ||||||||
| 2013-03-19 |
|
4 | KOS |
Kosmos Energy Ltd.
Common Shares |
S - Sale | -5.221 | 312.256 | -1,64 | 10,59 | -55.277 | 3.306.010 | |
| 2013-03-19 |
|
4 | KOS |
Kosmos Energy Ltd.
Common Shares |
S - Sale | -38.450 | 2.299.722 | -1,64 | 10,59 | -407.089 | 24.348.307 | |
| 2013-03-19 |
|
4 | KOS |
Kosmos Energy Ltd.
Common Shares |
S - Sale | -46.308 | 2.769.766 | -1,64 | 10,59 | -490.286 | 29.324.898 | |
| 2013-03-19 |
|
4 | KOS |
Kosmos Energy Ltd.
Common Shares |
S - Sale | -28.631 | 1.712.440 | -1,64 | 10,59 | -303.131 | 18.130.458 | |
| 2013-03-19 |
|
4 | KOS |
Kosmos Energy Ltd.
Common Shares |
S - Sale | -1.755.619 | 105.005.826 | -1,64 | 10,59 | -18.587.616 | 1.111.749.183 | |
| 2013-02-25 |
|
4 | NLSN |
Nielsen Holdings N.V.
Common Stock |
S - Sale | -276.488 | 1.428.072 | -16,22 | 31,57 | -8.729.694 | 45.089.231 | |
| 2013-02-25 |
|
4 | NLSN |
Nielsen Holdings N.V.
Common Stock |
S - Sale | -62.384 | 322.217 | -16,22 | 31,57 | -1.969.681 | 10.173.518 | |
| 2013-02-25 |
|
4 | NLSN |
Nielsen Holdings N.V.
Common Stock |
S - Sale | -309.109 | 1.596.561 | -16,22 | 31,57 | -9.759.653 | 50.409.019 | |
| 2013-02-25 |
|
4 | NLSN |
Nielsen Holdings N.V.
Common Stock |
S - Sale | -3.609.091 | 18.641.106 | -16,22 | 31,57 | -113.951.635 | 588.564.960 | |
| 2013-02-25 |
|
4 | NLSN |
Nielsen Holdings N.V.
Common Stock |
S - Sale | -25.252 | 130.427 | -16,22 | 31,57 | -797.294 | 4.118.037 | |
| 2013-02-25 |
|
4 | NLSN |
Nielsen Holdings N.V.
Common Stock |
S - Sale | -122.664 | 633.566 | -16,22 | 31,57 | -3.872.932 | 20.003.896 | |
| 2013-02-25 |
|
4 | NLSN |
Nielsen Holdings N.V.
Common Stock |
S - Sale | -3.898.236 | 20.134.552 | -16,22 | 31,57 | -123.080.954 | 635.718.278 | |
| 2013-02-25 |
|
4 | KOS |
Kosmos Energy Ltd.
Common Shares |
S - Sale | -34.362 | 317.477 | -9,77 | 10,59 | -363.808 | 3.361.288 | |
| 2013-02-25 |
|
4 | KOS |
Kosmos Energy Ltd.
Common Shares |
S - Sale | -253.071 | 2.338.172 | -9,77 | 10,59 | -2.679.389 | 24.755.396 | |
| 2013-02-25 |
|
4 | KOS |
Kosmos Energy Ltd.
Common Shares |
S - Sale | -304.796 | 2.816.074 | -9,77 | 10,59 | -3.227.028 | 29.815.183 | |
| 2013-02-25 |
|
4 | KOS |
Kosmos Energy Ltd.
Common Shares |
S - Sale | -188.444 | 1.741.071 | -9,77 | 10,59 | -1.995.151 | 18.433.589 | |
| 2013-02-25 |
|
4 | KOS |
Kosmos Energy Ltd.
Common Shares |
S - Sale | -11.555.266 | 106.761.445 | -9,77 | 10,59 | -122.341.379 | 1.130.336.799 | |
| 2013-02-22 |
|
4 | TRW |
TRW AUTOMOTIVE HOLDINGS CORP
Common Stock, par value $0.01 per share |
S - Sale | -9.215.354 | 10.273.062 | -47,29 | 59,10 | -544.627.421 | 607.137.964 | |
| 2013-02-20 |
|
4 | TMH |
TEAM HEALTH HOLDINGS INC.
Common Stock |
S - Sale | -9.588.990 | 0 | -100,00 | 33,21 | -318.450.358 | ||
| 2012-12-28 |
|
4 | TMH |
TEAM HEALTH HOLDINGS INC.
Common Stock |
S - Sale | -792.572 | 9.588.990 | -7,63 | 28,85 | -22.865.702 | 276.642.362 | |
| 2012-12-28 |
|
4 | TMH |
TEAM HEALTH HOLDINGS INC.
Common Stock |
S - Sale | -8.000.000 | 10.381.562 | -43,52 | 28,85 | -230.800.000 | 299.508.064 | |
| 2012-12-21 | 3 | CT |
CAPITAL TRUST INC
Class A Common Stock |
5.000.000 | ||||||||
| 2012-12-20 |
|
4 | PBF |
PBF Energy Inc.
Series A Units of PBF Energy Company LLC |
S - Sale | -3.217 | 71.061 | -4,33 | 26,00 | -83.652 | 1.847.591 | |
| 2012-12-20 |
|
4 | PBF |
PBF Energy Inc.
Series A Units of PBF Energy Company LLC |
S - Sale | -26.592 | 587.332 | -4,33 | 26,00 | -691.400 | 15.270.632 | |
| 2012-12-20 |
|
4 | PBF |
PBF Energy Inc.
Series A Units of PBF Energy Company LLC |
S - Sale | -7.002 | 154.660 | -4,33 | 26,00 | -182.065 | 4.021.160 | |
| 2012-12-20 |
|
4 | PBF |
PBF Energy Inc.
Series A Units of PBF Energy Company LLC |
S - Sale | -227.484 | 5.024.347 | -4,33 | 26,00 | -5.914.592 | 130.633.030 | |
| 2012-12-20 |
|
4 | PBF |
PBF Energy Inc.
Series A Units of PBF Energy Company LLC |
S - Sale | -1.269.547 | 28.039.926 | -4,33 | 26,00 | -33.008.212 | 729.038.079 | |
| 2012-12-13 | 3 | PBF |
PBF Energy Inc.
Class B Common Stock |
1 | ||||||||
| 2012-12-13 | 3 | PBF |
PBF Energy Inc.
Class B Common Stock |
1 | ||||||||
| 2012-12-13 | 3 | PBF |
PBF Energy Inc.
Class B Common Stock |
1 | ||||||||
| 2012-12-13 | 3 | PBF |
PBF Energy Inc.
Class B Common Stock |
1 | ||||||||
| 2012-12-13 | 3 | PBF |
PBF Energy Inc.
Class B Common Stock |
1 | ||||||||
| 2012-10-26 | 3 | XTXI |
CROSSTEX ENERGY INC
Common Stock |
5.121.480 | ||||||||
| 2012-10-26 | 3 | XTXI |
CROSSTEX ENERGY INC
Common Stock |
1.878.520 | ||||||||
| 2012-09-25 | 3 | BGB |
Blackstone / GSO Strategic Credit Fund
Common Shares |
5.236 | ||||||||
| 2012-09-19 |
|
4 | TMH |
TEAM HEALTH HOLDINGS INC.
Common Stock |
S - Sale | -8.000.000 | 18.381.562 | -30,32 | 27,92 | -223.360.000 | 513.213.211 | |
| 2012-09-18 |
|
4 | KCG |
KNIGHT CAPITAL GROUP, INC.
Series A-1 Cumulative Perpetual Convertible Preferred Stock |
C - Conversion | 414 | 516 | 405,88 | ||||
| 2012-09-18 |
|
4 | KCG |
KNIGHT CAPITAL GROUP, INC.
Series A-1 Cumulative Perpetual Convertible Preferred Stock |
C - Conversion | 35 | 43 | 437,50 | ||||
| 2012-09-18 |
|
4 | KCG |
KNIGHT CAPITAL GROUP, INC.
Series A-1 Cumulative Perpetual Convertible Preferred Stock |
C - Conversion | 67.888 | 84.754 | 402,51 | ||||
| 2012-09-18 |
|
4 | KCG |
KNIGHT CAPITAL GROUP, INC.
Series A-2 Cumulative Perpetual Convertible Preferred Stock |
C - Conversion | -414 | 0 | -100,00 | ||||
| 2012-09-18 |
|
4 | KCG |
KNIGHT CAPITAL GROUP, INC.
Series A-2 Cumulative Perpetual Convertible Preferred Stock |
C - Conversion | -35 | 0 | -100,00 | ||||
| 2012-09-18 |
|
4 | KCG |
KNIGHT CAPITAL GROUP, INC.
Series A-2 Cumulative Perpetual Convertible Preferred Stock |
C - Conversion | -67.888 | 0 | -100,00 | ||||
| 2012-09-18 |
|
4 | KCG |
KNIGHT CAPITAL GROUP, INC.
Restricted Stock Units |
A - Award | 35.461 | 35.461 | |||||
| 2012-08-21 |
|
4 | KCG |
KNIGHT CAPITAL GROUP, INC.
Series A-1 Cumulative Perpetual Convertible Preferred Stock |
S - Sale | -3 | 102 | -2,86 | 1.500,00 | -4.500 | 153.000 | |
| 2012-08-21 |
|
4 | KCG |
KNIGHT CAPITAL GROUP, INC.
Series A-1 Cumulative Perpetual Convertible Preferred Stock |
S - Sale | -432 | 16.866 | -2,50 | 1.500,00 | -648.000 | 25.299.000 | |
| 2012-08-21 |
|
4 | KCG |
KNIGHT CAPITAL GROUP, INC.
Series A-2 Non-Voting Cumulative Perpetual Conv Pref Stock |
S - Sale | -10 | 414 | -2,36 | 1.500,00 | -15.000 | 621.000 | |
| 2012-08-21 |
|
4 | KCG |
KNIGHT CAPITAL GROUP, INC.
Series A-2 Non-Voting Cumulative Perpetual Conv Pref Stock |
S - Sale | -1 | 35 | -2,78 | 1.500,00 | -1.500 | 52.500 | |
| 2012-08-21 |
|
4 | KCG |
KNIGHT CAPITAL GROUP, INC.
Series A-2 Non-Voting Cumulative Perpetual Conv Pref Stock |
S - Sale | -1.741 | 67.888 | -2,50 | 1.500,00 | -2.611.500 | 101.832.000 | |
| 2012-08-16 | 3 | KCG |
KNIGHT CAPITAL GROUP, INC.
Series A-2 Non-Voting Cumulative Perpetual Conv Pref Stock |
69.629 | ||||||||
| 2012-08-16 | 3 | KCG |
KNIGHT CAPITAL GROUP, INC.
Series A-2 Non-Voting Cumulative Perpetual Conv Pref Stock |
36 | ||||||||
| 2012-08-16 | 3 | KCG |
KNIGHT CAPITAL GROUP, INC.
Series A-2 Non-Voting Cumulative Perpetual Conv Pref Stock |
424 | ||||||||
| 2012-07-09 |
|
4 | TMH |
TEAM HEALTH HOLDINGS INC.
Common Stock |
S - Sale | -9.125.000 | 26.381.562 | -25,70 | 23,00 | -209.875.000 | 606.775.926 | |
| 2012-05-29 |
|
4 | SARA |
SARATOGA RESOURCES INC /TX
Common Stock |
P - Purchase | 800.000 | 4.800.000 | 20,00 | 6,25 | 5.000.000 | 30.000.000 | |
| 2012-03-30 | 3/A | VHS |
VANGUARD HEALTH SYSTEMS INC
Common Stock |
20.585.466 | ||||||||
| 2012-03-30 | 3/A | VHS |
VANGUARD HEALTH SYSTEMS INC
Common Stock |
385.659 | ||||||||
| 2012-03-30 | 3/A | VHS |
VANGUARD HEALTH SYSTEMS INC
Common Stock |
1.248.232 | ||||||||
| 2012-03-30 | 3/A | VHS |
VANGUARD HEALTH SYSTEMS INC
Common Stock |
3.601.578 | ||||||||
| 2012-03-30 | 3/A | VHS |
VANGUARD HEALTH SYSTEMS INC
Common Stock |
782.538 | ||||||||
| 2012-03-30 | 3/A | VHS |
VANGUARD HEALTH SYSTEMS INC
Common Stock |
1.290.366 | ||||||||
| 2012-03-30 | 3/A | VHS |
VANGUARD HEALTH SYSTEMS INC
Common Stock |
1.487.725 | ||||||||
| 2012-03-29 | 3/A | FSL |
Freescale Semiconductor Holdings I, Ltd.
Common Stock |
196.136.895 | ||||||||
| 2012-03-28 |
|
4 | NLSN |
Nielsen Holdings N.V.
Common Stock |
S - Sale | -130.053 | 1.704.560 | -7,09 | 29,12 | -3.786.571 | 49.629.287 | |
| 2012-03-28 |
|
4 | NLSN |
Nielsen Holdings N.V.
Common Stock |
S - Sale | -29.344 | 384.601 | -7,09 | 29,12 | -854.368 | 11.197.889 | |
| 2012-03-28 |
|
4 | NLSN |
Nielsen Holdings N.V.
Common Stock |
S - Sale | -145.398 | 1.905.669 | -7,09 | 29,12 | -4.233.350 | 55.484.696 | |
| 2012-03-28 |
|
4 | NLSN |
Nielsen Holdings N.V.
Common Stock |
S - Sale | -1.697.630 | 22.250.197 | -7,09 | 29,12 | -49.427.516 | 647.827.836 | |
| 2012-03-28 |
|
4 | NLSN |
Nielsen Holdings N.V.
Common Stock |
S - Sale | -11.878 | 155.679 | -7,09 | 29,12 | -345.835 | 4.532.687 | |
| 2012-03-28 |
|
4 | NLSN |
Nielsen Holdings N.V.
Common Stock |
S - Sale | -57.698 | 756.230 | -7,09 | 29,12 | -1.679.912 | 22.018.090 | |
| 2012-03-28 |
|
4 | NLSN |
Nielsen Holdings N.V.
Common Stock |
S - Sale | -1.833.636 | 24.032.788 | -7,09 | 29,12 | -53.387.412 | 699.729.042 | |
| 2012-03-28 | 3/A | NLSN |
Nielsen Holdings N.V.
Common Stock |
25.866.424 | ||||||||
| 2012-03-28 | 3/A | NLSN |
Nielsen Holdings N.V.
Common Stock |
813.928 | ||||||||
| 2012-03-28 | 3/A | NLSN |
Nielsen Holdings N.V.
Common Stock |
167.557 | ||||||||
| 2012-03-28 | 3/A | NLSN |
Nielsen Holdings N.V.
Common Stock |
23.947.827 | ||||||||
| 2012-03-28 | 3/A | NLSN |
Nielsen Holdings N.V.
Common Stock |
2.051.067 | ||||||||
| 2012-03-28 | 3/A | NLSN |
Nielsen Holdings N.V.
Common Stock |
413.945 | ||||||||
| 2012-03-28 | 3/A | NLSN |
Nielsen Holdings N.V.
Common Stock |
1.834.613 | ||||||||
| 2012-02-29 |
|
4 | BKU |
BankUnited, Inc.
Series A Nonvoting Convertible Preferred Stock |
J - Other | 4.180 | 4.180 | |||||
| 2012-02-29 |
|
4 | BKU |
BankUnited, Inc.
Series A Nonvoting Convertible Preferred Stock |
J - Other | 7.193 | 7.193 | |||||
| 2012-02-29 |
|
4 | BKU |
BankUnited, Inc.
Series A Nonvoting Convertible Preferred Stock |
J - Other | 1.287.389 | 1.287.389 | |||||
| 2012-02-29 |
|
4 | BKU |
BankUnited, Inc.
Series A Nonvoting Convertible Preferred Stock |
J - Other | 4.117.032 | 4.117.032 | |||||
| 2012-02-29 |
|
4 | BKU |
BankUnited, Inc.
Common Stock |
J - Other | -4.180 | 6.410 | -39,47 | ||||
| 2012-02-29 |
|
4 | BKU |
BankUnited, Inc.
Common Stock |
J - Other | -7.193 | 11.031 | -39,47 | ||||
| 2012-02-29 |
|
4 | BKU |
BankUnited, Inc.
Common Stock |
J - Other | -1.287.389 | 1.974.262 | -39,47 | ||||
| 2012-02-29 |
|
4 | BKU |
BankUnited, Inc.
Common Stock |
J - Other | -4.117.032 | 6.313.634 | -39,47 | ||||
| 2011-07-21 | 3 | SROE |
SARATOGA RESOURCES INC /TX
Common Stock |
2.982.321 | ||||||||
| 2011-07-21 | 3 | SROE |
SARATOGA RESOURCES INC /TX
Common Stock |
1.017.679 | ||||||||
| 2011-07-20 |
|
4 | LNG |
CHENIERE ENERGY INC
Common Stock |
S - Sale | -14.366 | 96.879 | -12,91 | 9,63 | -138.345 | 932.945 | |
| 2011-07-20 |
|
4 | LNG |
CHENIERE ENERGY INC
Common Stock |
S - Sale | -548.519 | 3.646.449 | -13,08 | 9,63 | -5.282.238 | 35.115.304 | |
| 2011-07-20 |
|
4 | LNG |
CHENIERE ENERGY INC
Common Stock |
S - Sale | -296.281 | 1.969.622 | -13,08 | 9,63 | -2.853.186 | 18.967.460 | |
| 2011-07-20 |
|
4 | LNG |
CHENIERE ENERGY INC
Common Stock |
S - Sale | -338.434 | 2.249.840 | -13,08 | 9,63 | -3.259.119 | 21.665.959 | |
| 2011-07-20 |
|
4 | LNG |
CHENIERE ENERGY INC
Common Stock |
S - Sale | -5.427 | 111.245 | -4,65 | 9,67 | -52.479 | 1.075.739 | |
| 2011-07-20 |
|
4 | LNG |
CHENIERE ENERGY INC
Common Stock |
S - Sale | -207.206 | 4.194.968 | -4,71 | 9,67 | -2.003.682 | 40.565.341 | |
| 2011-07-20 |
|
4 | LNG |
CHENIERE ENERGY INC
Common Stock |
S - Sale | -111.922 | 2.265.903 | -4,71 | 9,67 | -1.082.286 | 21.911.282 | |
| 2011-07-20 |
|
4 | LNG |
CHENIERE ENERGY INC
Common Stock |
S - Sale | -127.845 | 2.588.274 | -4,71 | 9,67 | -1.236.261 | 25.028.610 | |
| 2011-04-06 |
|
4 | TMH |
TEAM HEALTH HOLDINGS INC.
Common Stock |
S - Sale | -830.000 | 35.506.562 | -2,28 | 16,33 | -13.554.315 | 579.839.911 | |
| 2011-03-04 |
|
4 | TMH |
TEAM HEALTH HOLDINGS INC.
Common Stock |
S - Sale | -7.950.000 | 36.336.562 | -17,95 | 16,33 | -129.827.475 | 593.394.226 | |
| 2010-12-23 | 3 | LNG |
CHENIERE ENERGY INC
Common Stock |
134.889 | ||||||||
| 2010-12-23 | 3 | LNG |
CHENIERE ENERGY INC
Common Stock |
2.716.119 | ||||||||
| 2010-12-23 | 3 | LNG |
CHENIERE ENERGY INC
Common Stock |
2.377.825 | ||||||||
| 2010-12-23 | 3 | LNG |
CHENIERE ENERGY INC
Common Stock |
4.402.174 | ||||||||
| 2010-12-23 | 3 | LNG |
CHENIERE ENERGY INC
Common Stock |
116.672 | ||||||||
| 2010-11-17 |
|
4 | TRW |
TRW AUTOMOTIVE HOLDINGS CORP
Common Stock, par value $0.01 per share |
S - Sale | -9.040.313 | 19.488.416 | -31,69 | 48,26 | -436.285.505 | 940.510.956 | |
| 2010-09-13 |
|
4 | TRW |
TRW AUTOMOTIVE HOLDINGS CORP
Common Stock, par value $0.01 per share |
S - Sale | -7.493.201 | 28.528.729 | -20,80 | 35,30 | -264.509.995 | 1.007.064.134 | |
| 2009-12-16 | 3 | TMH |
TEAM HEALTH HOLDINGS INC.
Common Stock |
44.286.562 | ||||||||
| 2009-11-12 |
|
4 | STAN |
STANDARD PARKING CORP
Common Stock |
S - Sale | -1.214.655 | 182.199 | -86,96 | 15,14 | -18.389.877 | 2.758.493 | |
| 2009-11-12 |
|
4 | STAN |
STANDARD PARKING CORP
Common Stock |
S - Sale | -160.615 | 0 | -100,00 | 15,14 | -2.431.711 | ||
| 2009-11-12 |
|
4 | STAN |
STANDARD PARKING CORP
Common Stock |
S - Sale | -1.463.627 | 243.636 | -85,73 | 15,14 | -22.159.313 | 3.688.649 | |
| 2009-11-12 |
|
4 | STAN |
STANDARD PARKING CORP
Common Stock |
S - Sale | -2.178.617 | 326.792 | -86,96 | 15,14 | -32.984.261 | 4.947.631 | |
| 2009-05-26 | 3 | STAN |
STANDARD PARKING CORP
Common Stock |
2.505.409 | ||||||||
| 2009-05-26 | 3 | STAN |
STANDARD PARKING CORP
Common Stock |
1.707.263 | ||||||||
| 2009-05-26 | 3 | STAN |
STANDARD PARKING CORP
Common Stock |
160.615 | ||||||||
| 2009-05-26 | 3 | STAN |
STANDARD PARKING CORP
Common Stock |
1.396.854 | ||||||||
| 2007-06-28 | 3 | TRW |
TRW AUTOMOTIVE HOLDINGS CORP
Common stock, par value $0.01 per share |
46.060.285 |
P
Türev olmayan veya türev menkul kıymetlerin açık piyasa veya özel alımı
S
Türev olmayan veya türev menkul kıymetlerin açık piyasa veya özel satımı
A
Şirketten menkul kıymetlerin verilmesi, ödüllendirilmesi veya başka şekilde edinilmesi (opsiyon gibi)
C
Türevin dönüşümü
D
Menkul kıymetlerin şirkete geri satışı veya devri
F
Kullanım bedelinin veya vergi yükümlülüğünün şirketten alınan menkul kıymetlerin bir kısmı kullanılarak ödenmesi
G
Menkul kıymetlerin içeriden birine veya kişiye hediye edilmesi
K
Özkaynak swapları ve benzeri riskten korunma işlemleri
M
Şirketten alınan türev menkul kıymetin kullanılması veya dönüştürülmesi (opsiyon gibi)
V
Form 4te gönüllü olarak bildirilen bir işlem
J
Diğer (işlemi açıklayan bir dipnotla birlikte)