| İçeriden Öğrenenlerin Hisseleri | 15.165.003 shares |
İçeriden Öğrenenlerin Eğilim Skoru
İçeriden Öğrenenlerin Eğilim Skoru, kurumsal içeriden öğrenenler tarafından satın alınan şirketleri bulur.
En yüksek düzeyde içeriden öğrenen birikimine sahip şirketleri tanımlayan karmaşık, çok faktörlü kantitatif bir modelin sonucudur. Skorlama modeli, önceki 90 günde satın alan içeriden öğrenenlerin net sayısının, float yüzde olarak satın alınan toplam hisselerin ve içeriden öğrenenlerin sahip olduğu toplam hisselerin bir kombinasyonunu kullanıyor. Sayı 0 ila 100 arasında değişir; daha yüksek sayılar, emsallerine göre daha yüksek bir birikim düzeyine işaret eder ve 50 ortalamadır.
Güncelleme Sıklığı: Günlük
Şirket Yetkilisi Eğilim Skoru
Şirket Yetkilisi Eğilim Skoru, Kurumsal Şirket Yetkilileri tarafından satın alınan şirketleri bulur.
Tanım gereği Kurumsal Yetkililer, Kurumsal İçeriden Öğrenenlerdir, ancak diğer İçeriden Öğrenenlerin (% 10 Hissedarlar ve Yönetim Kurulu Üyeleri) aksine, Şirket Yetkilileri günlük olarak şirket için çalışırlar ve alım satım yaparken kendi paralarını kullanırlar . (%10 Hissedarlar ve Yönetim Kurulu Üyeleri genellikle başkalarının parasını yöneten fon yöneticileridir.) Bu sebeple, Şirket Yetkilileri tarafından yapılan içeriden öğrenenlerin ticareti çok daha önemlidir ve uygun şekilde ele alınmalıdır.
İçeriden Öğrenenlerin Eğilim Skoru gibi, Şirket Yetkilileri Eğilim Skoru en yüksek düzeyde şirket yetkilisi birikimine sahip şirketleri belirleyen gelişmiş, çok faktörlü kantitatif bir modelin sonucudur.
Güncelleme Sıklığı: Günlük
Anahtar İçeriden Öğrenen Metrikleri
Bu kart, şirketin çeşitli içeriden öğrenilen ölçümlere kıyasla nasıl sıralandığını gösterir. Yüzdelik sıralama, bu şirketin ABD pazarındaki diğer şirketlerle nasıl karşılaştırıldığını gösterir. Daha yüksek sıralamalar daha iyi durumların göstergesidir.
Örneğin, içeriden öğrenen alımlarının olumlu bir gösterge olduğu genel olarak kabul edilir, bu sebeple içeriden öğrenenlerin alımının daha yüksek olduğu şirketler, içeriden satın alan (hatta içeriden öğrenenlerin satışı) daha az olan şirketlere göre daha üst sıralarda yer alır.
Alım Yapan İçeriden Öğrenen Net Sayısı (Sıra)
N/A
Alım Yapan İçeriden Öğrenen Net Sayısı, alım yapan içeriden öğrenenlerin toplam sayısından son 90 gün içinde satış yapan içeriden öğrenenlerin toplam sayısı çıkarılarak elde edilir. Yüzdelik sıralama burada gösterilir (%0 ile %100 arası).
İçeriden Öğrenenler Tarafından Satın Alınan Float Yüzdesi (Sıra)
N/A
İçerden Öğrenenler Tarafından Satın Alınan Float Yüzdesi, içeriden öğrenenler tarafından satın alınan toplam hisse sayısından, son 90 gün içinde içeriden öğrenenler tarafından satılan toplam hisse sayısı çıkarılarak elde edilen toplam floata bölünür ve 100 ile çarpılır.
İçeriden Öğrenenlerin Ticareti Tablosu
Nuverra Environmental Solutions Inc içeriden öğrenenlerin ticareti aşağıdaki grafikte gösterilmektedir. İçeriden öğrenenler bir şirketteki yetkililer, yöneticiler veya önemli yatırımcılardır. Genel olarak, içeriden öğrenenlerin maddi, kamuya açıklanmamış bilgilere dayanarak şirketlerinde alım satım yapması genellikle yasa dışıdır. Bu onların kendi şirketlerinde herhangi bir işlem yapmalarının yasa dışı olduğu anlamına gelmez. Ancak tüm işlemleri Form 4 aracılığıyla SECye bildirilmesi gerekir.
İçeriden Öğrenenlerin Listesi ve Kârlılık Metrikleri
Bu tablo bilindik içeriden öğrenenlerin listesini gösterir ve SECye bildirilen dosyalardan otomatik olarak oluşturulur. İsimlere ek olarak, en son unvana ve yönetici, yetkili veya %10luk sahiplik tanımına ek olarak, açıklanan en son varlıkları da sağlıyoruz. Ek olarak, mümkün olduğunda içeriden öğrenen için geçmiş ticari performansı da sağlıyoruz. Geçmiş ticari performans, içeriden öğrenenlerin yaptığı gerçek açık piyasa satın alma işlemlerinin performansının ağırlıklı ortalamasıdır. Bunun nasıl hesaplandığı hakkında daha fazla bilgi için bu YouTube web seminerini izleyiniz.
See our leaderboard of most profitable insider traders.
| İçeriden Öğrenen | Ort Kâr (%) | Sahibi Olan Hisseler |
Bölünmüş Düzeltilmiş |
|---|
Report errors via our new Insider Auditing Tool
İçeriden Öğrenenlerin Alımlarının Takip Kayıtları - Kısa Vadeli Kâr Analizi
Bu bölümde, NES / Nuverra Environmental Solutions Inc yılında yapılmış her planlanmamış, açık piyasada içeriden öğrenlenlerin satın almalarının kârlılığını analiz ediyoruz. Bu analiz, içeriden öğrenen kişinin sürekli olarak anormal getiriler sağlayıp sağlamadığını ve takip edilmeye değer olup olmadığını anlamaya yardımcı olur. Bu analiz her işlemin ardından bir yıl süreyle geçerlidir ve sonuçlar teoriktir .
Aşağıdaki tablo, otomatik ticaret planının parçası olmayan en son açık piyasa alımlarını göstermektedir.
Düzeltilmiş Fiyat bölünmüş olarak düzeltilmiş fiyattır. Düzeltilmiş Hisseler bölünmüş olarak düzeltilmiş hisselerdir.
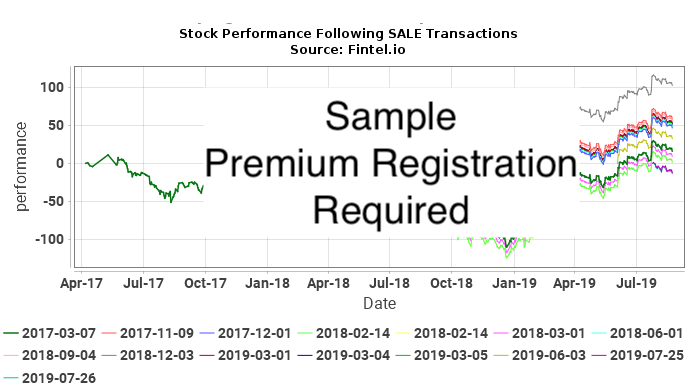
İçeriden Öğrenen Satışlarının Takip Kayıtları - Kısa Vadeli Zarar Analizi
Bu bölümde, NES / Nuverra Environmental Solutions Inc yılında yapılan her planlanmamış, açık piyasa içeriden öğrenilen satışın kısa vadeli zarardan kaçınma miktarını analiz ediyoruz. Tutarlı bir kayıptan kaçınma modeli, gelecekteki satış işlemlerinin fiyattaki düşüşleri öngörebileceğini düşündürebilir. Bu analiz her işlemin ardından bir yıl süreyle geçerlidir ve sonuçlar teoriktir .
Aşağıdaki tablo, otomatik ticaret planının parçası olmayan en son açık piyasa satışlarını göstermektedir.
Düzeltilmiş Fiyat bölünmüş olarak düzeltilmiş fiyattır. Düzeltilmiş Hisseler bölünmüş olarak düzeltilmiş hisselerdir.
İşlem Geçmişi
Tam işlem geçmişini görmek için bağlantı simgesine tıklayın. 10b5-1 otomatik işlem planı kapsamında bildirilen işlemlerin 10b-5 ile işaretli sütununda X işareti bulunacaktır.
| Dosya Tarih |
Ticaret Tarihi |
Form | İçeriden Öğrenenler | Ticker | Menkul Kıymet Başlığı | Kod | Doğrudan | İşleme Koyma Fiyatı |
Birim Fiyatı |
Birimler Değiştirildi |
Değer Değiştirildi (1K) |
Geriye Kalan Opsiyonlar |
Geriye Kalan Hisseler |
|
|---|---|---|---|---|---|---|---|---|---|---|---|---|---|---|
| 2022-02-25 | 2022-02-23 | 4 | Gates Capital Management, L.P. | NES | Common Stock, par value $0.01 per share ("Common Stock") | I | -6.626.660 | 0 | ||||||
| 2022-02-23 | 2022-02-23 | 4 | MCGOVERN MICHAEL Y | NES | Common Stock | D | -70.816 | 0 | ||||||
| 2022-02-23 | 2022-02-23 | 4 | Crabb Joseph M | NES | Restricted Stock Units | D | -42.194 | 0 | ||||||
| 2022-02-23 | 2022-02-23 | 4 | Crabb Joseph M | NES | Common Stock | D | -101.194 | 0 | ||||||
| 2022-02-23 | 2022-02-23 | 4 | Crabb Joseph M | NES | Common Stock | D | 42.194 | 101.194 | ||||||
| 2022-02-23 | 2022-02-23 | 4 | Thompson Charles K. | NES | Common Stock | D | -265.122 | 0 | ||||||
| 2022-02-23 | 2022-02-23 | 4 | Nightingale David | NES | Common Stock | D | -17.220 | 0 | ||||||
| 2022-02-23 | 2022-02-23 | 4 | Bauer Eric T | NES | Restricted Stock Units | D | -42.194 | 0 | ||||||
| 2022-02-23 | 2022-02-23 | 4 | Bauer Eric T | NES | Common Stock | D | -42.194 | 0 | ||||||
| 2022-02-23 | 2022-02-23 | 4 | Bauer Eric T | NES | Common Stock | D | 42.194 | 42.194 | ||||||
| 2021-07-19 | 2021-07-16 | 4 | Thompson Charles K. | NES | Common Stock | D | 2,2200 | -47.621 | -106 | 265.122 | ||||
| 2021-07-19 | 2021-07-16 | 4 | Thompson Charles K. | NES | Common Stock | D | 151.899 | 312.743 | ||||||
| 2021-04-22 | 2021-04-21 | 4 | Nightingale David | NES | Common Stock | D | 17.220 | 17.220 | ||||||
| 2021-04-22 | 2021-04-21 | 4 | MCGOVERN MICHAEL Y | NES | Common Stock | D | 22.959 | 70.816 | ||||||
| 2021-04-13 | 2021-04-09 | 4 | Crabb Joseph M | NES | Common Stock | D | 1.253 | 59.000 | ||||||
| 2021-03-12 | 2021-03-10 | 4 | Crabb Joseph M | NES | Restricted Stock Units | D | -20.674 | 0 | ||||||
| 2021-03-12 | 2021-03-10 | 4 | Crabb Joseph M | NES | Common Stock | D | 2,2500 | -7.185 | -16 | 57.747 | ||||
| 2021-03-12 | 2021-03-10 | 4 | Crabb Joseph M | NES | Common Stock | D | 20.674 | 64.932 | ||||||
| 2021-02-19 | 2021-02-17 | 4 | Gates Capital Management, L.P. | NES | Common Stock | D | 3,2100 | -31.375 | -101 | 6.626.660 | ||||
| 2021-02-16 | 2021-02-16 | 4 | Gates Capital Management, L.P. | NES | Common Stock | D | 3,2400 | -12.960 | -42 | 6.658.035 | ||||
| 2021-02-16 | 2021-02-11 | 4 | Gates Capital Management, L.P. | NES | Common Stock | D | 3,0800 | -50.111 | -154 | 6.670.995 | ||||
| 2021-02-09 | 2021-01-14 | 4 | Thompson Charles K. | NES | Restricted Stock Units | D | -210.000 | 0 | ||||||
| 2021-02-09 | 2021-01-14 | 4 | Thompson Charles K. | NES | Common Stock | D | 2,6800 | -67.795 | -182 | 160.844 | ||||
| 2021-02-09 | 2021-01-14 | 4 | Thompson Charles K. | NES | Common Stock | D | 210.000 | 228.639 | ||||||
| 2021-02-09 | 2021-01-14 | 4 | Fox Robert Young | NES | Restricted Stock Units | D | -19.879 | 0 | ||||||
| 2021-02-09 | 2021-01-14 | 4 | Fox Robert Young | NES | Common Stock | D | 2,6800 | -5.895 | -16 | 62.032 | ||||
| 2021-02-09 | 2021-01-14 | 4 | Fox Robert Young | NES | Common Stock | D | 19.879 | 67.927 | ||||||
| 2021-02-09 | 2021-01-14 | 4 | Crabb Joseph M | NES | Restricted Stock Units | D | -20.674 | 0 | ||||||
| 2021-02-09 | 2021-01-14 | 4 | Crabb Joseph M | NES | Common Stock | D | 2,6800 | -7.185 | -19 | 44.258 | ||||
| 2021-02-09 | 2021-01-14 | 4 | Crabb Joseph M | NES | Common Stock | D | 20.674 | 51.443 | ||||||
| 2020-12-23 | 2020-12-21 | 4 | Gates Capital Management, L.P. | NES | Common Stock | D | 4,0300 | -185.811 | -749 | 6.721.106 | ||||
| 2020-12-23 | 2020-12-21 | 4 | Gates Capital Management, L.P. | NES | Common Stock | D | 4,6600 | -150.000 | -699 | 6.906.917 | ||||
| 2020-12-18 | 2020-12-16 | 4 | Crabb Joseph M | NES | Restricted Stock Units | D | 42.194 | 42.194 | ||||||
| 2020-12-18 | 2020-12-16 | 4 | Thompson Charles K. | NES | Restricted Stock Units | D | 86.076 | 86.076 | ||||||
| 2020-12-18 | 2020-12-16 | 4 | Fox Robert Young | NES | Restricted Stock Units | D | 84.388 | 84.388 | ||||||
| 2020-12-18 | 2020-12-16 | 4 | Bauer Eric T | NES | Restricted Stock Units | D | 42.194 | 42.194 | ||||||
| 2020-04-22 | 2020-04-21 | 4 | Griggs John | NES | Common Stock | D | 37.500 | 47.857 | ||||||
| 2020-04-22 | 2020-04-21 | 4 | MCGOVERN MICHAEL Y | NES | Common Stock | D | 37.500 | 47.857 | ||||||
| 2020-01-22 | 2020-01-21 | 4 | Fox Robert Young | NES | Restricted Stock Units | D | -19.879 | 19.879 | ||||||
| 2020-01-22 | 2020-01-21 | 4 | Fox Robert Young | NES | Common Stock | D | 2,9200 | -6.908 | -20 | 48.048 | ||||
| 2020-01-22 | 2020-01-21 | 4 | Fox Robert Young | NES | Common Stock | D | 19.879 | 54.956 | ||||||
| 2020-01-22 | 2020-01-21 | 4 | Crabb Joseph M | NES | Restricted Stock Units | D | -20.674 | 20.674 | ||||||
| 2020-01-22 | 2020-01-21 | 4 | Crabb Joseph M | NES | Common Stock | D | 2,9200 | -7.185 | -21 | 30.769 | ||||
| 2020-01-22 | 2020-01-21 | 4 | Crabb Joseph M | NES | Common Stock | D | 20.674 | 37.954 | ||||||
| 2019-08-27 | 2019-08-23 | 4 | Fox Robert Young | NES | Restricted Stock Units | D | -29.818 | 29.819 | ||||||
| 2019-08-27 | 2019-08-23 | 4 | Fox Robert Young | NES | Common Stock | D | 3,8800 | -8.782 | -34 | 35.077 | ||||
| 2019-08-27 | 2019-08-23 | 4 | Fox Robert Young | NES | Common Stock | D | 29.818 | 43.859 | ||||||
| 2019-04-09 | 2019-03-05 | 4/A | Fox Robert Young | NES | Common Stock | D | 10,9000 | -5.838 | -64 | 14.041 | ||||
| 2019-04-09 | 2019-04-05 | 4 | Griggs John | NES | Common Stock | D | 5.669 | 10.357 | ||||||
| 2019-04-09 | 2019-03-18 | 4 | Griggs John | NES | Common Stock | D | 4.688 | 4.688 | ||||||
| 2019-04-09 | 2019-04-05 | 4 | Thompson Charles K. | NES | Restricted Stock Units | D | -11.338 | 210.000 | ||||||
| 2019-04-09 | 2019-04-05 | 4 | Thompson Charles K. | NES | Restricted Stock Units | D | 11.338 | 221.338 | ||||||
| 2019-04-09 | 2019-04-05 | 4 | Thompson Charles K. | NES | Common Stock | D | 8,8200 | -3.276 | -29 | 18.639 | ||||
| 2019-04-09 | 2019-04-05 | 4 | Thompson Charles K. | NES | Common Stock | D | 11.338 | 21.915 | ||||||
| 2019-04-09 | 2019-03-18 | 4 | Thompson Charles K. | NES | Common Stock | D | 4.688 | 10.577 | ||||||
| 2019-04-09 | 2019-04-05 | 4 | MCGOVERN MICHAEL Y | NES | Common Stock | D | 5.669 | 10.357 | ||||||
| 2019-04-09 | 2019-03-18 | 4 | MCGOVERN MICHAEL Y | NES | Common Stock | D | 4.688 | 4.688 | ||||||
| 2019-03-07 | 2019-03-05 | 4 | Fox Robert Young | NES | Restricted Stock Units | D | -19.879 | 39.758 | ||||||
| 2019-03-07 | 2019-03-05 | 4 | Fox Robert Young | NES | Restricted Stock Units | D | 59.637 | 59.637 | ||||||
| 2019-03-07 | 2019-03-05 | 4 | Fox Robert Young | NES | Restricted Stock Units | D | 59.637 | 59.637 | ||||||
| 2019-03-07 | 2019-03-05 | 4 | Fox Robert Young | NES | Common Stock | D | 10,9000 | -6.048 | -66 | 13.831 | ||||
| 2019-03-07 | 2019-03-05 | 4 | Fox Robert Young | NES | Common Stock | D | 19.879 | 19.879 | ||||||
| 2019-03-07 | 2019-03-05 | 4 | Crabb Joseph M | NES | Restricted Stock Units | D | -4.135 | 41.348 | ||||||
| 2019-03-07 | 2019-03-05 | 4 | Crabb Joseph M | NES | Common Stock | D | 10,9000 | -7.529 | -82 | 17.280 | ||||
| 2019-03-07 | 2018-12-31 | 4 | Crabb Joseph M | NES | Restricted Stock Units | D | -20.674 | 41.348 | ||||||
| 2019-03-07 | 2018-12-31 | 4 | Crabb Joseph M | NES | Common Stock | D | 24.809 | 24.809 | ||||||
| 2019-01-08 | 2019-01-04 | 4 | Gates Capital Management, L.P. | NES | Common Stock | D | 10,0000 | 1.599 | 16 | 7.056.917 | ||||
| 2019-01-08 | 2019-01-04 | 4 | Gates Capital Management, L.P. | NES | Common Stock | D | 9,7064 | 9.948 | 97 | 7.055.318 | ||||
| 2019-01-03 | 2018-12-31 | 4 | Thompson Charles K. | NES | Restricted Stock Units | D | 210.000 | 210.000 | ||||||
| 2019-01-02 | 2019-01-02 | 4 | Gates Capital Management, L.P. | NES | Common Stock | D | 9,2541 | 9.683 | 90 | 7.045.370 | ||||
| 2019-01-02 | 2018-12-28 | 4 | Gates Capital Management, L.P. | NES | Subscription Rights (right to buy) | D | 9,61 | -1.500.396 | 0 | |||||
| 2019-01-02 | 2018-12-28 | 4 | Gates Capital Management, L.P. | NES | Common Stock | D | 9,6100 | 108.013 | 1.038 | 7.035.687 | ||||
| 2019-01-02 | 2018-12-28 | 4 | Gates Capital Management, L.P. | NES | Common Stock | D | 9,6100 | 1.500.396 | 14.419 | 6.927.674 | ||||
| 2019-01-02 | 2018-12-28 | 4 | Ascribe Management LLC | NONE | Subscription Rights (Right to buy) | D | 9,61 | -1.495.607 | 0 | |||||
| 2019-01-02 | 2018-12-28 | 4 | Ascribe Management LLC | NONE | Common Stock | D | 9,6100 | 116.313 | 1.118 | 7.021.879 | ||||
| 2019-01-02 | 2018-12-28 | 4 | Ascribe Management LLC | NONE | Common Stock | D | 9,6100 | 1.495.607 | 14.373 | 6.905.566 | ||||
| 2019-01-02 | 2018-12-28 | 4 | Ascribe Capital LLC | NONE | Subscription Rights (Right to buy) | D | 9,61 | -1.495.607 | 0 | |||||
| 2019-01-02 | 2018-12-28 | 4 | Ascribe Capital LLC | NONE | Common Stock | D | 9,6100 | 116.313 | 1.118 | 7.021.879 | ||||
| 2019-01-02 | 2018-12-28 | 4 | Ascribe Capital LLC | NONE | Common Stock | D | 9,6100 | 1.495.607 | 14.373 | 6.905.566 | ||||
| 2018-11-08 | 2018-11-08 | 4 | Lang Edward A. | NES | Common Stock | D | 10,3500 | 1.613 | 17 | 3.000 | ||||
| 2018-11-08 | 2018-11-07 | 4 | Lang Edward A. | NES | Common Stock | D | 10,2300 | 387 | 4 | 1.387 | ||||
| 2018-11-01 | 2018-11-01 | 4 | Gates Capital Management, L.P. | NES | Common Stock | D | 11,2800 | 5.951 | 67 | 5.427.278 | ||||
| 2018-11-01 | 2018-10-31 | 4 | Gates Capital Management, L.P. | NES | Common Stock | D | 11,2200 | 7.793 | 87 | 5.421.327 | ||||
| 2018-11-01 | 2018-10-30 | 4 | Gates Capital Management, L.P. | NES | Common Stock | D | 11,2800 | 12.455 | 140 | 5.413.534 | ||||
| 2018-10-12 | 2018-10-11 | 4 | Gates Capital Management, L.P. | NES | Common Stock | D | 9,9000 | 139.032 | 1.376 | 5.401.079 | ||||
| 2018-10-12 | 2018-10-11 | 4 | Gates Capital Management, L.P. | NES | Common Stock | D | 10,8200 | 200 | 2 | 5.262.047 | ||||
| 2018-10-12 | 2018-10-11 | 4 | Gates Capital Management, L.P. | NES | Common Stock | D | 11,1800 | 100 | 1 | 5.261.847 | ||||
| 2018-10-12 | 2018-10-11 | 4 | Gates Capital Management, L.P. | NES | Common Stock | D | 11,0000 | 3.044 | 33 | 5.261.747 | ||||
| 2018-10-12 | 2018-10-10 | 4 | Gates Capital Management, L.P. | NES | Common Stock | D | 9,9000 | 227.000 | 2.247 | 5.258.703 | ||||
| 2018-10-12 | 2018-10-10 | 4 | Gates Capital Management, L.P. | NES | Common Stock | D | 10,2900 | 4.626 | 48 | 5.031.703 | ||||
| 2018-10-12 | 2018-10-10 | 4 | Gates Capital Management, L.P. | NES | Common Stock | D | 10,4000 | 3.798 | 39 | 5.027.077 | ||||
| 2018-05-31 | 2018-05-29 | 4 | Thompson Charles K. | NES | Common Stock | D | 5.889 | 5.889 | ||||||
| 2018-05-03 | 3 | First Lawrence A. | NES | Common Stock | D | 0 | ||||||||
| 2018-04-06 | 2018-04-05 | 4 | Gates Capital Management, L.P. | NES | Common Stock | D | 21,7100 | -366 | -8 | 5.023.279 | ||||
| 2018-04-06 | 2018-04-04 | 4 | Gates Capital Management, L.P. | NES | Common Stock | D | 21,5000 | -570 | -12 | 5.023.645 | ||||
| 2018-03-20 | 2018-03-16 | 4 | Griggs John | NES | Restricted Stock | D | 4.688 | 4.688 | ||||||
| 2018-03-20 | 2018-03-16 | 4 | Thompson Charles K. | NES | Restricted Stock | D | 4.688 | 4.688 | ||||||
| 2018-03-20 | 2018-03-16 | 4 | MCGOVERN MICHAEL Y | NES | Restricted Stock | D | 4.688 | 4.688 | ||||||
| 2018-03-19 | 2018-03-15 | 4 | Gates Capital Management, L.P. | NES | Common Stock | D | 21,4300 | -654 | -14 | 5.024.215 | ||||
| 2018-03-15 | 2018-03-14 | 4 | Gates Capital Management, L.P. | NES | Common Stock | D | 20,3000 | -300 | -6 | 5.024.869 | ||||
| 2018-03-15 | 2018-03-14 | 4 | Gates Capital Management, L.P. | NES | Common Stock | D | 19,9400 | -561 | -11 | 5.025.169 | ||||
| 2018-03-15 | 2018-03-14 | 4 | Gates Capital Management, L.P. | NES | Common Stock | D | 20,4900 | -700 | -14 | 5.025.730 | ||||
| 2018-03-15 | 2018-03-14 | 4 | Gates Capital Management, L.P. | NES | Common Stock | D | 19,9600 | -2.148 | -43 | 5.026.430 | ||||
| 2018-03-15 | 2018-03-14 | 4 | Gates Capital Management, L.P. | NES | Common Stock | D | 22,1300 | -9.000 | -199 | 5.028.578 | ||||
| 2018-03-15 | 2018-03-13 | 4 | Gates Capital Management, L.P. | NES | Common Stock | D | 25,7700 | -1.677 | -43 | 5.037.578 | ||||
| 2018-03-15 | 2018-03-14 | 4 | Lang Edward A. | NES | Common Stock | D | 19,9000 | 1.000 | 20 | 1.000 | ||||
| 2018-03-13 | 2018-02-23 | 4/A | JOHNSRUD MARK D | NES | Employee Stock Option (right to buy) | D | 41,31 | 354.411 | 354.411 | |||||
| 2018-03-13 | 2018-02-23 | 4/A | JOHNSRUD MARK D | NES | Employee Stock Option (right to buy) | D | 37,03 | 354.411 | 354.411 | |||||
| 2018-03-13 | 2018-02-23 | 4/A | JOHNSRUD MARK D | NES | Restricted Stock Units | D | 531.618 | 531.618 | ||||||
| 2018-03-13 | 2018-02-23 | 4/A | JOHNSRUD MARK D | NES | Restricted Stock Units | D | 531.618 | 531.618 | ||||||
| 2018-03-13 | 2018-03-02 | 4/A | JOHNSRUD MARK D | NES | Restricted Stock Units | D | -443.015 | 88.603 | ||||||
| 2018-03-13 | 2018-03-12 | 4 | Gates Capital Management, L.P. | NES | Common Stock | D | 25,9700 | -2.602 | -68 | 5.039.255 | ||||
| 2018-03-13 | 2018-03-12 | 4 | Gates Capital Management, L.P. | NES | Common Stock | D | 25,9300 | -6.237 | -162 | 5.041.857 | ||||
| 2018-03-13 | 2018-03-12 | 4 | Gates Capital Management, L.P. | NES | Common Stock | D | 26,1100 | -8.313 | -217 | 5.048.094 | ||||
| 2018-03-13 | 2018-03-09 | 4 | Gates Capital Management, L.P. | NES | Common Stock | D | 22,4000 | -330 | -7 | 5.056.407 | ||||
| 2018-03-13 | 2018-03-09 | 4 | Gates Capital Management, L.P. | NES | Common Stock | D | 21,7500 | -45.500 | -990 | 5.056.737 | ||||
| 2018-03-09 | 2018-03-08 | 4 | Gates Capital Management, L.P. | NES | Common Stock | D | 22,3400 | -2.045 | -46 | 5.102.237 | ||||
| 2018-03-09 | 2018-03-07 | 4 | Gates Capital Management, L.P. | NES | Common Stock | D | 22,0000 | -700 | -15 | 5.104.282 | ||||
| 2018-03-06 | 2018-03-02 | 4 | JOHNSRUD MARK D | NES | Restricted Stock Units | D | -354.412 | 0 | ||||||
| 2018-03-06 | 2018-03-02 | 4 | JOHNSRUD MARK D | NES | Common Stock | D | 354.412 | 531.618 | ||||||
| 2018-02-27 | 2018-02-23 | 4 | Crabb Joseph M | NES | Restricted Stock Units | D | 62.022 | 62.022 | ||||||
| 2018-02-27 | 2018-02-23 | 4 | Crabb Joseph M | NES | Restricted Stock Units | D | 62.022 | 62.022 | ||||||
| 2018-02-27 | 2018-02-23 | 4 | Lang Edward A. | NES | Restricted Stock Units | D | 62.022 | 62.022 | ||||||
| 2018-02-27 | 2018-02-23 | 4 | Lang Edward A. | NES | Restricted Stock Units | D | 62.022 | 62.022 | ||||||
| 2018-02-27 | 2018-02-23 | 4 | JOHNSRUD MARK D | NES | Employee Stock Option (right to buy) | D | 37,03 | 354.411 | 354.411 | |||||
| 2018-02-27 | 2018-02-23 | 4 | JOHNSRUD MARK D | NES | Employee Stock Option (right to buy) | D | 41,31 | 354.411 | 354.411 | |||||
| 2018-02-27 | 2018-02-23 | 4 | JOHNSRUD MARK D | NES | Restricted Stock Units | D | 531.618 | 531.618 | ||||||
| 2018-02-27 | 2018-02-23 | 4 | JOHNSRUD MARK D | NES | Restricted Stock Units | D | 531.618 | 531.618 | ||||||
| 2018-02-27 | 2018-02-23 | 4 | JOHNSRUD MARK D | NES | Restricted Stock Units | D | -177.206 | 354.412 | ||||||
| 2018-02-27 | 2018-02-23 | 4 | JOHNSRUD MARK D | NES | Common Stock | D | 177.206 | 177.206 | ||||||
| 2017-12-29 | 2017-12-28 | 4 | Gates Capital Management, L.P. | NES | Common Stock | D | 21,6200 | -2.405 | -52 | 5.104.982 | ||||
| 2017-12-29 | 2017-12-27 | 4 | Gates Capital Management, L.P. | NES | Common Stock | D | 23,4800 | -1.712 | -40 | 5.107.387 | ||||
| 2017-12-29 | 2017-12-27 | 4 | Gates Capital Management, L.P. | NES | Common Stock | D | 22,2300 | -2.609 | -58 | 5.109.099 | ||||
| 2017-12-29 | 2017-12-27 | 4 | Gates Capital Management, L.P. | NES | Common Stock | D | 24,6000 | -3.668 | -90 | 5.111.708 | ||||
| 2017-08-15 | 3/A | Ascribe Associates III, LLC | NONE | Common Stock | D | 5.409.958 | ||||||||
| 2017-08-15 | 3/A | Ascribe Associates II, LLC | NONE | Common Stock | D | 5.409.958 | ||||||||
| 2017-08-15 | 3/A | Gates Jeffrey L | NONE | Common Stock | D | 5.115.376 | ||||||||
| 2017-08-09 | 2017-08-07 | 4 | HOLMES TOD C | NONE | Common Stock | D | -70.946 | 0 | ||||||
| 2017-08-09 | 2017-08-07 | 4 | Nelson Ralph Daniel | NONE | Common Stock | D | -76.729 | 0 | ||||||
| 2017-08-09 | 2017-08-07 | 4 | JOHNSRUD MARK D By Badlands Development II, LLC | NONE | Common Stock | I | -98.234.375 | 0 | ||||||
| 2017-08-09 | 2017-08-07 | 4 | JOHNSRUD MARK D By JPJ LP | NONE | Common Stock | I | -655.000 | 0 | ||||||
| 2017-08-09 | 2017-08-07 | 4 | JOHNSRUD MARK D 401(k) | NONE | Common Stock | I | -1.305 | 0 | ||||||
| 2017-08-09 | 2017-08-07 | 4 | JOHNSRUD MARK D | NONE | Common Stock | D | -29.947.234 | 0 | ||||||
| 2017-08-09 | 2017-08-07 | 4 | AUSTIN WILLIAM M | NONE | Common Stock | D | -61.579 | 0 | ||||||
| 2017-08-09 | 2017-08-07 | 4 | Simonds Robert | NONE | Common Stock | I | -875 | 0 | ||||||
| 2017-08-09 | 2017-08-07 | 4 | Simonds Robert | NONE | Common Stock | D | -88.789 | 0 | ||||||
| 2017-08-09 | 2017-08-07 | 4 | OSBORNE ALFRED E JR | NONE | Common Stock | I | -9.000 | 0 | ||||||
| 2017-08-09 | 2017-08-07 | 4 | OSBORNE ALFRED E JR | NONE | Common Stock | D | -30.000 | 0 | ||||||
| 2017-08-09 | 2017-08-07 | 4 | QUAYLE DAN | NONE | Common Stock | I | -11.936 | 0 | ||||||
| 2017-08-09 | 2017-08-07 | 4 | QUAYLE DAN | NONE | Common Stock | I | -2.500 | 0 | ||||||
| 2017-08-09 | 2017-08-07 | 4 | QUAYLE DAN | NONE | Common Stock | D | -78.689 | 0 | ||||||
| 2017-08-09 | 2017-08-07 | 4 | Barkett Edward A | NONE | Common Stock | I | -10.000 | 0 | ||||||
| 2017-08-09 | 2017-08-07 | 4 | Barkett Edward A | NONE | Common Stock | D | -79.504 | 0 | ||||||
| 2017-08-09 | 2017-08-07 | 4 | Crabb Joseph M 401(k) | NONE | Common Stock | I | -1.565 | 0 | ||||||
| 2017-08-09 | 2017-08-07 | 4 | Crabb Joseph M | NONE | Common Stock | D | -25.681 | 0 | ||||||
| 2017-08-09 | 2017-08-07 | 4 | Hilgendorf Stacy W. 401(k) | NONE | Common Stock | I | -300 | 0 | ||||||
| 2017-08-08 | 3 | Ascribe Capital LLC | NONE | Common Stock | D | 10.819.918 | ||||||||
| 2017-08-08 | 3 | Ascribe Capital LLC | NONE | Common Stock | D | 10.819.918 | ||||||||
| 2017-08-08 | 3 | Ascribe Capital LLC | NONE | Common Stock | D | 10.819.918 | ||||||||
| 2017-08-08 | 3 | Ascribe Capital LLC | NONE | Common Stock | D | 10.819.918 | ||||||||
| 2017-08-08 | 3 | Ascribe Capital LLC | NONE | Common Stock | D | 10.819.918 | ||||||||
| 2017-08-08 | 3 | Ascribe Capital LLC | NONE | Common Stock | D | 10.819.918 | ||||||||
| 2017-08-08 | 3 | Ascribe Capital LLC | NONE | Common Stock | D | 10.819.918 | ||||||||
| 2017-08-08 | 3 | Ascribe Management LLC | NONE | Common Stock | D | 10.819.918 | ||||||||
| 2017-08-08 | 3 | Ascribe Management LLC | NONE | Common Stock | D | 10.819.918 | ||||||||
| 2017-08-08 | 3 | Ascribe Management LLC | NONE | Common Stock | D | 10.819.918 | ||||||||
| 2017-08-08 | 3 | Ascribe Management LLC | NONE | Common Stock | D | 10.819.918 | ||||||||
| 2017-08-08 | 3 | Ascribe Management LLC | NONE | Common Stock | D | 10.819.918 | ||||||||
| 2017-08-08 | 3 | Ascribe Management LLC | NONE | Common Stock | D | 10.819.918 | ||||||||
| 2017-08-08 | 3 | Gates Capital Management, L.P. | NONE | Common Stock | D | 10.230.756 | ||||||||
| 2017-08-08 | 3 | Gates Capital Management, L.P. | NONE | Common Stock | D | 10.230.756 | ||||||||
| 2017-08-08 | 3 | Gates Capital Management, L.P. | NONE | Common Stock | D | 10.230.756 | ||||||||
| 2017-08-08 | 3 | Gates Capital Management, L.P. | NONE | Common Stock | D | 10.230.756 | ||||||||
| 2017-08-08 | 3 | Gates Capital Management, L.P. | NONE | Common Stock | D | 10.230.756 | ||||||||
| 2017-05-15 | 2017-05-11 | 4 | OSBORNE ALFRED E JR | NESCQ | Common Stock | I | 0,0140 | -59.175 | -1 | 0 | ||||
| 2017-05-15 | 2017-05-11 | 4 | OSBORNE ALFRED E JR | NESCQ | Common Stock | D | 0,0140 | -5.000 | -0 | 30.000 | ||||
| 2016-08-02 | 2016-07-29 | 4 | JOHNSRUD MARK D | OTCQB:NESC | Common Stock | D | 0,3200 | 781.250 | 250 | 29.947.234 | ||||
| 2016-08-02 | 2016-07-29 | 4 | JOHNSRUD MARK D | OTCQB:NESC | Common Stock | D | 0,2560 | 19.531.250 | 5.000 | 29.165.984 | ||||
| 2016-06-16 | 2016-06-14 | 4 | JOHNSRUD MARK D | OTCQB:NESC | Common Stock | D | 0,2787 | 100.000 | 28 | 9.634.734 | ||||
| 2016-05-27 | 2016-05-26 | 4 | JOHNSRUD MARK D By Badlands Development II, LLC | OTCQB:NESC | Common Stock | I | 98.234.375 | 98.234.375 | ||||||
| 2016-05-09 | 2016-05-06 | 4 | Crabb Joseph M | OTCQB:NESC | Common Stock | D | 0,2800 | -819 | -0 | 25.681 | ||||
| 2016-04-04 | 2016-04-01 | 4 | Heinlein Gregory J | OTCQB:NESC | Common Stock | D | 0,2600 | -4.354 | -1 | 20.969 | ||||
| 2016-03-22 | 2016-03-17 | 4 | Heinlein Gregory J | NESC | Common Stock | D | 0,3200 | -2.177 | -1 | 25.323 | ||||
| 2016-03-22 | 2015-03-17 | 4 | Heinlein Gregory J | NESC | Common Stock | D | 20.000 | 27.500 | ||||||
| 2015-12-07 | 2015-12-04 | 4 | JOHNSRUD MARK D | NES | Common Stock | D | 0,8378 | 50.000 | 42 | 10.189.734 | ||||
| 2015-11-30 | 2015-11-25 | 4 | JOHNSRUD MARK D | NES | Common Stock | D | 0,9364 | 30.000 | 28 | 10.139.734 | ||||
| 2015-11-12 | 2015-11-10 | 4 | Simonds Robert | NES | Common Stock | D | 60.000 | 88.789 | ||||||
| 2015-11-12 | 2015-11-10 | 4 | Barkett Edward A | NES | Common Stock | D | 60.000 | 79.504 | ||||||
| 2015-11-12 | 2015-11-10 | 4 | Nelson Ralph Daniel | NES | Common Stock | D | 60.000 | 76.729 | ||||||
| 2015-11-12 | 2015-11-10 | 4 | AUSTIN WILLIAM M | NES | Common Stock | D | 60.000 | 61.579 | ||||||
| 2015-11-12 | 2015-11-10 | 4 | HOLMES TOD C | NES | Common Stock | D | 60.000 | 70.946 | ||||||
| 2015-11-12 | 2015-11-10 | 4 | QUAYLE DAN | NES | Common Stock | D | 60.000 | 78.689 | ||||||
| 2015-11-12 | 2015-11-10 | 4 | OSBORNE ALFRED E JR | NES | Common Stock | D | 60.000 | 76.942 | ||||||
| 2015-08-18 | 2015-08-17 | 4 | Heinlein Gregory J | NES | Common Stock | D | 1,7900 | 5.500 | 10 | 7.500 | ||||
| 2015-06-10 | 2015-06-09 | 4 | Heinlein Gregory J | NES | Common Stock | D | 5,2500 | 2.000 | 10 | 2.000 | ||||
| 2015-05-15 | 2015-05-14 | 4 | JOHNSRUD MARK D | NES | Common Stock | D | 5,2480 | 25.000 | 131 | 10.109.734 | ||||
| 2015-03-19 | 2015-03-17 | 4 | Heinlein Gregory J | NES | Stock Options | D | 3,44 | 30.000 | 177.894 | |||||
| 2015-01-16 | 2015-01-14 | 4 | Heinlein Gregory J | NES | Stock Options | D | 5,52 | 147.894 | 147.894 | |||||
| 2015-01-16 | 2015-01-14 | 4 | Crabb Joseph M | NES | Stock Options | D | 5,52 | 139.194 | 139.194 | |||||
| 2015-01-09 | 3 | Hilgendorf Stacy W. 401(k) | NES | Common Stock | I | 600 | ||||||||
| 2015-01-09 | 3 | Hilgendorf Stacy W. 401(k) | NES | Common Stock | I | 600 | ||||||||
| 2015-01-07 | 3 | Heinlein Gregory J | NES | Common Stock | D | 0 | ||||||||
| 2014-12-15 | 2014-12-12 | 4 | JOHNSRUD MARK D | NES | Common Stock | D | 6,7740 | 31.400 | 213 | 10.084.734 | ||||
| 2014-12-12 | 2014-12-11 | 4 | OSBORNE ALFRED E JR | NES | Common Stock | I | 7,0300 | 5.000 | 35 | 9.000 | ||||
| 2014-12-12 | 2014-12-11 | 4 | JOHNSRUD MARK D | NES | Common Stock | D | 7,1200 | 50.000 | 356 | 10.053.334 | ||||
| 2014-12-11 | 2014-12-10 | 4 | JOHNSRUD MARK D | NES | Common Stock | D | 6,4350 | 18.600 | 120 | 10.003.334 | ||||
| 2014-12-03 | 2014-12-02 | 4 | Crabb Joseph M | NES | Common Stock | D | 8,1630 | 4.000 | 33 | 26.500 | ||||
| 2014-12-02 | 2014-12-02 | 4 | Barkett Edward A | NES | Common Stock | I | 8,4050 | 5.000 | 42 | 10.000 | ||||
| 2014-11-28 | 2014-11-26 | 4 | Crabb Joseph M | NES | Common Stock | D | 10,3950 | 3.500 | 36 | 22.500 | ||||
| 2014-11-26 | 2014-11-25 | 4 | JOHNSRUD MARK D | NES | Common Stock | D | 11,4170 | 4.100 | 47 | 9.984.734 | ||||
| 2014-11-25 | 2014-11-24 | 4 | OSBORNE ALFRED E JR | NES | Common Stock | D | 9,3402 | 5.000 | 47 | 19.414 | ||||
| 2014-11-21 | 2014-11-19 | 4 | JOHNSRUD MARK D | NES | Common Stock | D | 8,0147 | 16.315 | 131 | 9.980.634 | ||||
| 2014-11-20 | 2014-11-18 | 4 | JOHNSRUD MARK D | NES | Common Stock | D | 8,4410 | 50.000 | 422 | 9.964.319 | ||||
| 2014-11-19 | 2014-11-17 | 4 | JOHNSRUD MARK D | NES | Common Stock | D | 8,5180 | 25.000 | 213 | 9.914.319 | ||||
| 2014-11-18 | 2014-11-14 | 4 | Chisholm Christopher | NES | Common Stock | D | 8,7800 | -4.574 | -40 | 28.414 | ||||
| 2014-11-18 | 2014-11-14 | 4 | JOHNSRUD MARK D | NES | Common Stock | D | 8,5460 | 50.000 | 427 | 9.889.319 | ||||
| 2014-11-17 | 2014-11-13 | 4 | HOLMES TOD C | NES | Common Stock | D | 3.946 | 10.946 | ||||||
| 2014-11-17 | 2014-11-13 | 4 | AUSTIN WILLIAM M | NES | Common Stock | D | 1.579 | 1.579 | ||||||
| 2014-11-17 | 2014-11-13 | 4 | QUAYLE DAN | NES | Common Stock | D | 9.470 | 18.689 | ||||||
| 2014-11-17 | 2014-11-13 | 4 | OSBORNE ALFRED E JR | NES | Common Stock | D | 9.470 | 14.414 | ||||||
| 2014-11-17 | 2014-11-13 | 4 | Barkett Edward A | NES | Common Stock | D | 9.470 | 19.504 | ||||||
| 2014-11-17 | 2014-11-13 | 4 | Simonds Robert | NES | Common Stock | D | 9.470 | 28.789 | ||||||
| 2014-11-17 | 2014-11-13 | 4 | Nelson Ralph Daniel | NES | Common Stock | D | 7,8180 | 1.275 | 10 | 7.259 | ||||
| 2014-11-17 | 2014-11-13 | 4 | Nelson Ralph Daniel | NES | Common Stock | D | 9.470 | 16.729 | ||||||
| 2014-11-13 | 2014-11-13 | 4 | JOHNSRUD MARK D | NES | Common Stock | D | 7,8950 | 25.000 | 197 | 9.839.319 | ||||
| 2014-11-13 | 2014-11-12 | 4 | JOHNSRUD MARK D | NES | Common Stock | D | 8,2400 | 25.000 | 206 | 9.814.319 | ||||
| 2014-09-15 | 2014-09-12 | 4 | HOLMES TOD C | NES | Common Stock | D | 14,6800 | 7.000 | 103 | 7.000 | ||||
| 2014-09-09 | 2014-09-05 | 4 | Crabb Joseph M | NES | Common Stock | D | 13,6100 | 5.000 | 68 | 19.000 | ||||
| 2014-09-08 | 2014-09-05 | 4 | JOHNSRUD MARK D | NES | Common Stock | D | 13,8100 | 99.551 | 1.375 | 9.789.319 | ||||
| 2014-09-08 | 2014-09-04 | 4 | JOHNSRUD MARK D | NES | Common Stock | D | 13,2700 | 25.000 | 332 | 9.689.768 | ||||
| 2014-09-05 | 2014-09-04 | 4 | Crabb Joseph M | NES | Common Stock | D | 13,1800 | 5.000 | 66 | 14.000 | ||||
| 2014-05-08 | 2014-05-06 | 4 | Crabb Joseph M | NES | Stock Options | D | 16,23 | 7.500 | 7.500 | |||||
| 2014-05-08 | 2014-05-06 | 4 | Crabb Joseph M | NES | Common Stock | D | 6.500 | 9.000 | ||||||
| 2014-04-15 | 3 | Crabb Joseph M | NES | Common Stock | D | 5.000 | ||||||||
| 2014-04-15 | 3 | Crabb Joseph M | NES | Common Stock | D | 5.000 | ||||||||
| 2014-03-31 | 2014-03-27 | 4 | JOHNSRUD MARK D | NES | Common Stock | D | 19,0663 | 10.000 | 191 | 9.664.768 | ||||
| 2014-03-27 | 2014-03-25 | 4 | JOHNSRUD MARK D | NES | Common Stock | D | 18,5983 | 28.477 | 530 | 9.654.768 | ||||
| 2014-03-26 | 2013-12-05 | 4 | SPENCE KEVIN L. | NES | Common Stock | D | 4.944 | 8.094 | ||||||
| 2014-03-26 | 2013-12-05 | 4 | OSBORNE ALFRED E JR | NES | Common Stock | D | 4.944 | 8.844 | ||||||
| 2014-03-26 | 2013-12-05 | 4 | QUAYLE DAN | NES | Common Stock | D | 4.944 | 10.094 | ||||||
| 2014-03-26 | 2013-12-05 | 4 | HOLTZ LOU | NES | Common Stock | D | 4.944 | 28.917 | ||||||
| 2014-03-26 | 2013-12-05 | 4 | Seidel Andrew D | NES | Common Stock | D | 4.944 | 13.994 | ||||||
| 2014-03-26 | 2013-12-05 | 4 | Barkett Edward A | NES | Common Stock | D | 4.944 | 17.668 | ||||||
| 2014-03-26 | 2013-12-05 | 4 | Simonds Robert | NES | Common Stock | D | 4.944 | 20.194 | ||||||
| 2014-03-26 | 2013-12-05 | 4 | Nelson Ralph Daniel | NES | Common Stock | D | 4.944 | 5.984 | ||||||
| 2014-03-20 | 2014-03-20 | 4 | Parkinson Jay Curtis | NES | Common Stock | D | 17,8700 | 2.500 | 45 | 105.000 | ||||
| 2014-03-20 | 2014-03-12 | 4 | Parkinson Jay Curtis | NES | Common Stock | D | 75.000 | 102.500 | ||||||
| 2014-03-17 | 2014-03-12 | 4 | Chisholm Christopher | NES | Common Stock | D | 14.988 | 32.988 | ||||||
| 2014-01-06 | 2013-12-11 | 4 | Nelson Ralph Daniel | NES | Common Stock | D | 14,4200 | 1.040 | 15 | 1.040 | ||||
| 2013-12-18 | 2013-12-17 | 4 | OSBORNE ALFRED E JR | NES | Common Stock | I | 14,4499 | 2.500 | 36 | 4.000 | ||||
| 2013-12-18 | 2013-12-16 | 4 | Barkett Edward A | NES | Common Stock | D | 14,9710 | 5.000 | 75 | 12.723 | ||||
| 2013-12-12 | 2013-12-11 | 4 | Chisholm Christopher | NES | Common Stock | D | 14,4588 | 3.000 | 43 | 18.000 | ||||
| 2013-12-12 | 2013-12-11 | 4 | Kevane Christopher E. | NES | Common Stock | D | 14,5809 | 2.000 | 29 | 4.000 | ||||
| 2013-12-12 | 2013-12-10 | 4 | Kevane Christopher E. | NES | Common Stock | D | 14,4393 | 2.000 | 29 | 2.000 | ||||
| 2013-12-12 | 2013-12-10 | 4 | Parkinson Jay Curtis | NES | Common Stock | D | 14,2300 | 5.000 | 71 | 27.500 | ||||
| 2013-12-12 | 2013-12-11 | 4 | JOHNSRUD MARK D | NES | Common Stock | D | 14,3729 | 25.000 | 359 | 9.626.291 | ||||
| 2013-12-12 | 2013-12-10 | 4 | JOHNSRUD MARK D | NES | Common Stock | D | 14,5048 | 1.291 | 19 | 9.601.291 | ||||
| 2013-12-02 | 2013-11-29 | 4 | JOHNSRUD MARK D | NES | Common Stock | D | 1,6950 | 100.000 | 170 | 96.000.000 | ||||
| 2013-09-03 | 2013-08-30 | 4/A | JOHNSRUD MARK D | NES | Common Stock | D | 2,3199 | 550.000 | 1.276 | 95.900.000 | ||||
| 2013-09-03 | 2013-08-29 | 4/A | JOHNSRUD MARK D | NES | Common Stock | D | 2,3006 | 350.000 | 805 | 95.350.000 | ||||
| 2013-09-03 | 2013-08-29 | 4 | Simonds Robert | NES | Common Stock | D | 2,3000 | 25.000 | 57 | 152.500 | ||||
| 2013-09-03 | 2013-08-30 | 4 | JOHNSRUD MARK D | NES | Common Stock | D | 2,3199 | 550.000 | 1.276 | 95.900.000 | ||||
| 2013-09-03 | 2013-08-29 | 4 | JOHNSRUD MARK D | NES | Common Stock | D | 2,3006 | 350.000 | 805 | 95.350.000 | ||||
| 2013-08-12 | 2013-08-12 | 4 | Parkinson Jay Curtis | NES | Common Stock, par value $0.001 | D | 2,9400 | 25.000 | 74 | 225.000 | ||||
| 2013-03-20 | 2012-10-22 | 4 | HOLTZ LOU | HEK | Common Stock, par value $0.001 | D | 17.500 | 239.732 | ||||||
| 2013-03-20 | 2012-10-22 | 4 | OSBORNE ALFRED E JR | HEK | Common Stock, par value $0.001 | D | 17.500 | 41.500 | ||||||
| 2013-03-20 | 2012-10-22 | 4 | QUAYLE DAN | HEK | Common Stock, par value $0.001 | D | 17.500 | 51.500 | ||||||
| 2013-03-20 | 2012-10-22 | 4 | SPENCE KEVIN L. | HEK | Common Stock, par value $0.001 | D | 17.500 | 31.500 | ||||||
| 2013-03-20 | 2012-10-22 | 4 | Seidel Andrew D | HEK | Common Stock, par value $0.001 | D | 17.500 | 41.500 | ||||||
| 2013-03-20 | 2012-10-22 | 4 | Barkett Edward A | HEK | Common Stock, par value $0.001 | D | 17.500 | 77.238 | ||||||
| 2013-03-20 | 2012-10-22 | 4 | Simonds Robert | HEK | Common Stock, par value $0.001 | D | 17.500 | 127.500 | ||||||
| 2013-02-14 | 2012-12-31 | 5 | HECKMANN RICHARD J | HEK | Common Stock, par value $0.001 | I | -300.000 | 11.754.736 | ||||||
| 2013-02-14 | 2012-12-21 | 5 | HECKMANN RICHARD J | HEK | Common Stock, par value $0.001 | D | -25.000 | 165.350 | ||||||
| 2013-02-14 | 2012-12-21 | 5 | HECKMANN RICHARD J | HEK | Common Stock, par value $0.001 | D | -4.000 | 190.350 | ||||||
| 2013-02-14 | 2012-12-21 | 5 | HECKMANN RICHARD J | HEK | Common Stock, par value $0.001 | D | -2.000 | 194.350 | ||||||
| 2013-02-14 | 2012-12-21 | 5 | HECKMANN RICHARD J | HEK | Common Stock, par value $0.001 | D | -15.000 | 196.350 | ||||||
| 2013-02-14 | 2012-11-21 | 5 | HECKMANN RICHARD J | HEK | Common Stock, par value $0.001 | D | 29.850 | 211.350 | ||||||
| 2012-12-10 | 3 | JOHNSRUD MARK D | HEK | Common Stock, par value $0.001 | D | 95.000.000 | ||||||||
| 2012-10-11 | 2012-10-01 | 4 | Gordon Charles R. | HEK | Employee Stock option (right to buy) | D | 4,20 | 100.000 | 100.000 | |||||
| 2012-10-11 | 2012-10-01 | 4 | Gordon Charles R. | HEK | Common Stock, par value $0.001 | D | 50.000 | 100.000 | ||||||
| 2012-09-12 | 3 | Parkinson Jay Curtis | HEK | No Securities owned | D | 0 | ||||||||
| 2012-09-12 | 2012-09-10 | 4 | Parkinson Jay Curtis | HEK | Employee Stock Option (right to buy) | D | 3,99 | 300.000 | 300.000 | |||||
| 2012-09-12 | 2012-09-10 | 4 | Parkinson Jay Curtis | HEK | Common Stock, par value $0.001 | D | 200.000 | 200.000 | ||||||
| 2012-05-22 | 2012-05-18 | 4 | Simonds Robert | HEK | Common Stock, | D | 3,4500 | 10.000 | 34 | 110.000 | ||||
| 2012-05-18 | 2012-05-17 | 4 | HOLTZ LOU | HEK | Common Stock, par value $0.001 | I | 3,6548 | 100.000 | 365 | 100.000 | ||||
| 2012-05-10 | 3/A | Devlin James | HEK | No Securities Owned | D | 0 | ||||||||
| 2012-05-10 | 2012-05-08 | 4 | Georgino Damian C By trust | HEK | Common Stock, par value $0.001 | I | 3,5400 | 2.000 | 7 | 2.000 | ||||
| 2012-05-10 | 2012-05-08 | 4 | OSBORNE ALFRED E JR | HEK | Common Stock, par value $0.001 | I | 3,5400 | 15.000 | 53 | 15.000 | ||||
| 2012-05-10 | 2012-05-08 | 4 | Seidel Andrew D | HEK | Common Stock, par value $0.001 | I | 3,6600 | 9.000 | 33 | 66.000 | ||||
| 2012-05-10 | 2012-05-10 | 4 | Barkett Edward A | HEK | Common Stock, par value $0.001 | D | 3,5600 | 5.738 | 20 | 59.738 | ||||
| 2012-04-12 | 3 | Devlin James | HEK | No Securities Owned | D | 0 | ||||||||
| 2012-04-12 | 2012-04-10 | 4 | Devlin James | HEK | Employee Stock Option (right to buy) | D | 3,89 | 300.000 | 300.000 | |||||
| 2012-02-21 | 2012-02-16 | 4 | HECKMANN RICHARD J | HEK | Common Stock, par value $0.001 | I | 5,1044 | -75.000 | -383 | 12.054.736 | ||||
| 2012-02-14 | 2011-12-21 | 5 | HECKMANN RICHARD J | HEK | Common Stock, par value $0.001 | D | -30.000 | 181.500 | ||||||
| 2012-02-14 | 2011-12-21 | 5 | HECKMANN RICHARD J | HEK | Common Stock, par value $0.001 | D | -2.000 | 211.500 | ||||||
| 2012-02-14 | 2011-12-21 | 5 | HECKMANN RICHARD J | HEK | Common Stock, par value $0.001 | D | -18.500 | 213.500 | ||||||
| 2012-02-14 | 2011-12-21 | 5 | HECKMANN RICHARD J | HEK | Common Stock, par value $0.001 | D | -4.000 | 232.000 | ||||||
| 2012-02-14 | 2011-12-21 | 5 | HECKMANN RICHARD J | HEK | Common Stock, par value $0.001 | D | -10.000 | 236.000 | ||||||
| 2012-02-14 | 2011-03-30 | 5 | HECKMANN RICHARD J | HEK | Common Stock, par value $0.001 | D | -4.000 | 246.000 | ||||||
| 2012-01-05 | 2012-01-04 | 4 | HECKMANN RICHARD J | HEK | Common Stock, par value $0.001 | I | 6,6790 | -65.000 | -434 | 12.129.736 | ||||
| 2012-01-05 | 2012-01-03 | 4 | HECKMANN RICHARD J | HEK | Common Stock, par value $0.001 | I | 6,6919 | -10.000 | -67 | 12.194.736 | ||||
| 2011-11-16 | 2011-11-15 | 4 | Chisholm Christopher | HEK | Employee Stock Option (right to buy) | D | 6,43 | -150.000 | 150.000 | |||||
| 2011-11-16 | 2011-11-15 | 4 | Chisholm Christopher | HEK | Common Stock | D | 150.000 | 150.000 | ||||||
| 2011-01-05 | 2010-10-07 | 4 | Gordon Charles R. | HEK | Employee Stock Option (right to buy) | D | 3,91 | 550.000 | 550.000 | |||||
| 2010-12-30 | 3 | SPENCE KEVIN L. | HEK | No securities are beneficially owned | D | 0 | ||||||||
| 2010-12-20 | 2010-10-07 | 4 | OSBORNE ALFRED E JR | HEK | Common Stock, par value $0.001 | D | 20.000 | 20.000 | ||||||
| 2010-12-20 | 2010-10-07 | 4 | QUAYLE DAN | HEK | Common Stock, par value $0.001 | D | 20.000 | 20.000 | ||||||
| 2010-12-20 | 2010-10-07 | 4 | HOLTZ LOU | HEK | Common Stock, par value $0.001 | D | 20.000 | 208.232 | ||||||
| 2010-12-20 | 2010-10-07 | 4/A | Seidel Andrew D | HEK | Common Stock, par value $0.001 | D | 20.000 | 26.667 | ||||||
| 2010-12-20 | 2010-10-07 | 4 | Simonds Robert | HEK | Employee Stock Option (right to buy) | D | 3,91 | 500.000 | 500.000 | |||||
| 2010-12-20 | 2010-10-07 | 4 | Simonds Robert | HEK | Common Stock, par value $0.001 | D | 20.000 | 100.000 | ||||||
| 2010-12-20 | 2010-12-16 | 4 | HECKMANN RICHARD J By Spouse | HEK | Common Stock Par Value $0.001 | I | 4,3524 | -47.000 | -205 | 99.500 | ||||
| 2010-12-20 | 2010-12-16 | 4 | HECKMANN RICHARD J See Footnotes | HEK | Common Stock Par Value $0.001 | I | -2.500 | 12.657.236 | ||||||
| 2010-12-20 | 2010-12-16 | 4 | HECKMANN RICHARD J See Footnotes | HEK | Common Stock Par Value $0.001 | I | -2.500 | 12.657.236 | ||||||
| 2010-12-20 | 2010-12-16 | 4 | HECKMANN RICHARD J See Footnotes | HEK | Common Stock Par Value $0.001 | I | -2.500 | 12.657.236 | ||||||
| 2010-12-20 | 2010-12-16 | 4 | HECKMANN RICHARD J See Footnotes | HEK | Common Stock Par Value $0.001 | I | -2.500 | 12.659.736 | ||||||
| 2010-12-20 | 2010-12-16 | 4 | HECKMANN RICHARD J See Footnotes | HEK | Common Stock Par Value $0.001 | I | -2.500 | 12.662.236 | ||||||
| 2010-12-20 | 2010-12-16 | 4 | HECKMANN RICHARD J See Footnotes | HEK | Common Stock Par Value $0.001 | I | -2.500 | 12.664.736 | ||||||
| 2010-12-20 | 2010-12-16 | 4 | HECKMANN RICHARD J See Footnotes | HEK | Common Stock Par Value $0.001 | I | -2.500 | 12.667.236 | ||||||
| 2010-12-20 | 2010-12-16 | 4 | HECKMANN RICHARD J See Footnotes | HEK | Common Stock Par Value $0.001 | I | -7.500 | 12.669.736 | ||||||
| 2010-12-20 | 2010-12-16 | 4 | HECKMANN RICHARD J See Footnotes | HEK | Common Stock Par Value $0.001 | I | -15.000 | 12.677.236 | ||||||
| 2010-12-20 | 2010-12-16 | 4 | HECKMANN RICHARD J See Footnotes | HEK | Common Stock Par Value $0.001 | I | -90.000 | 12.692.236 | ||||||
| 2010-12-17 | 2010-10-07 | 4 | Barkett Edward A | HEK | Common Stock, par value $0.001 | D | 20.000 | 40.000 | ||||||
| 2007-11-09 | 3 | HOLTZ LOU | HEK | Common Stock, Par Value $0.001 Per Share | D | 200.000 | ||||||||
| 2007-11-09 | 3 | OSBORNE ALFRED E JR | HEK | Common Stock, Par Value $0.001 Per Share | D | 100.000 | ||||||||
| 2007-11-09 | 3 | QUAYLE DAN | HEK | Common Stock, Par Value $0.001 Per Share | D | 100.000 |
P
Türev olmayan veya türev menkul kıymetlerin açık piyasa veya özel alımı
S
Türev olmayan veya türev menkul kıymetlerin açık piyasa veya özel satımı
A
Şirketten menkul kıymetlerin verilmesi, ödüllendirilmesi veya başka şekilde edinilmesi (opsiyon gibi)
C
Türevin dönüşümü
D
Menkul kıymetlerin şirkete geri satışı veya devri
F
Kullanım bedelinin veya vergi yükümlülüğünün şirketten alınan menkul kıymetlerin bir kısmı kullanılarak ödenmesi
G
Menkul kıymetlerin içeriden birine veya kişiye hediye edilmesi
K
Özkaynak swapları ve benzeri riskten korunma işlemleri
M
Şirketten alınan türev menkul kıymetin kullanılması veya dönüştürülmesi (opsiyon gibi)
V
Form 4te gönüllü olarak bildirilen bir işlem
J
Diğer (işlemi açıklayan bir dipnotla birlikte)