Temel İstatistikler
| Kurumsal Sahipler | 172 total, 172 long only, 0 short only, 0 long/short - change of 7,48% MRQ |
| Ortalama Portföy Dağıtımı | 0.9621 % - change of -36,77% MRQ |
| Kurumsal Hisseler (Uzun) | 27.678.933 (ex 13D/G) - change of 1,29MM shares 11,00% MRQ |
| Kurumsal Değer (Uzun) | $ 589.369 USD ($1000) |
Kurumsal Mülkiyet ve Hissedarlar
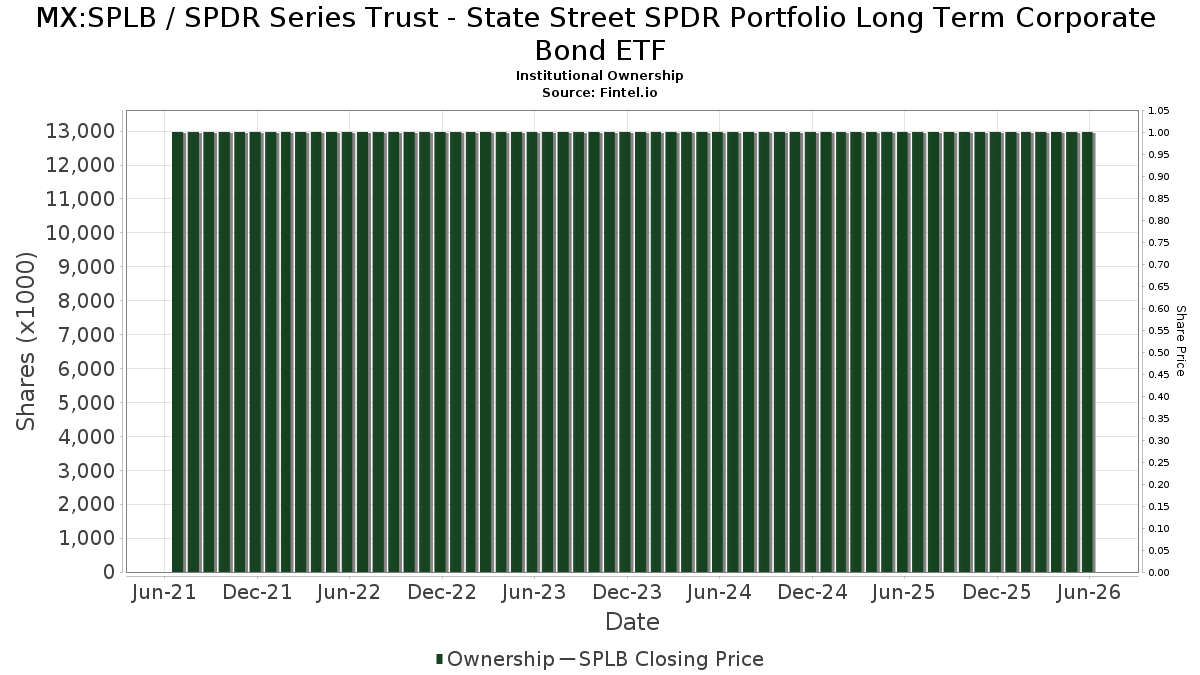
SPDR Series Trust - State Street SPDR Portfolio Long Term Corporate Bond ETF (MX:SPLB) var 172 Menkul Kıymetler Borsası Komisyonuna (SEC) 13D/G veya 13F formları dolduran kurumsal sahipler ve hissedarlar. Bu kurumların toplam 27,678,933 hissesi bulunmaktadır. En büyük hissedarlar arasındakiler: State Street Corp, LPL Financial LLC, FISR - SPDR SSGA Fixed Income Sector Rotation ETF, Bank Of America Corp /de/, Rockland Trust Co, SSTIX - State Street Total Return V.I.S. Fund Class 1 Shares, Nyl Investors Llc, Thrivent Financial For Lutherans, Envestnet Asset Management Inc, and Morgan Stanley .
SPDR Series Trust - State Street SPDR Portfolio Long Term Corporate Bond ETF (BMV:SPLB) kurumsal mülkiyet yapısı, kurum ve fonlara göre şirketteki mevcut pozisyonların yanı sıra pozisyon büyüklüğündeki son değişiklikleri gösterir. Büyük hissedarlar bireysel yatırımcıları, yatırım fonlarını, hedge fonlarını veya kurumları içerebilir. Çizelge 13D, yatırımcının şirketin %5inden fazlasını elinde bulundurduğunu (veya elinde önceden bulundurduğunu) ve iş stratejisinde aktif olarak bir değişiklik yapmayı planladığını (veya önceden planladığını) gösterir. Çizelge 13G, %5in üzerinde pasif yatırımı gösterir.
Fon Eğilim Skoru
Fon Eğilim Skoru (diğer adıyla Sahiplik Birikimi Skoru), fonlar tarafından en çok satın alınan hisse senetlerini bulur. En yüksek düzeyde kurumsal birikime sahip şirketleri tanımlayan karmaşık, çok faktörlü kantitatif bir modelin sonucudur. Skorlama modeli, açıklanan sahiplerdeki toplam artışın, bu sahiplerdeki portföy dağıtımındaki değişikliklerin ve diğer ölçümlerin bir kombinasyonunu kullanır. Sayı 0dan 100e kadar değişir; daha yüksek sayılar emsallerine göre daha yüksek bir birikim düzeyine işaret eder ve 50 ortalamadır.
Güncelleme Sıklığı: Günlük
En üst düzey şirketlerin listesini sağlayan Sahiplik Gezginine bakın.
AI+ Ask Fintel’s AI assistant about SPDR Series Trust - State Street SPDR Portfolio Long Term Corporate Bond ETF.
Select a question to share a public post with an AI-crafted answer.
Thinking of good questions…
13F ve NPORT Başvuruları
13F başvurularına ilişkin ayrıntılar ücretsizdir. NP başvurularına ilişkin ayrıntılar premium üyelik gerektirir. Yeşil satırlar yeni pozisyonları gösterir. Kırmızı satırlar kapalı pozisyonları gösterir. Tam işlem geçmişini görmek için linkesimgesine tıklayınız.
Yükseltin
premium verilerin kilidini açmak ve Excele aktarmak için ![]() .
.
| Dosya Tarihi | Kaynak | Yatırımcı | Tür | Ortalama Fiyat (Tahmin) |
Hisseler | Δ Hisseler (%) |
Bildirilen Değer (1000$) |
Δ Değer (%) |
Bağlantı Noktası Dağıtımı (%) |
|
|---|---|---|---|---|---|---|---|---|---|---|
| 2025-11-19 | 13F | Sunbelt Securities, Inc. | 1.059 | 0,00 | 24 | 4,35 | ||||
| 2025-11-12 | 13F | NewSquare Capital LLC | 0 | -100,00 | 0 | |||||
| 2025-11-14 | 13F | Two Sigma Securities, Llc | 0 | -100,00 | 0 | |||||
| 2026-01-22 | 13F | Harwood Advisory Group, LLC | 8 | 0,00 | 0 | |||||
| 2026-01-26 | 13F | Mirae Asset Global Investments Co., Ltd. | 265.000 | -23,41 | 5.984 | -25,20 | ||||
| 2025-08-28 | NP | SSTIX - State Street Total Return V.I.S. Fund Class 1 Shares | 1.671.861 | 2,26 | 37.734 | 2,25 | ||||
| 2026-02-10 | 13F/A | Northwestern Mutual Wealth Management Co | 698.268 | -1,67 | 15.767 | -3,97 | ||||
| 2026-02-06 | 13F | IFP Advisors, Inc | 204.601 | -22,53 | 4.620 | -24,34 | ||||
| 2026-02-17 | 13F | Blair William & Co/il | 656 | 103,10 | 15 | 100,00 | ||||
| 2025-11-03 | 13F | Archer Investment Corp | 0 | -100,00 | 0 | -100,00 | ||||
| 2026-01-02 | 13F | Boltwood Capital Management | 45.200 | -1,20 | 1.021 | -3,50 | ||||
| 2026-02-03 | 13F | Koshinski Asset Management, Inc. | 36.305 | -16,08 | 820 | -18,10 | ||||
| 2026-02-17 | 13F | Gotham Asset Management, LLC | 470.384 | 26,71 | 10.621 | 23,76 | ||||
| 2026-01-23 | 13F | Hedeker Wealth, LLC | 269.935 | -0,85 | 6.095 | -3,16 | ||||
| 2026-02-17 | 13F | Wiley Bros.-aintree Capital, Llc | 20.612 | -4,88 | 465 | -7,19 | ||||
| 2026-02-11 | 13F | Simplex Trading, Llc | 561 | 13 | ||||||
| 2026-02-13 | 13F | Kestra Advisory Services, LLC | 0 | -100,00 | 0 | |||||
| 2025-09-26 | 13F | Capital A Wealth Management, LLC | 0 | -100,00 | 0 | |||||
| 2026-01-26 | 13F | Cwm, Llc | 13.189 | 21,04 | 0 | |||||
| 2026-02-17 | 13F | State Of Wisconsin Investment Board | 42.920 | 0,00 | 969 | -2,32 | ||||
| 2026-02-12 | 13F | BlackRock, Inc. | 0 | -100,00 | 0 | |||||
| 2026-02-03 | 13F | Emerald Investment Partners, Llc | 10.214 | -2,35 | 231 | -4,56 | ||||
| 2026-02-13 | 13F | Banco Santander, S.A. | 17.822 | 0,00 | 402 | -2,43 | ||||
| 2025-10-16 | 13F | Lockerman Financial Group, Inc. | 0 | -100,00 | 0 | |||||
| 2026-01-20 | 13F | Stratos Wealth Partners, LTD. | 11.086 | 250 | ||||||
| 2026-02-06 | 13F | Advisory Alpha, LLC | 0 | -100,00 | 0 | |||||
| 2026-02-11 | 13F | Strategic Advocates LLC | 818.385 | -5,14 | 18.586 | -6,82 | ||||
| 2026-02-11 | 13F | Jpmorgan Chase & Co | 170.815 | 7,78 | 3.857 | 5,27 | ||||
| 2025-11-06 | 13F | International Private Wealth Advisors LLC | 0 | -100,00 | 0 | |||||
| 2025-08-28 | NP | INKM - SPDR SSGA Income Allocation ETF This fund is a listed as child fund of State Street Corp and if that institution has disclosed ownership in this security, then these positions will not be double counted when calculating total shares and total value | 57.166 | -10,58 | 1.290 | -10,54 | ||||
| 2026-02-06 | 13F | Envestnet Portfolio Solutions, Inc. | 383.504 | 8.660 | ||||||
| 2026-02-17 | 13F | Bramshill Investments, LLC | 500.000 | 11.290 | ||||||
| 2025-11-04 | 13F | Pineridge Advisors LLC | 16 | 6,67 | 0 | |||||
| 2026-01-13 | 13F | Signal Advisors Wealth, LLC | 23.117 | 522 | ||||||
| 2026-02-11 | 13F | Aspetuck Financial Management LLC | 121.554 | 0,00 | 2.745 | -2,35 | ||||
| 2026-02-04 | 13F | Ameritas Advisory Services, LLC | 9.233 | 208 | ||||||
| 2026-02-13 | 13F | Arete Wealth Advisors, LLC | 68.779 | 2 | ||||||
| 2026-02-13 | 13F | Stifel Financial Corp | 9.470 | 214 | ||||||
| 2026-02-17 | 13F | Pinnacle Financial Partners, Inc. | 115.123 | 2.600 | ||||||
| 2026-02-17 | 13F | Strive Financial Group ,LLC | 18.383 | 415 | ||||||
| 2026-01-16 | 13F | Ronald Blue Trust, Inc. | 792 | 0,00 | 18 | -5,56 | ||||
| 2026-01-23 | 13F | Guidance Capital, Inc | 18.670 | 4,78 | 426 | 1,91 | ||||
| 2026-01-21 | 13F | Capital Investment Advisory Services, LLC | 0 | -100,00 | 0 | |||||
| 2026-02-10 | 13F | Root Financial Partners, LLC | 0 | -100,00 | 0 | |||||
| 2026-01-21 | 13F | Truefg, Llc | 50.338 | 0,90 | 1.137 | -1,47 | ||||
| 2026-01-29 | 13F | RMG Wealth Management LLC | 0 | -100,00 | 0 | |||||
| 2026-02-13 | 13F | Smartleaf Asset Management LLC | 86 | 2 | ||||||
| 2026-02-02 | 13F | Cornerstone Planning Group LLC | 36 | -46,27 | 1 | -100,00 | ||||
| 2026-01-05 | 13F | Park Avenue Securities Llc | 64.732 | 1 | ||||||
| 2026-01-13 | 13F | Sharkey, Howes & Javer | 0 | -100,00 | 0 | |||||
| 2026-02-13 | 13F | Level Four Advisory Services, Llc | 19.007 | 0,00 | 429 | -2,28 | ||||
| 2026-01-21 | 13F | Sound Income Strategies, LLC | 3.574 | 97,90 | 81 | 97,56 | ||||
| 2026-02-11 | 13F | Nyl Investors Llc | 1.456.598 | 32.890 | ||||||
| 2026-01-21 | 13F | Raleigh Capital Management Inc. | 28.999 | 3.014,82 | 655 | 3.014,29 | ||||
| 2026-02-13 | 13F | Mml Investors Services, Llc | 39.558 | 34,79 | 893 | 31,71 | ||||
| 2026-01-23 | 13F | Rsm Us Wealth Management Llc | 11.085 | 1,66 | 252 | -0,40 | ||||
| 2025-10-20 | 13F | Northwest Capital Management Inc | 0 | -100,00 | 0 | |||||
| 2025-08-28 | NP | GPMIX - GuidePath(R) Multi-Asset Income Allocation Fund Service Shares | 61.824 | 33,38 | 1.395 | 33,37 | ||||
| 2026-02-11 | 13F | O'shaughnessy Asset Management, Llc | 119 | -24,20 | 3 | -33,33 | ||||
| 2026-01-23 | 13F | Fifth Third Securities, Inc. | 175.988 | 2,38 | 3.974 | -0,03 | ||||
| 2026-02-17 | 13F | Cetera Investment Advisers | 128.761 | 49,82 | 2.907 | 46,30 | ||||
| 2026-02-17 | 13F | Ameriprise Financial Inc | 43.764 | -59,48 | 994 | -60,23 | ||||
| 2026-01-29 | 13F | UBS Group AG | 72.052 | -12,44 | 1.627 | -14,51 | ||||
| 2026-02-17 | 13F | Advisor Group Holdings, Inc. | 269.219 | -22,87 | 6.079 | -23,47 | ||||
| 2025-11-06 | 13F | Balboa Wealth Partners | 0 | -100,00 | 0 | -100,00 | ||||
| 2026-02-18 | 13F | GWM Advisors LLC | 41.749 | 483,82 | 943 | 470,91 | ||||
| 2026-02-03 | 13F | RFG Advisory, LLC | 34.374 | 15,38 | 776 | 12,79 | ||||
| 2026-02-03 | 13F | International Assets Investment Management, Llc | 1.825 | 41 | ||||||
| 2026-01-26 | 13F | Decker Retirement Planning Inc. | 9.202 | -3,31 | 208 | -5,91 | ||||
| 2026-01-27 | 13F | Global Financial Private Client, LLC | 13.047 | 23,35 | 295 | 20,49 | ||||
| 2026-02-12 | 13F | RMR Capital Management, LLC | 23.971 | 0,00 | 541 | -2,35 | ||||
| 2026-02-05 | 13F | Conning Inc. | 124.080 | 0,00 | 2.802 | -2,34 | ||||
| 2026-02-17 | 13F | Clark Capital Management Group, Inc. | 104.851 | 1,96 | 2.368 | -0,42 | ||||
| 2026-01-06 | 13F | Tucker Asset Management Llc | 0 | -100,00 | 0 | -100,00 | ||||
| 2026-02-10 | 13F | Spectrum Wealth Advisory Group, LLC | 293.462 | 444,89 | 6.626 | 432,21 | ||||
| 2026-02-03 | 13F | SBI Securities Co., Ltd. | 5.080 | -5,26 | 115 | -7,32 | ||||
| 2026-02-11 | 13F | LPL Financial LLC | 2.402.379 | 17,11 | 54.246 | 14,38 | ||||
| 2026-02-13 | 13F | Advyzon Investment Management, LLC | 72.726 | 4,06 | 1.642 | 1,67 | ||||
| 2026-01-26 | 13F | Merit Financial Group, LLC | 0 | -100,00 | 0 | |||||
| 2026-02-12 | 13F | Jane Street Group, Llc | 233.422 | -40,84 | 5.271 | -42,23 | ||||
| 2026-02-11 | 13F | Insight Advisors, LLC/ PA | 31.487 | -5,42 | 711 | -7,67 | ||||
| 2026-01-20 | 13F | Austin Private Wealth, LLC | 64.187 | 1.449 | ||||||
| 2026-01-22 | 13F | Richardson Financial Services Inc. | 4.057 | 824,15 | 94 | 615,38 | ||||
| 2026-01-30 | 13F | Sigma Planning Corp | 16.322 | 2,66 | 369 | 0,27 | ||||
| 2026-02-09 | 13F | Collaborative Wealth Managment Inc. | 105.888 | -30,20 | 2.391 | -31,85 | ||||
| 2026-01-15 | 13F | LifeGoal Wealth Advisors | 11.924 | 1,50 | 269 | -0,74 | ||||
| 2026-02-11 | 13F | J.w. Cole Advisors, Inc. | 79.842 | -4,28 | 36 | -98,18 | ||||
| 2026-01-26 | 13F | Private Trust Co Na | 7.829 | 2,23 | 177 | -0,56 | ||||
| 2026-01-28 | 13F | Milestone Asset Management, Llc | 37.382 | 844 | ||||||
| 2026-02-17 | 13F | Signature Equity Partners, LLC | 63 | 1 | ||||||
| 2026-02-05 | 13F | Passumpsic Savings Bank | 325.655 | -9,48 | 7.353 | -8,05 | ||||
| 2026-02-17 | 13F | Jones Financial Companies Lllp | 81.840 | 136,24 | 1.848 | 131,74 | ||||
| 2026-02-17 | 13F | Susquehanna International Group, Llp | 0 | -100,00 | 0 | |||||
| 2026-02-12 | 13F | Triumph Capital Management | 957 | -73,62 | 22 | -74,70 | ||||
| 2026-01-30 | 13F | Us Bancorp \de\ | 17 | 0 | ||||||
| 2026-02-09 | 13F | Keating Financial Advisory Services, Inc. | 18.720 | 423 | ||||||
| 2026-02-13 | 13F | Novus Advisors, Llc | 10.636 | 240 | ||||||
| 2026-02-13 | 13F | Wells Fargo & Company/mn | 492.984 | 1,17 | 11.132 | -1,19 | ||||
| 2026-02-13 | 13F | Landmark Wealth Management, Inc. | 38.560 | 871 | ||||||
| 2026-02-17 | 13F | Qube Research & Technologies Ltd | 631 | 181,70 | 14 | 180,00 | ||||
| 2026-02-06 | 13F | Global Retirement Partners, LLC | 2.203 | 9,88 | 50 | 6,52 | ||||
| 2026-01-13 | 13F | CoreCap Advisors, LLC | 7.501 | -15,20 | 169 | -17,16 | ||||
| 2026-01-16 | 13F | Aspire Private Capital, LLC | 51.442 | -71,11 | 1.162 | -71,11 | ||||
| 2026-01-14 | 13F | Eastern Bank | 95 | -56,82 | 2 | -60,00 | ||||
| 2025-10-30 | 13F | Outlook Wealth Advisors, LLC | 0 | -100,00 | 0 | |||||
| 2026-02-13 | 13F | Capstone Wealth Management Group, Llc | 70.361 | 30,58 | 1.589 | 27,55 | ||||
| 2026-01-15 | 13F | Rockland Trust Co | 1.824.180 | 7,47 | 41.190 | 4,96 | ||||
| 2026-02-17 | 13F | Private Advisor Group, LLC | 228.685 | 7,66 | 5.164 | 5,13 | ||||
| 2025-10-20 | 13F | Ascent Group, LLC | 0 | -100,00 | 0 | -100,00 | ||||
| 2026-02-04 | 13F | Fourth Dimension Wealth, LLC | 60.757 | 1,02 | 1.372 | -1,37 | ||||
| 2026-01-29 | 13F | Sanctuary Advisors, LLC | 49.257 | 1,86 | 1.112 | -0,45 | ||||
| 2026-01-23 | 13F | Farther Finance Advisors, LLC | 34.753 | 399,68 | 785 | 390,00 | ||||
| 2026-02-12 | 13F | Rossby Financial, LCC | 2 | 0 | ||||||
| 2026-02-12 | 13F | Federation des caisses Desjardins du Quebec | 76 | 0,00 | 2 | 0,00 | ||||
| 2025-10-28 | 13F | Csenge Advisory Group | 0 | -100,00 | 0 | |||||
| 2026-01-20 | 13F | AdvisorNet Financial, Inc | 1.000 | 0,00 | 23 | -4,35 | ||||
| 2026-02-18 | 13F | KKM Financial LLC | 34.150 | 6,77 | 771 | 4,33 | ||||
| 2026-02-09 | 13F | Huntington National Bank | 1 | |||||||
| 2026-02-02 | 13F | Truist Financial Corp | 0 | -100,00 | 0 | |||||
| 2026-02-17 | 13F | Harvest Investment Services, LLC | 0 | -100,00 | 0 | |||||
| 2026-01-27 | 13F | Novem Group | 57.458 | 9,33 | 1.297 | 6,75 | ||||
| 2026-02-18 | 13F | Vermillion & White Wealth Management Group, LLC | 45 | 0,00 | 1 | 0,00 | ||||
| 2026-02-06 | 13F | Larson Financial Group LLC | 94 | 2,17 | 2 | 0,00 | ||||
| 2026-02-04 | 13F | Advisor OS, LLC | 35.067 | 792 | ||||||
| 2026-02-12 | 13F | Commonwealth Equity Services, Llc | 17.600 | -22,32 | 397 | |||||
| 2026-02-13 | 13F | Change Path, LLC | 11.386 | 257 | ||||||
| 2026-02-13 | 13F | Goldstone Financial Group, LLC | 631.591 | 7,20 | 14.261 | 4,69 | ||||
| 2026-02-17 | 13F | Royal Bank Of Canada | 472.997 | 13,20 | 10.680 | 10,56 | ||||
| 2026-02-13 | 13F | Barclays Plc | 1 | 0,00 | 0 | |||||
| 2026-01-26 | 13F | Key Capital Management, INC | 1 | 0 | ||||||
| 2026-01-23 | 13F | Twelve Points Wealth Management LLC | 15.991 | 0,00 | 364 | -1,63 | ||||
| 2026-02-06 | 13F | HighTower Advisors, LLC | 28.746 | 649 | ||||||
| 2025-08-28 | NP | FISR - SPDR SSGA Fixed Income Sector Rotation ETF This fund is a listed as child fund of State Street Corp and if that institution has disclosed ownership in this security, then these positions will not be double counted when calculating total shares and total value | 2.039.540 | -2,28 | 46.032 | -2,28 | ||||
| 2026-01-23 | 13F | Assetmark, Inc | 221.120 | 231,88 | 4.993 | 224,16 | ||||
| 2026-02-13 | 13F | Ausdal Financial Partners, Inc. | 13.782 | 12,87 | 311 | 10,28 | ||||
| 2025-10-08 | 13F | VisionPoint Advisory Group, LLC | 0 | -100,00 | 0 | |||||
| 2026-01-23 | 13F/A | HF Advisory Group, LLC | 14.961 | 4,46 | 338 | 1,81 | ||||
| 2026-01-26 | 13F | AE Wealth Management LLC | 10.012 | 1.159,37 | 226 | 1.155,56 | ||||
| 2025-11-13 | 13F | Strategic Financial Concepts, LLC | 0 | -100,00 | 0 | -100,00 | ||||
| 2026-02-13 | 13F | Ally Invest Advisors Inc. | 39.622 | 8,23 | 895 | 5,67 | ||||
| 2026-02-17 | 13F | IHT Wealth Management, LLC | 18.955 | 2,19 | 428 | 0,00 | ||||
| 2026-02-13 | 13F | Morgan Stanley | 933.608 | -9,28 | 21.081 | -11,41 | ||||
| 2026-02-13 | 13F | Dow Chemical Co /de/ | 0 | -100,00 | 0 | |||||
| 2026-02-17 | 13F | Raymond James Financial Inc | 335.282 | 0,85 | 7.571 | -1,51 | ||||
| 2026-02-12 | 13F | CIBC Private Wealth Group, LLC | 51 | 218,75 | 1 | |||||
| 2025-08-28 | NP | GAL - SPDR SSGA Global Allocation ETF This fund is a listed as child fund of State Street Corp and if that institution has disclosed ownership in this security, then these positions will not be double counted when calculating total shares and total value | 405.905 | 7,84 | 9.161 | 7,84 | ||||
| 2026-02-17 | 13F | Fmr Llc | 593 | 530,85 | 13 | 550,00 | ||||
| 2026-02-05 | 13F | Cambridge Investment Research Advisors, Inc. | 320.752 | 1.320,58 | 7 | |||||
| 2025-11-13 | 13F | GeoWealth Management, LLC | 0 | -100,00 | 0 | -100,00 | ||||
| 2026-01-27 | 13F | Elevated Capital Advisors, LLC | 2.476 | 56 | ||||||
| 2026-02-05 | 13F | Thrivent Financial For Lutherans | 1.038.108 | 4,11 | 24 | 0,00 | ||||
| 2026-01-28 | 13F | N.E.W. Advisory Services LLC | 89 | 1,14 | 2 | 0,00 | ||||
| 2026-02-09 | 13F | Prospera Financial Services Inc | 57.299 | -2,31 | 1.294 | -4,57 | ||||
| 2026-02-18 | 13F | EP Wealth Advisors, Inc. | 0 | -100,00 | 0 | |||||
| 2026-01-28 | 13F | Geneos Wealth Management Inc. | 39.437 | 11,24 | 890 | 8,67 | ||||
| 2026-02-13 | 13F | Flow Traders U.s. Llc | 0 | -100,00 | 0 | |||||
| 2026-02-13 | 13F | Transamerica Financial Advisors, Inc. | 77 | 2 | ||||||
| 2026-02-10 | 13F | Bank of New York Mellon Corp | 339.482 | 6,46 | 7.665 | 3,97 | ||||
| 2026-02-17 | 13F | VestGen Advisors, LLC | 0 | -100,00 | 0 | |||||
| 2026-01-30 | 13F | Arrien Investments, Inc. | 369.153 | 4,58 | 8.335 | 2,14 | ||||
| 2025-11-07 | 13F | Synovus Financial Corp | 108.457 | -2,77 | 2.508 | -0,40 | ||||
| 2026-01-20 | 13F | White & Co Financial Planning Inc | 334.403 | -0,17 | 7.551 | -2,51 | ||||
| 2026-01-26 | 13F | Valmark Advisers, Inc. | 11.565 | 0,00 | 261 | -2,25 | ||||
| 2026-02-10 | 13F | Basepoint Wealth LLC | 56 | 1 | ||||||
| 2026-02-13 | 13F | Global Endowment Management, LP | 18.080 | 24,22 | 409 | 21,73 | ||||
| 2026-02-12 | 13F | Richard W. Paul & Associates, LLC | 1.671 | 373,37 | 38 | 362,50 | ||||
| 2026-02-06 | 13F | Creative Financial Designs Inc /adv | 7.366 | 78,40 | 166 | 74,74 | ||||
| 2026-02-03 | 13F | Van Strum & Towne Inc. | 266.938 | 11,18 | 6.027 | 8,59 | ||||
| 2026-02-17 | 13F | Advisory Services Network, LLC | 0 | -100,00 | 0 | |||||
| 2026-01-29 | 13F | Comerica Bank | 1.214 | 10,36 | 27 | 8,00 | ||||
| 2026-02-17 | 13F | Bank Of America Corp /de/ | 1.901.879 | 452,81 | 42.944 | 439,90 | ||||
| 2026-01-23 | 13F | Westside Investment Management, Inc. | 85.128 | 31,45 | 1.922 | 28,39 | ||||
| 2026-02-13 | 13F | National Bank Of Canada /fi/ | 2.571 | 0,00 | 58 | -1,69 | ||||
| 2026-02-10 | 13F | Envestnet Asset Management Inc | 1.008.023 | 42,27 | 22.761 | 38,95 | ||||
| 2026-02-13 | 13F | State Street Corp | 3.231.031 | 265,38 | 72.957 | 256,86 | ||||
| 2026-02-10 | 13F | Goldman Sachs Group Inc | 94.424 | -71,18 | 2.132 | -71,85 | ||||
| 2026-02-09 | 13F | Cary Street Partners Financial Llc | 102.296 | -1,62 | 2.310 | -3,95 | ||||
| 2026-01-21 | 13F | Flagship Harbor Advisors, Llc | 13.458 | 304 | ||||||
| 2026-02-17 | 13F | Hilltop Holdings Inc. | 42.496 | 960 | ||||||
| 2026-01-29 | 13F | Quest 10 Wealth Builders, Inc. | 14 | 0 | ||||||
| 2026-02-18 | 13F | Caitlin John, LLC | 190.077 | 164,78 | 4.292 | 158,65 | ||||
| 2026-02-11 | 13F | Gwn Securities Inc. | 35.552 | 8,70 | 803 | 5,94 | ||||
| 2026-02-06 | 13F | Pnc Financial Services Group, Inc. | 8.580 | 3,81 | 194 | 1,05 | ||||
| 2026-01-05 | 13F | City Center Advisors, LLC | 28.950 | 35,31 | 654 | 32,19 | ||||
| 2025-11-03 | 13F | Absolute Capital Management, LLC | 0 | -100,00 | 0 | |||||
| 2026-01-12 | 13F | Horizon Financial Services, Llc | 0 | 0 | ||||||
| 2026-02-17 | 13F | Minichmacgregor Wealth Management, Llc | 0 | -100,00 | 0 | |||||
| 2026-02-05 | 13F | Atria Investments Llc | 0 | -100,00 | 0 | |||||
| 2026-02-05 | 13F | RiverFront Investment Group, LLC | 15.560 | -21,00 | 351 | -22,86 | ||||
| 2026-02-13 | 13F | Graney & King, LLC | 360.328 | 74,93 | 8.136 | 70,85 | ||||
| 2026-02-17 | 13F | New England Asset Management Inc | 3.000 | 0,00 | 68 | -2,90 | ||||
| 2025-11-07 | 13F | Axxcess Wealth Management, Llc | 0 | -100,00 | 0 | |||||
| 2026-01-08 | 13F | Wealth Enhancement Advisory Services, Llc | 32.121 | -4,95 | 728 | -6,68 | ||||
| 2026-02-10 | 13F | Bnp Paribas Arbitrage, Sa | 2 | 0 | ||||||
| 2025-10-15 | 13F | Iams Wealth Management, Llc | 0 | -100,00 | 0 | |||||
| 2026-02-06 | 13F | Covestor Ltd | 23 | 0 | ||||||
| 2026-02-17 | 13F | Citadel Advisors Llc | 105.417 | 2.380 | ||||||
| 2026-02-12 | 13F | Principal Securities, Inc. | 159.929 | 9,84 | 3.611 | 7,28 | ||||
| 2026-02-14 | 13F | Rockefeller Capital Management L.P. | 48.602 | 10,25 | 1.097 | 7,65 | ||||
| 2026-01-21 | 13F | Newbridge Financial Services Group, Inc. | 3.269 | 1,74 | 74 | -1,35 | ||||
| 2025-11-04 | 13F | Heritage Wealth Management, Inc. | 0 | -100,00 | 0 | -100,00 | ||||
| 2026-02-09 | 13F | Harbour Investments, Inc. | 16.476 | 154,61 | 372 | 149,66 | ||||
| 2025-08-27 | NP | FFSAX - Touchstone Flexible Income Fund Class A | 0 | -100,00 | 0 | -100,00 | ||||
| 2026-02-05 | 13F | Park Square Financial Group, LLC | 0 | -100,00 | 0 | |||||
| 2025-11-12 | 13F | Transce3nd, LLC | 0 | -100,00 | 0 | |||||
| 2026-02-13 | 13F | Integrated Wealth Concepts LLC | 54.969 | 2,54 | 1.241 | 0,16 | ||||
| 2025-11-17 | 13F | Sterling Financial Group, Inc. | 9.207 | -98,90 | 213 | -98,88 | ||||
| 2026-02-11 | 13F | Ameritas Investment Partners, Inc. | 39.040 | 882 | ||||||
| 2026-02-11 | 13F | Entelevest, LLC | 25.745 | 581 | ||||||
| 2026-01-27 | 13F | PFG Advisors | 402.183 | 5,42 | 9.081 | 2,96 | ||||
| 2026-02-13 | 13F | Mariner, LLC | 22.054 | -52,86 | 498 | -54,02 | ||||
| 2026-02-11 | 13F | Buckingham Strategic Partners | 0 | -100,00 | 0 | |||||
| 2026-02-13 | 13F | MAI Capital Management | 5.075 | 0,00 | 115 | -2,56 | ||||
| 2026-01-14 | 13F | Waldron Private Wealth LLC | 10.000 | -18,70 | 226 | -20,77 | ||||
| 2026-02-12 | 13F | Steward Partners Investment Advisory, Llc | 856 | 19 |
Other Listings
| US:SPLB | $23,06 |