Temel İstatistikler
| Kurumsal Hisseler (Uzun) | 137.533.657 - 40,99% (ex 13D/G) - change of 5,24MM shares 3,96% MRQ |
| Kurumsal Değer (Uzun) | $ 1.009.171 USD ($1000) |
Kurumsal Mülkiyet ve Hissedarlar
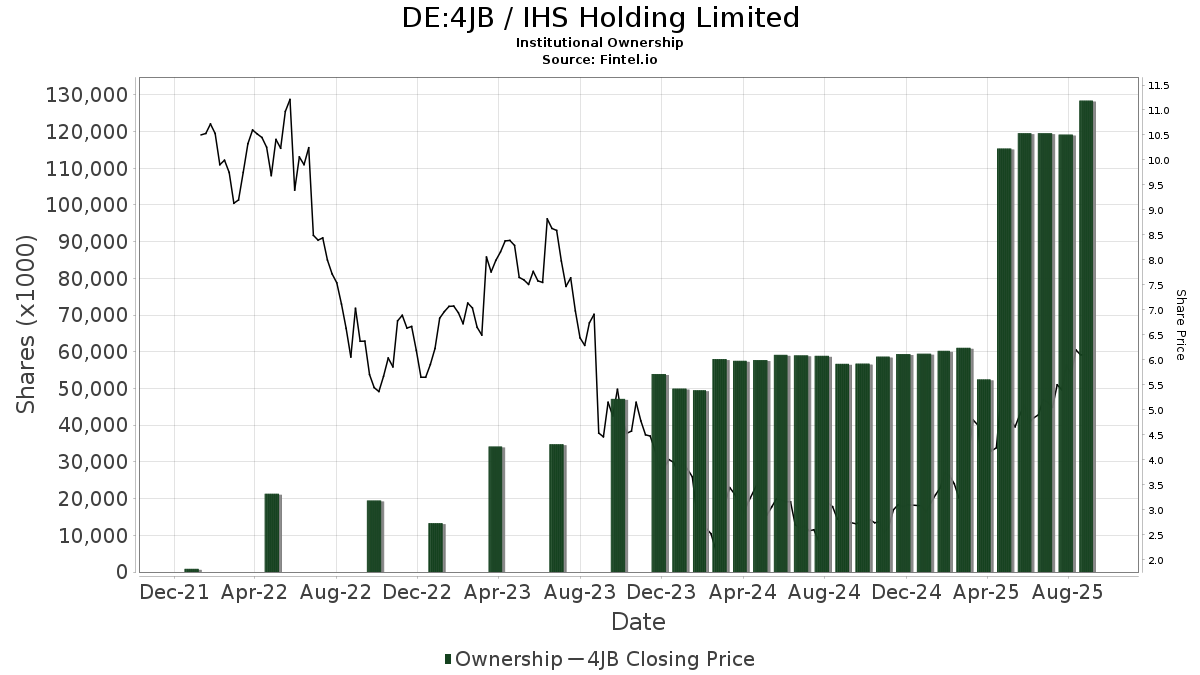
IHS Holding Limited (DE:4JB) var 130 Menkul Kıymetler Borsası Komisyonuna (SEC) 13D/G veya 13F formları dolduran kurumsal sahipler ve hissedarlar. Bu kurumların toplam 137,533,657 hissesi bulunmaktadır. En büyük hissedarlar arasındakiler: Wendel SE, Korea Investment CORP, Helikon Investments Ltd, Quaker Capital Investments, LLC, Millennium Management Llc, Jpmorgan Chase & Co, Bnp Paribas Arbitrage, Sa, Siren, L.L.C., Morgan Stanley, and Standard Life Aberdeen plc .
IHS Holding Limited (DB:4JB) kurumsal mülkiyet yapısı, kurum ve fonlara göre şirketteki mevcut pozisyonların yanı sıra pozisyon büyüklüğündeki son değişiklikleri gösterir. Büyük hissedarlar bireysel yatırımcıları, yatırım fonlarını, hedge fonlarını veya kurumları içerebilir. Çizelge 13D, yatırımcının şirketin %5inden fazlasını elinde bulundurduğunu (veya elinde önceden bulundurduğunu) ve iş stratejisinde aktif olarak bir değişiklik yapmayı planladığını (veya önceden planladığını) gösterir. Çizelge 13G, %5in üzerinde pasif yatırımı gösterir.
The share price as of April 17, 2026 is 6,85 / share. Previously, on April 22, 2025, the share price was 4,14 / share. This represents an increase of 65,46% over that period.
Fon Eğilim Skoru
Fon Eğilim Skoru (diğer adıyla Sahiplik Birikimi Skoru), fonlar tarafından en çok satın alınan hisse senetlerini bulur. En yüksek düzeyde kurumsal birikime sahip şirketleri tanımlayan karmaşık, çok faktörlü kantitatif bir modelin sonucudur. Skorlama modeli, açıklanan sahiplerdeki toplam artışın, bu sahiplerdeki portföy dağıtımındaki değişikliklerin ve diğer ölçümlerin bir kombinasyonunu kullanır. Sayı 0dan 100e kadar değişir; daha yüksek sayılar emsallerine göre daha yüksek bir birikim düzeyine işaret eder ve 50 ortalamadır.
Güncelleme Sıklığı: Günlük
En üst düzey şirketlerin listesini sağlayan Sahiplik Gezginine bakın.
AI+ Ask Fintel’s AI assistant about IHS Holding Limited.
Select a question to share a public post with an AI-crafted answer.
Thinking of good questions…
13F ve NPORT Başvuruları
13F başvurularına ilişkin ayrıntılar ücretsizdir. NP başvurularına ilişkin ayrıntılar premium üyelik gerektirir. Yeşil satırlar yeni pozisyonları gösterir. Kırmızı satırlar kapalı pozisyonları gösterir. Tam işlem geçmişini görmek için linkesimgesine tıklayınız.
Yükseltin
premium verilerin kilidini açmak ve Excele aktarmak için ![]() .
.
| Dosya Tarihi | Kaynak | Yatırımcı | Tür | Ortalama Fiyat (Tahmin) |
Hisseler | Δ Hisseler (%) |
Bildirilen Değer (1000$) |
Δ Değer (%) |
Bağlantı Noktası Dağıtımı (%) |
|
|---|---|---|---|---|---|---|---|---|---|---|
| 2026-02-18 | 13F | Mackenzie Financial Corp | 73.106 | 154,36 | 545 | 178,06 | ||||
| 2026-02-11 | 13F | Simplex Trading, Llc | 7.387 | 420,58 | 55 | |||||
| 2025-11-19 | 13F | Caitong International Asset Management Co., Ltd | 0 | -100,00 | 0 | |||||
| 2026-02-11 | 13F | Group One Trading, L.p. | 10.197 | -43,14 | 76 | -37,70 | ||||
| 2026-04-20 | 13F | Ritholtz Wealth Management | 141.684 | 463,33 | 1.166 | 523,53 | ||||
| 2026-02-13 | 13F | Quaker Capital Investments, LLC | 4.683.904 | 7,20 | 34.942 | 17,26 | ||||
| 2026-02-05 | 13F | Helikon Investments Ltd | 8.780.288 | 81,20 | 65.501 | 98,21 | ||||
| 2026-02-03 | 13F | Generali Asset Management SPA SGR | 180.000 | 0,00 | 1.343 | 9,37 | ||||
| 2026-02-05 | 13F | Pinnacle Associates Ltd | 57.800 | -13,54 | 431 | -5,27 | ||||
| 2026-02-17 | 13F | Lazard Asset Management Llc | 258.624 | 1.929 | ||||||
| 2026-02-17 | 13F | PDT Partners, LLC | 155.443 | 0,00 | 1.160 | 9,34 | ||||
| 2026-02-17 | 13F | D. E. Shaw & Co., Inc. | 430.032 | 7,27 | 3.208 | 17,34 | ||||
| 2026-02-17 | 13F | Trexquant Investment LP | 0 | -100,00 | 0 | |||||
| 2026-02-17 | 13F | Engineers Gate Manager LP | 171.689 | -8,33 | 1.281 | 0,23 | ||||
| 2025-11-06 | 13F | Stratos Wealth Advisors, LLC | 0 | -100,00 | 0 | |||||
| 2026-01-28 | 13F | Kingswood Wealth Advisors, Llc | 35.287 | -59,26 | 263 | -55,42 | ||||
| 2026-02-17 | 13F | Numerai GP LLC | 124.278 | 57,94 | 927 | 72,95 | ||||
| 2026-02-17 | 13F | Principal Street Partners, LLC | 12.951 | -6,19 | 97 | 2,13 | ||||
| 2026-02-10 | 13F | Bnp Paribas Arbitrage, Sa | 2.540.472 | 1,70 | 18.952 | 11,23 | ||||
| 2026-02-11 | 13F | Winton Capital Group Ltd | 25.641 | -26,85 | 191 | -20,08 | ||||
| 2026-02-13 | 13F | Morgan Stanley | 2.347.611 | 12,20 | 17.513 | 22,73 | ||||
| 2026-02-13 | 13F | State Street Corp | 16.600 | 124 | ||||||
| 2026-02-18 | 13F | GWM Advisors LLC | 18.672 | 1.228,97 | 139 | 1.444,44 | ||||
| 2026-02-17 | 13F | Northern Trust Corp | 106.624 | 795 | ||||||
| 2026-02-17 | 13F | Petrus Trust Company, LTA | 0 | -100,00 | 0 | |||||
| 2026-04-15 | 13F | Merit Financial Group, LLC | 14.229 | -1,35 | 117 | 9,35 | ||||
| 2026-02-10 | 13F | Acadian Asset Management Llc | 1.404.095 | 19,13 | 10 | 25,00 | ||||
| 2026-02-17 | 13F | XTX Topco Ltd | 57.472 | 61,74 | 429 | 76,86 | ||||
| 2026-02-13 | 13F | Smartleaf Asset Management LLC | 4.063 | 30 | ||||||
| 2026-02-17 | 13F | BTG Pactual Asset Management US LLC | 578.278 | 24,49 | 4.314 | 36,19 | ||||
| 2026-02-11 | 13F | Janney Montgomery Scott LLC | 0 | -100,00 | 0 | |||||
| 2026-01-20 | 13F | Ascent Group, LLC | 18.941 | -3,13 | 141 | 6,02 | ||||
| 2026-02-10 | 13F | Globeflex Capital L P | 283 | 2 | ||||||
| 2026-02-13 | 13F | Pathstone Holdings, LLC | 253.039 | -34,31 | 1.888 | -28,17 | ||||
| 2026-02-17 | 13F | Advisor Group Holdings, Inc. | 4.884 | 14,54 | 36 | 24,14 | ||||
| 2026-02-17 | 13F | Millennium Management Llc | 3.511.989 | -4,91 | 26.199 | 4,02 | ||||
| 2026-02-11 | 13F | Fox Run Management, L.l.c. | 43.698 | -43,15 | 326 | -37,98 | ||||
| 2026-02-13 | 13F | Walleye Capital LLC | 0 | -100,00 | 0 | -100,00 | ||||
| 2026-02-13 | 13F | Toroso Investments, LLC | 22.583 | -3,61 | 168 | 5,66 | ||||
| 2026-02-06 | 13F | Larson Financial Group LLC | 975 | 261,11 | 7 | 600,00 | ||||
| 2026-02-17 | 13F | Balyasny Asset Management Llc | 14.303 | -1,42 | 107 | 8,16 | ||||
| 2026-02-13 | 13F | Wexford Capital Lp | 498.112 | 100,08 | 3.716 | 118,92 | ||||
| 2026-02-13 | 13F | Centiva Capital, LP | 0 | -100,00 | 0 | |||||
| 2026-02-09 | 13F | Blue Bell Private Wealth Management, Llc | 0 | -100,00 | 0 | |||||
| 2026-02-13 | 13F | Marshall Wace, Llp | 1.050.722 | -29,53 | 7.838 | -22,92 | ||||
| 2026-02-17 | 13F | CWM Advisors, LLC | 171.315 | 1.278 | ||||||
| 2026-02-03 | 13F | Legacy Wealth Managment, LLC/ID | 274 | 0,00 | 2 | 100,00 | ||||
| 2026-02-17 | 13F | Voleon Capital Management Lp | 63.512 | -21,92 | 474 | -14,62 | ||||
| 2026-02-17 | 13F | Bank Of America Corp /de/ | 1.421.943 | 588,00 | 10.608 | 652,80 | ||||
| 2026-02-17 | 13F | Hollow Brook Wealth Management LLC | 333.745 | -10,26 | 2.490 | -1,85 | ||||
| 2026-02-05 | 13F | HighMark Wealth Management LLC | 0 | -100,00 | 0 | |||||
| 2026-02-17 | 13F | Prelude Capital Management, Llc | 0 | -100,00 | 0 | |||||
| 2026-02-17 | 13F | Schonfeld Strategic Advisors LLC | 52.652 | 182,65 | 393 | 208,66 | ||||
| 2026-02-13 | 13F | Entropy Technologies, LP | 28.042 | 94,04 | 209 | 113,27 | ||||
| 2026-02-19 | 13F | CI Private Wealth, LLC | 45.000 | 0,00 | 336 | 9,48 | ||||
| 2025-11-14 | 13F | Tower Research Capital LLC (TRC) | 0 | -100,00 | 0 | |||||
| 2026-01-23 | 13F | Assetmark, Inc | 59 | 0,00 | 0 | |||||
| 2026-02-02 | 13F | Truist Financial Corp | 25.706 | 38,53 | 192 | 51,59 | ||||
| 2026-02-18 | 13F/A | Empowered Funds, LLC | 313.279 | 2.337 | ||||||
| 2026-02-24 | 13F | DGS Capital Management, LLC | 13.571 | 101 | ||||||
| 2026-02-17 | 13F | Man Group plc | 61.357 | -12,09 | 458 | -3,79 | ||||
| 2025-11-14 | 13F | Wellington Management Group Llp | 0 | -100,00 | 0 | |||||
| 2026-02-13 | 13F | Squarepoint Ops LLC | 180.433 | 8,17 | 1.346 | 18,38 | ||||
| 2026-02-17 | 13F | Qube Research & Technologies Ltd | 389.034 | 46,65 | 2.902 | 60,42 | ||||
| 2026-04-15 | 13F | Exchange Traded Concepts, Llc | 0 | -100,00 | 0 | |||||
| 2026-02-17 | 13F | Aquatic Capital Management LLC | 28.687 | -26,79 | 214 | -19,85 | ||||
| 2026-02-17 | 13F | Summit Trail Advisors, Llc | 11.680 | 0,00 | 87 | 10,13 | ||||
| 2026-02-13 | 13F | Diametric Capital, LP | 0 | -100,00 | 0 | |||||
| 2026-02-12 | 13F | Hrt Financial Lp | 306.865 | -15,30 | 2 | 0,00 | ||||
| 2026-02-06 | 13F | HighTower Advisors, LLC | 12.951 | -7,73 | 97 | 1,05 | ||||
| 2026-02-17 | 13F | Tudor Investment Corp Et Al | Call | 15.400 | 0,00 | 115 | 8,57 | |||
| 2025-11-14 | 13F | Cubist Systematic Strategies, LLC | 170.120 | -13,00 | 1.160 | 6,72 | ||||
| 2026-02-17 | 13F | Tudor Investment Corp Et Al | 244.370 | 0,00 | 1.823 | 9,42 | ||||
| 2026-02-03 | 13F | SBI Securities Co., Ltd. | 3 | 0,00 | 0 | |||||
| 2026-02-12 | 13F | Renaissance Technologies Llc | 1.401.300 | 20,68 | 10.454 | 32,00 | ||||
| 2026-02-17 | 13F | Graham Capital Management, L.P. | 29.392 | -16,63 | 219 | -8,75 | ||||
| 2026-02-11 | 13F | Allianz Asset Management GmbH | 249.102 | 56,79 | 1.858 | 71,56 | ||||
| 2026-02-19 | 13F | Mcguire Capital Advisors Inc | 3.559 | 27 | ||||||
| 2026-02-13 | 13F | Verition Fund Management LLC | 49.395 | 0,00 | 368 | 9,52 | ||||
| 2026-02-06 | 13F | Gsa Capital Partners Llp | 374.362 | 41,88 | 3 | 100,00 | ||||
| 2026-02-17 | 13F | Sona Asset Management (us) Llc | 1.552.674 | -13,87 | 11.583 | -5,79 | ||||
| 2025-11-05 | 13F | Envestnet Asset Management Inc | 0 | -100,00 | 0 | |||||
| 2026-02-13 | 13F | L2 Asset Management, LLC | 12.067 | 90 | ||||||
| 2026-02-10 | 13F | Goldman Sachs Group Inc | 421.009 | 53,93 | 3.141 | 68,36 | ||||
| 2026-02-13 | 13F | Mariner, LLC | 18.475 | -24,40 | 138 | -17,47 | ||||
| 2026-02-17 | 13F | Creative Planning | 10.890 | 0,12 | 81 | 9,46 | ||||
| 2026-02-17 | 13F | Point72 Asset Management, L.P. | 185.726 | -44,72 | 1.386 | -39,55 | ||||
| 2026-02-17 | 13F | Raymond James Financial Inc | 26.770 | -20,73 | 200 | -13,48 | ||||
| 2026-01-28 | 13F | Geneos Wealth Management Inc. | 405 | 0,00 | 3 | 50,00 | ||||
| 2026-02-09 | 13F | King Wealth | 14.710 | 0 | ||||||
| 2026-04-07 | 13F | Farther Finance Advisors, LLC | 22.782 | -84,95 | 188 | -83,42 | ||||
| 2026-02-17 | 13F | Shelton Capital Management | 24.049 | 0,00 | 179 | 9,15 | ||||
| 2025-11-14 | 13F | Virtu Financial LLC | 0 | -100,00 | 0 | |||||
| 2026-01-23 | 13F | Armbruster Capital Management, Inc. | 140.347 | -6,65 | 1.047 | 2,05 | ||||
| 2026-02-10 | 13F | Dumac, Inc. | 112.000 | 0,00 | 836 | 34,24 | ||||
| 2026-01-16 | 13F | Standard Life Aberdeen plc | 2.232.200 | -6,50 | 16.652 | 4,42 | ||||
| 2026-02-17 | 13F | Russell Investments Group, Ltd. | 2.606 | -5,58 | 19 | 5,56 | ||||
| 2026-02-12 | 13F | Brinker Capital Investments, LLC | 65.928 | 12,75 | 492 | 23,37 | ||||
| 2026-02-17 | 13F | Citadel Advisors Llc | Call | 57.700 | 143,46 | 430 | 167,08 | |||
| 2026-01-30 | 13F | State of New Jersey Common Pension Fund D | 38.885 | 0,00 | 290 | 9,43 | ||||
| 2026-02-17 | 13F | Citadel Advisors Llc | 714.462 | -12,73 | 5.330 | -4,55 | ||||
| 2026-02-19 | 13F | Invesco Ltd. | 79.339 | -5,45 | 592 | 3,32 | ||||
| 2026-01-29 | 13F | UBS Group AG | 355.575 | 16,07 | 2.653 | 26,95 | ||||
| 2026-02-13 | 13F | Mml Investors Services, Llc | 12.042 | 90 | ||||||
| 2026-02-18 | 13F | State of Tennessee, Treasury Department | 22.438 | 0,00 | 179 | 16,99 | ||||
| 2026-02-17 | 13F | Jump Financial, LLC | 137.537 | -20,59 | 1.026 | -13,12 | ||||
| 2026-02-13 | 13F | Korea Investment CORP | 21.666.802 | 0,00 | 161.634 | 9,38 | ||||
| 2025-11-14 | 13F | Aqr Capital Management Llc | 0 | -100,00 | 0 | |||||
| 2026-02-17 | 13F | Susquehanna Portfolio Strategies, LLC | 87.728 | 0,00 | 654 | 9,36 | ||||
| 2025-10-27 | 13F | Versant Capital Management, Inc | 0 | -100,00 | 0 | |||||
| 2026-04-16 | 13F | SG Americas Securities, LLC | 64.282 | 1 | ||||||
| 2026-04-14 | 13F | Drive Wealth Management, Llc | 22.851 | -0,58 | 188 | 9,94 | ||||
| 2025-11-14 | 13F | Dark Forest Capital Management Lp | 120.198 | 0,00 | 668 | 0,00 | ||||
| 2026-02-17 | 13F | Citadel Advisors Llc | Put | 28.300 | -15,52 | 211 | -7,46 | |||
| 2026-02-10 | 13F | Savant Capital, LLC | 18.551 | -23,45 | 138 | -16,36 | ||||
| 2026-02-13 | 13F | Y-Intercept (Hong Kong) Ltd | 186.917 | 155,09 | 1.394 | 179,36 | ||||
| 2026-02-17 | 13F | Greenland Capital Management LP | 157.500 | -39,38 | 1.175 | -33,71 | ||||
| 2026-02-17 | 13F | Magnetar Financial LLC | 59.091 | 61,92 | 441 | 77,42 | ||||
| 2026-02-13 | 13F | Citigroup Inc | 20.393 | -29,66 | 152 | -22,84 | ||||
| 2025-11-14 | 13F | Price T Rowe Associates Inc /md/ | 0 | -100,00 | 0 | |||||
| 2025-11-14 | 13F | ExodusPoint Capital Management, LP | 0 | -100,00 | 0 | |||||
| 2026-01-20 | 13F | Quintet Private Bank (Europe) S.A. | 1.600 | -33,33 | 12 | -31,25 | ||||
| 2026-02-11 | 13F | O'shaughnessy Asset Management, Llc | 112.155 | 837 | ||||||
| 2026-02-17 | 13F | Occudo Quantitative Strategies Lp | 49.523 | 369 | ||||||
| 2026-02-17 | 13F | Two Sigma Advisers, Lp | 1.008.100 | 11,34 | 7.520 | 21,80 | ||||
| 2026-04-15 | 13F | Milestone Asset Management, Llc | 21.000 | 0,00 | 173 | 10,26 | ||||
| 2026-02-17 | 13F | Jain Global LLC | 0 | -100,00 | 0 | |||||
| 2026-02-06 | 13F | Wendel SE | 62.975.396 | 0,00 | 469.796 | 9,38 | ||||
| 2026-03-31 | 13F/A | Barclays Plc | 0 | -100,00 | 0 | |||||
| 2026-02-10 | 13F | State of Wyoming | 4.868 | -90,25 | 36 | -89,41 | ||||
| 2026-02-17 | 13F | PharVision Advisers, LLC | 29.817 | 5,35 | 222 | 15,03 | ||||
| 2026-02-12 | 13F | Jane Street Group, Llc | 165.852 | -38,25 | 1.237 | -32,44 | ||||
| 2026-02-12 | 13F | CIBC Private Wealth Group, LLC | 1.137 | -31,67 | 8 | -27,27 | ||||
| 2026-02-12 | 13F | Jane Street Group, Llc | Call | 11.100 | -44,22 | 83 | -39,26 | |||
| 2026-02-12 | 13F | Campbell & CO Investment Adviser LLC | 51.402 | -29,62 | 383 | -23,09 | ||||
| 2026-01-26 | 13F | Cwm, Llc | 75.000 | 0,00 | 1 | |||||
| 2026-02-17 | 13F | Keebeck Alpha, LP | 0 | -100,00 | 0 | |||||
| 2026-04-20 | 13F | CWA Asset Management Group, LLC | 91.867 | 756 | ||||||
| 2026-02-13 | 13F | Siren, L.L.C. | 2.357.520 | 0,00 | 17.587 | 9,39 | ||||
| 2026-02-17 | 13F | Mangrove Partners | 24.214 | 181 | ||||||
| 2026-04-16 | 13F | Allegheny Financial Group LTD | 0 | -100,00 | 0 | |||||
| 2026-02-10 | 13F | Root Financial Partners, LLC | 4 | 0 | ||||||
| 2026-02-17 | 13F | Susquehanna International Group, Llp | Call | 35.700 | -16,39 | 266 | -8,59 | |||
| 2026-02-13 | 13F | Inspire Advisors, LLC | 0 | -100,00 | 0 | |||||
| 2026-02-13 | 13F | Quarry LP | 2.012 | -57,23 | 15 | -53,12 | ||||
| 2026-02-17 | 13F | Susquehanna International Group, Llp | 44.033 | -62,22 | 328 | -58,69 | ||||
| 2026-02-13 | 13F | Charles Schwab Investment Management Inc | 1.336.805 | 29,82 | 9.973 | 42,01 | ||||
| 2025-11-14 | 13F | Susquehanna International Group, Llp | Put | 0 | -100,00 | 0 | -100,00 | |||
| 2026-01-14 | 13F | Spire Wealth Management | 2.445 | 666,46 | 18 | 800,00 | ||||
| 2026-02-13 | 13F | Sei Investments Co | 25.834 | 193 | ||||||
| 2026-02-12 | 13F | Counterpoint Mutual Funds LLC | 33.573 | -55,47 | 250 | -51,36 | ||||
| 2026-02-17 | 13F | Two Sigma Investments, Lp | 1.051.717 | -0,34 | 7.846 | 9,00 | ||||
| 2026-02-17 | 13F | Susquehanna Fundamental Investments, Llc | 10.363 | -71,77 | 77 | -69,20 | ||||
| 2026-02-17 | 13F | Royal Bank Of Canada | 1.751 | -57,63 | 13 | -53,57 | ||||
| 2026-02-12 | 13F | BlackRock, Inc. | 365.371 | 5,43 | 2.726 | 15,32 | ||||
| 2026-02-11 | 13F | Jpmorgan Chase & Co | 3.321.835 | 0,65 | 24.781 | 10,09 | ||||
| 2026-02-13 | 13F | Arrowstreet Capital, Limited Partnership | 1.817.859 | 16,73 | 13.561 | 27,69 | ||||
| 2026-02-17 | 13F | Morgan Creek Capital Management, LLC | 154.963 | 1.156 | ||||||
| 2026-02-13 | 13F | Wells Fargo & Company/mn | 20.477 | 0,00 | 153 | 9,35 | ||||
| 2026-02-02 | 13F | Hussman Strategic Advisors, Inc. | 105.000 | 783 | ||||||
| 2026-02-10 | 13F | Quantbot Technologies LP | 25.271 | -41,95 | 189 | -36,49 |
Other Listings
| US:IHS | $8,25 |