Temel İstatistikler
| Kurumsal Hisseler (Uzun) | 11.716.853 - 84,56% (ex 13D/G) - change of -1,01MM shares -7,93% MRQ |
| Kurumsal Değer (Uzun) | $ 607.159 USD ($1000) |
Kurumsal Mülkiyet ve Hissedarlar
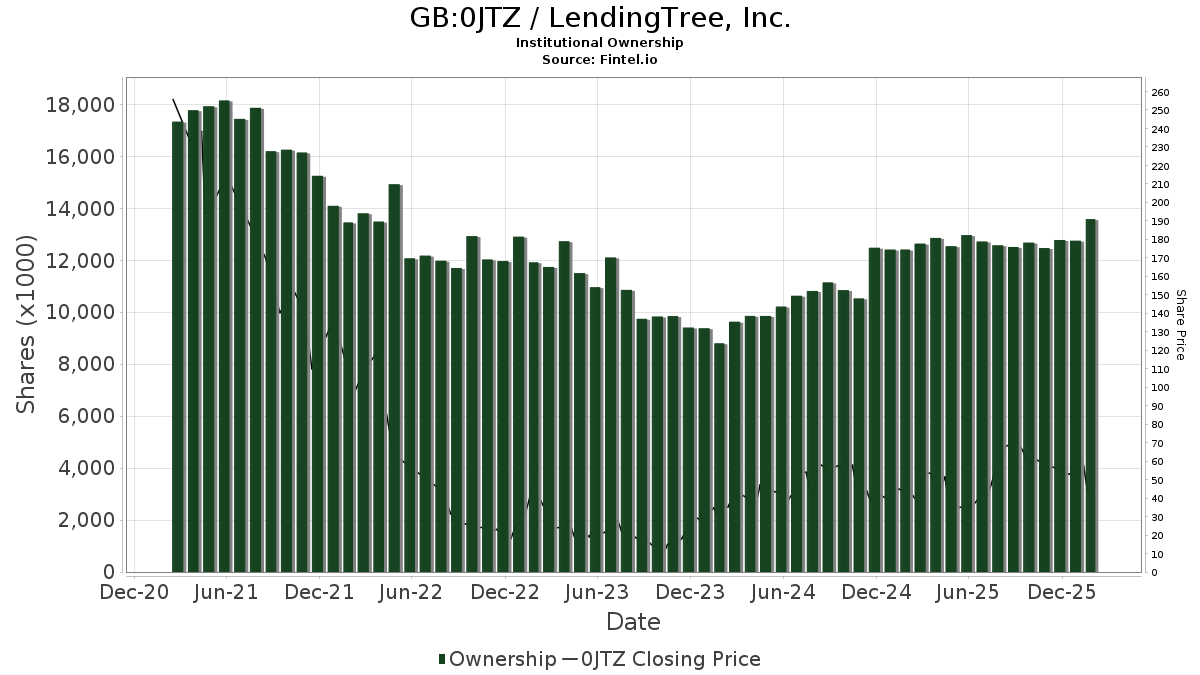
LendingTree, Inc. (GB:0JTZ) var 193 Menkul Kıymetler Borsası Komisyonuna (SEC) 13D/G veya 13F formları dolduran kurumsal sahipler ve hissedarlar. Bu kurumların toplam 11,716,853 hissesi bulunmaktadır. En büyük hissedarlar arasındakiler: Mariner, LLC, BlackRock, Inc., Vanguard Group Inc, Jennison Associates Llc, Blue Grotto Capital, LLC, Ameriprise Financial Inc, Punch & Associates Investment Management, Inc., Emerald Advisers, Llc, Jacobs Levy Equity Management, Inc, and Renaissance Technologies Llc .
LendingTree, Inc. (LSE:0JTZ) kurumsal mülkiyet yapısı, kurum ve fonlara göre şirketteki mevcut pozisyonların yanı sıra pozisyon büyüklüğündeki son değişiklikleri gösterir. Büyük hissedarlar bireysel yatırımcıları, yatırım fonlarını, hedge fonlarını veya kurumları içerebilir. Çizelge 13D, yatırımcının şirketin %5inden fazlasını elinde bulundurduğunu (veya elinde önceden bulundurduğunu) ve iş stratejisinde aktif olarak bir değişiklik yapmayı planladığını (veya önceden planladığını) gösterir. Çizelge 13G, %5in üzerinde pasif yatırımı gösterir.
The share price as of April 16, 2026 is 46,41 / share. Previously, on April 17, 2025, the share price was 45,42 / share. This represents an increase of 2,18% over that period.
Fon Eğilim Skoru
Fon Eğilim Skoru (diğer adıyla Sahiplik Birikimi Skoru), fonlar tarafından en çok satın alınan hisse senetlerini bulur. En yüksek düzeyde kurumsal birikime sahip şirketleri tanımlayan karmaşık, çok faktörlü kantitatif bir modelin sonucudur. Skorlama modeli, açıklanan sahiplerdeki toplam artışın, bu sahiplerdeki portföy dağıtımındaki değişikliklerin ve diğer ölçümlerin bir kombinasyonunu kullanır. Sayı 0dan 100e kadar değişir; daha yüksek sayılar emsallerine göre daha yüksek bir birikim düzeyine işaret eder ve 50 ortalamadır.
Güncelleme Sıklığı: Günlük
En üst düzey şirketlerin listesini sağlayan Sahiplik Gezginine bakın.
AI+ Ask Fintel’s AI assistant about LendingTree, Inc..
Select a question to share a public post with an AI-crafted answer.
Thinking of good questions…
13F ve NPORT Başvuruları
13F başvurularına ilişkin ayrıntılar ücretsizdir. NP başvurularına ilişkin ayrıntılar premium üyelik gerektirir. Yeşil satırlar yeni pozisyonları gösterir. Kırmızı satırlar kapalı pozisyonları gösterir. Tam işlem geçmişini görmek için linkesimgesine tıklayınız.
Yükseltin
premium verilerin kilidini açmak ve Excele aktarmak için ![]() .
.
| Dosya Tarihi | Kaynak | Yatırımcı | Tür | Ortalama Fiyat (Tahmin) |
Hisseler | Δ Hisseler (%) |
Bildirilen Değer (1000$) |
Δ Değer (%) |
Bağlantı Noktası Dağıtımı (%) |
|
|---|---|---|---|---|---|---|---|---|---|---|
| 2026-02-10 | 13F | Intech Investment Management Llc | 4.282 | -11,07 | 227 | -27,01 | ||||
| 2026-02-12 | 13F | Jane Street Group, Llc | Put | 54.600 | -23,21 | 2.899 | -37,03 | |||
| 2026-02-17 | 13F | XTX Topco Ltd | 0 | -100,00 | 0 | -100,00 | ||||
| 2026-02-12 | 13F | Jane Street Group, Llc | Call | 75.700 | -28,11 | 4.019 | -41,05 | |||
| 2026-02-11 | 13F | Simplex Trading, Llc | Put | 300 | -99,10 | 16 | 650,00 | |||
| 2026-02-11 | 13F | Simplex Trading, Llc | Call | 2.800 | -53,33 | 149 | ||||
| 2026-02-17 | 13F | Raymond James Financial Inc | 37.334 | 2,79 | 1.982 | -15,70 | ||||
| 2026-02-09 | 13F | Legal & General Group Plc | 9.226 | -23,31 | 490 | -37,15 | ||||
| 2026-02-12 | 13F | State Board Of Administration Of Florida Retirement System | 0 | -100,00 | 0 | |||||
| 2026-02-17 | 13F | Two Sigma Advisers, Lp | 39.700 | -11,58 | 2.108 | -27,49 | ||||
| 2026-02-14 | 13F | Rockefeller Capital Management L.P. | 39 | 2 | ||||||
| 2026-04-07 | 13F | Farther Finance Advisors, LLC | 277 | -50,62 | 12 | -62,07 | ||||
| 2026-02-19 | 13F | Invesco Ltd. | 35.209 | -21,46 | 1.869 | -35,57 | ||||
| 2026-02-11 | 13F | Simplex Trading, Llc | 0 | -100,00 | 0 | |||||
| 2026-04-09 | 13F | Moody National Bank Trust Division | 7.000 | 300 | ||||||
| 2026-02-12 | 13F | Scotia Capital Inc. | 0 | -100,00 | 0 | |||||
| 2026-01-26 | 13F | Cwm, Llc | 1.864 | 4,25 | 0 | |||||
| 2026-02-17 | 13F | Quadrature Capital Ltd | 0 | -100,00 | 0 | |||||
| 2026-02-17 | 13F | Balyasny Asset Management Llc | 29.394 | 1.561 | ||||||
| 2026-02-17 | 13F | G2 Investment Partners Management LLC | 92.467 | -50,41 | 4.909 | -59,33 | ||||
| 2026-02-17 | 13F | Creative Planning | 7.178 | 11,29 | 381 | -8,63 | ||||
| 2026-01-23 | 13F | Private Wealth Management Group, LLC | 104 | 0,00 | 6 | -16,67 | ||||
| 2026-02-11 | 13F | Los Angeles Capital Management Llc | 33.348 | 6,84 | 2.142 | 5,99 | ||||
| 2026-02-13 | 13F | Citigroup Inc | 8.060 | 69,15 | 428 | 38,64 | ||||
| 2026-02-17 | 13F | Janus Henderson Group Plc | 4.600 | 0,00 | 244 | -18,12 | ||||
| 2026-01-30 | 13F | Us Bancorp \de\ | 14 | 0,00 | 1 | |||||
| 2026-02-17 | 13F | Jones Financial Companies Lllp | 655 | -5,76 | 35 | -30,61 | ||||
| 2026-02-13 | 13F | Jacobs Levy Equity Management, Inc | 308.114 | -2,44 | 16.358 | -19,99 | ||||
| 2026-01-29 | 13F | Vanguard Group Inc | 704.686 | 3,53 | 37.412 | -15,09 | ||||
| 2026-02-12 | 13F | Federated Hermes, Inc. | 169.982 | 17,03 | 9.024 | -4,01 | ||||
| 2026-02-13 | 13F | Quinn Opportunity Partners LLC | 6.263 | -19,72 | 333 | -34,13 | ||||
| 2026-02-04 | 13F | Clark Wealth Partners | 0 | -100,00 | 0 | |||||
| 2026-02-06 | 13F | Legato Capital Management LLC | 8.587 | 456 | ||||||
| 2026-01-26 | 13F | Whittier Trust Co Of Nevada Inc | 1 | 0,00 | 0 | |||||
| 2026-02-13 | 13F | MAI Capital Management | 2 | 0 | ||||||
| 2026-02-10 | 13F | Rothschild Investment Llc | 10 | 0,00 | 1 | |||||
| 2026-02-10 | 13F | Connor, Clark & Lunn Investment Management Ltd. | 0 | -100,00 | 0 | |||||
| 2026-02-17 | 13F | EFG International AG | 17.180 | 911 | ||||||
| 2026-02-17 | 13F | Canada Pension Plan Investment Board | 3.800 | 202 | ||||||
| 2026-02-13 | 13F | Arrowstreet Capital, Limited Partnership | 205.900 | -21,96 | 10.931 | -35,99 | ||||
| 2026-02-17 | 13F | Polymer Capital Management (US) LLC | 0 | -100,00 | 0 | |||||
| 2026-02-12 | 13F | RPg Family Wealth Advisory, LLC | 90.757 | -0,40 | 4.818 | -18,31 | ||||
| 2026-01-27 | 13F | Asset Management One Co., Ltd. | 1.610 | -5,01 | 87 | -20,18 | ||||
| 2026-02-17 | 13F | Millennium Management Llc | 16.419 | -94,53 | 872 | -95,51 | ||||
| 2026-01-16 | 13F | Trust Co Of Vermont | 171 | 0,00 | 9 | -18,18 | ||||
| 2026-02-05 | 13F | Bessemer Group Inc | 75 | 0,00 | 0 | |||||
| 2026-02-10 | 13F | Bnp Paribas Arbitrage, Sa | 20.324 | -3,82 | 1.079 | -21,07 | ||||
| 2025-11-13 | 13F | Empowered Funds, LLC | 0 | -100,00 | 0 | |||||
| 2026-02-09 | 13F | Geode Capital Management, Llc | 268.833 | -0,18 | 14.275 | -18,13 | ||||
| 2026-01-28 | 13F | Klp Kapitalforvaltning As | 2.600 | 0,00 | 138 | -17,86 | ||||
| 2025-11-12 | 13F | Headlands Technologies LLC | 0 | -100,00 | 0 | -100,00 | ||||
| 2026-01-23 | 13F | Assetmark, Inc | 4 | 0,00 | 0 | |||||
| 2026-01-20 | 13F | Harbor Capital Advisors, Inc. | 51.913 | -8,67 | 3 | -33,33 | ||||
| 2025-11-10 | 13F | Shenkman Capital Management Inc | 0 | -100,00 | 0 | -100,00 | ||||
| 2026-02-17 | 13F | Symmetry Peak Management Llc | Call | 0 | -100,00 | 0 | ||||
| 2026-02-17 | 13F | Ameriprise Financial Inc | 504.234 | -4,78 | 26.770 | -21,91 | ||||
| 2026-02-17 | 13F | Zacks Investment Management | 29.878 | -8,59 | 1.586 | -25,01 | ||||
| 2026-02-17 | 13F | Royal Bank Of Canada | 55.665 | -22,38 | 2.955 | -36,34 | ||||
| 2026-02-17 | 13F | State Of Wisconsin Investment Board | 148.484 | 9,24 | 7.883 | -10,40 | ||||
| 2026-02-03 | 13F | Farmers & Merchants Investments Inc | 7 | 0,00 | 0 | |||||
| 2026-02-10 | 13F/A | Northwestern Mutual Wealth Management Co | 295 | 16 | ||||||
| 2026-02-17 | 13F | Advisor Group Holdings, Inc. | 82.242 | -8,22 | 4.366 | -28,27 | ||||
| 2026-02-13 | 13F | Manufacturers Life Insurance Company, The | 0 | -100,00 | 0 | |||||
| 2026-03-06 | 13F | Hsbc Holdings Plc | 14.113 | 49,76 | 750 | 22,95 | ||||
| 2026-02-06 | 13F | Tortoise Investment Management, LLC | 0 | -100,00 | 0 | |||||
| 2026-02-17 | 13F | Qube Research & Technologies Ltd | 99.880 | 4,85 | 5.303 | -14,01 | ||||
| 2026-02-17 | 13F | Tudor Investment Corp Et Al | 0 | -100,00 | 0 | -100,00 | ||||
| 2026-01-30 | 13F | Torren Management, LLC | 1.350 | 72 | ||||||
| 2026-02-17 | 13F | VARCOV Co. | 10.256 | 544 | ||||||
| 2026-02-09 | 13F | Huntington National Bank | 1 | 0,00 | 0 | |||||
| 2026-02-13 | 13F | Caitong International Asset Management Co., Ltd | 0 | -100,00 | 0 | |||||
| 2026-02-17 | 13F | Man Group plc | 19.376 | 1.029 | ||||||
| 2026-02-17 | 13F | Dark Forest Capital Management Lp | 0 | -100,00 | 0 | |||||
| 2026-02-13 | 13F | SRS Capital Advisors, Inc. | 27 | -98,72 | 1 | -99,26 | ||||
| 2026-02-17 | 13F | Nomura Holdings Inc | 28.574 | 1.517 | ||||||
| 2026-02-10 | 13F | Envestnet Asset Management Inc | 0 | -100,00 | 0 | |||||
| 2026-01-28 | 13F | Arizona State Retirement System | 0 | -100,00 | 0 | -100,00 | ||||
| 2026-02-06 | 13F | Cullen/frost Bankers, Inc. | 326 | 3,16 | 17 | -15,00 | ||||
| 2026-02-13 | 13F | State Street Corp | 244.954 | 4,39 | 13.005 | -14,38 | ||||
| 2026-02-10 | 13F | Goldman Sachs Group Inc | 111.987 | 16,99 | 5.945 | -4,05 | ||||
| 2026-02-13 | 13F | Dynamic Technology Lab Private Ltd | 11.560 | 80,62 | 614 | 48,31 | ||||
| 2026-02-03 | 13F | SBI Securities Co., Ltd. | 36 | 0,00 | 2 | -50,00 | ||||
| 2025-10-27 | 13F | First Horizon Corp | 0 | -100,00 | 0 | |||||
| 2026-04-06 | 13F | GAMMA Investing LLC | 203 | 395,12 | 9 | 300,00 | ||||
| 2026-01-21 | 13F | Signature Resources Capital Management, LLC | 3 | 0,00 | 0 | |||||
| 2026-02-17 | 13F | Bridgeway Capital Management Inc | 5.000 | 0,00 | 265 | -17,96 | ||||
| 2026-02-17 | 13F | Cetera Investment Advisers | 27.110 | 48,16 | 1.439 | 21,54 | ||||
| 2026-02-17 | 13F | Philadelphia Financial Management of San Francisco, LLC | 251.459 | 13.350 | ||||||
| 2026-02-13 | 13F | Walleye Trading LLC | 33 | 2 | ||||||
| 2026-02-13 | 13F | Walleye Trading LLC | Put | 5.400 | -69,32 | 287 | -74,89 | |||
| 2026-02-17 | 13F | Trexquant Investment LP | 26.835 | -82,52 | 1.425 | -85,67 | ||||
| 2026-02-13 | 13F | Walleye Trading LLC | Call | 11.500 | -3,36 | 611 | -20,78 | |||
| 2026-04-13 | 13F | True Wealth Design, LLC | 61 | 916,67 | 3 | |||||
| 2026-02-09 | 13F | Emerald Mutual Fund Advisers Trust | 218.269 | -1,12 | 11.588 | -18,90 | ||||
| 2026-01-27 | 13F | TD Waterhouse Canada Inc. | 0 | -100,00 | 0 | -100,00 | ||||
| 2026-02-17 | 13F | Northern Trust Corp | 90.165 | -6,03 | 4.787 | -22,93 | ||||
| 2026-02-06 | 13F | Gsa Capital Partners Llp | 0 | -100,00 | 0 | |||||
| 2026-02-17 | 13F | Fmr Llc | 170.101 | 27,29 | 9.031 | 4,39 | ||||
| 2026-02-17 | 13F | Mangrove Partners | 4.955 | 263 | ||||||
| 2026-02-11 | 13F | Group One Trading, L.p. | Put | 2.100 | -88,40 | 111 | -90,52 | |||
| 2026-02-12 | 13F | Steward Partners Investment Advisory, Llc | 31 | -97,64 | 2 | -98,82 | ||||
| 2026-02-11 | 13F | Group One Trading, L.p. | 1.041 | -89,06 | 55 | -91,06 | ||||
| 2026-03-12 | 13F/A | Peak6 Llc | Put | 16.100 | 31,97 | 855 | 8,24 | |||
| 2026-02-11 | 13F | Group One Trading, L.p. | Call | 6.800 | -28,42 | 361 | -41,21 | |||
| 2026-02-13 | 13F | Victory Capital Management Inc | 103.250 | -1,87 | 5.482 | -19,52 | ||||
| 2026-03-12 | 13F/A | Peak6 Llc | Call | 11.200 | -69,15 | 595 | -74,71 | |||
| 2025-11-14 | 13F | Cubist Systematic Strategies, LLC | 0 | -100,00 | 0 | -100,00 | ||||
| 2026-02-12 | 13F | Alps Advisors Inc | 15.166 | 25,37 | 805 | 2,81 | ||||
| 2026-02-17 | 13F | Aquatic Capital Management LLC | 0 | -100,00 | 0 | |||||
| 2026-03-12 | 13F/A | Peak6 Llc | 3.864 | 205 | ||||||
| 2026-02-13 | 13F | Blue Grotto Capital, LLC | 584.931 | 64,27 | 31.054 | 34,73 | ||||
| 2026-02-17 | 13F | Graham Capital Management, L.P. | 4.195 | 223 | ||||||
| 2026-02-10 | 13F | Root Financial Partners, LLC | 10 | 1 | ||||||
| 2026-02-13 | 13F | National Bank Of Canada /fi/ | 0 | -100,00 | 0 | |||||
| 2026-02-17 | 13F | Nomura Holdings Inc | Call | 0 | -100,00 | 0 | ||||
| 2026-02-10 | 13F | Quantbot Technologies LP | 0 | -100,00 | 0 | |||||
| 2026-02-11 | 13F | Janney Montgomery Scott LLC | 0 | -100,00 | 0 | |||||
| 2026-02-12 | 13F | Principal Securities, Inc. | 0 | -100,00 | 0 | |||||
| 2026-02-05 | 13F | Cornerstone Wealth Management, LLC | 7.618 | -6,73 | 404 | -23,48 | ||||
| 2026-02-04 | 13F | Ameritas Advisory Services, LLC | 0 | -100,00 | 0 | |||||
| 2026-04-02 | 13F | Byrne Asset Management LLC | 2.634 | 113 | ||||||
| 2026-02-09 | 13F | Connors Investor Services Inc | 3.814 | 0,00 | 202 | -17,89 | ||||
| 2026-02-13 | 13F | Morgan Stanley | 82.749 | -27,85 | 4.393 | -40,83 | ||||
| 2026-02-17 | 13F | Public Employees Retirement System Of Ohio | 1.891 | 100 | ||||||
| 2025-11-13 | 13F | Jacobs Asset Management, Llc | 0 | -100,00 | 0 | |||||
| 2026-04-06 | 13F | Versant Capital Management, Inc | 675 | 4.118,75 | 29 | |||||
| 2026-02-13 | 13F | Barclays Plc | 26.025 | 39,69 | 1.382 | 14,61 | ||||
| 2026-01-23 | 13F | State of Alaska, Department of Revenue | 4.998 | 820,44 | 0 | |||||
| 2026-02-18 | 13F | Mackenzie Financial Corp | 12.385 | 659 | ||||||
| 2026-04-16 | 13F | Evolve Private Wealth, Llc | 14.434 | 619 | ||||||
| 2026-02-13 | 13F | Pinnacle Wealth Planning Services, Inc. | 186 | 10 | ||||||
| 2026-01-30 | 13F | Jennison Associates Llc | 586.173 | 31.120 | ||||||
| 2026-02-12 | 13F | MetLife Investment Management, LLC | 6.532 | 0,00 | 347 | -18,01 | ||||
| 2026-02-13 | 13F | Parkside Financial Bank & Trust | 6 | 0,00 | 0 | |||||
| 2026-02-11 | 13F | Meeder Asset Management Inc | 1.780 | 94 | ||||||
| 2026-02-06 | 13F | EverSource Wealth Advisors, LLC | 243 | -8,99 | 13 | -29,41 | ||||
| 2026-02-12 | 13F | Renaissance Technologies Llc | 272.500 | -30,13 | 14.467 | -42,69 | ||||
| 2026-02-13 | 13F | American Century Companies Inc | 31.165 | 2,86 | 1.655 | -15,66 | ||||
| 2026-02-17 | 13F | Bank Of America Corp /de/ | 53.213 | -57,66 | 2.825 | -65,27 | ||||
| 2026-02-17 | 13F | Price T Rowe Associates Inc /md/ | 11.398 | 5,67 | 1 | |||||
| 2026-02-17 | 13F | Susquehanna International Group, Llp | Call | 54.600 | -57,28 | 2.899 | -64,97 | |||
| 2026-01-27 | 13F | Zurcher Kantonalbank (Zurich Cantonalbank) | 5.940 | 0,00 | 315 | -17,97 | ||||
| 2026-02-13 | 13F | Walleye Capital LLC | 0 | -100,00 | 0 | -100,00 | ||||
| 2026-02-17 | 13F | Susquehanna International Group, Llp | 16.924 | -43,39 | 898 | -53,59 | ||||
| 2026-02-17 | 13F | Susquehanna International Group, Llp | Put | 38.900 | -61,06 | 2.065 | -68,06 | |||
| 2026-01-15 | 13F | Allspring Global Investments Holdings, LLC | 8.280 | 440 | ||||||
| 2026-02-11 | 13F | Parallel Advisors, LLC | 0 | -100,00 | 0 | |||||
| 2026-04-16 | 13F | SG Americas Securities, LLC | 3.329 | -73,34 | 0 | |||||
| 2026-02-17 | 13F | Citadel Advisors Llc | 45.708 | -83,70 | 2.427 | -86,64 | ||||
| 2025-11-14 | 13F | Wolverine Trading, Llc | 19.737 | 1.336 | ||||||
| 2026-04-10 | 13F | Intellectus Partners, LLC | 32.800 | -0,61 | 1.406 | -19,70 | ||||
| 2026-02-17 | 13F | Citadel Advisors Llc | Put | 19.300 | -22,49 | 1.025 | -36,44 | |||
| 2025-11-14 | 13F | Wolverine Trading, Llc | Call | 18.400 | 1.245 | |||||
| 2026-02-17 | 13F | Citadel Advisors Llc | Call | 32.300 | -15,67 | 1.715 | -30,86 | |||
| 2025-11-14 | 13F | Wolverine Trading, Llc | Put | 14.300 | 968 | |||||
| 2026-04-15 | 13F | Fortitude Family Office, LLC | 13 | 1 | ||||||
| 2026-01-28 | 13F | Universal- Beteiligungs- und Servicegesellschaft mbH | 7.844 | 416 | ||||||
| 2026-02-13 | 13F | Smartleaf Asset Management LLC | 280 | 4.566,67 | 15 | |||||
| 2026-02-06 | 13F | Covestor Ltd | 42 | 4.100,00 | 0 | |||||
| 2026-02-13 | 13F | Charles Schwab Investment Management Inc | 98.704 | -2,64 | 5.240 | -20,15 | ||||
| 2026-04-10 | 13F | Armstrong Advisory Group, Inc | 3 | 0,00 | 0 | |||||
| 2026-02-13 | 13F | Marshall Wace, Llp | 67.206 | 3.568 | ||||||
| 2026-04-15 | 13F | Financial Management Professionals, Inc. | 0 | -100,00 | 0 | |||||
| 2026-02-17 | 13F | Tudor Investment Corp Et Al | Call | 4.200 | -4,55 | 223 | -21,83 | |||
| 2026-02-12 | 13F | Swiss National Bank | 22.800 | 2,24 | 1.210 | -16,15 | ||||
| 2026-02-12 | 13F | SWAN Capital LLC | 7 | 0,00 | 0 | |||||
| 2026-02-20 | 13F | Sunbelt Securities, Inc. | 11.996 | -2,08 | 637 | -19,80 | ||||
| 2026-02-12 | 13F | Counterpoint Mutual Funds LLC | 7.708 | -12,13 | 387 | 14,16 | ||||
| 2026-02-02 | 13F | Fifth Third Bancorp | 600 | 32 | ||||||
| 2026-02-17 | 13F | Punch & Associates Investment Management, Inc. | 469.647 | 35,09 | 24.934 | 10,80 | ||||
| 2026-02-17 | 13F | Lazard Asset Management Llc | 4.040 | 0,00 | 214 | -18,01 | ||||
| 2026-02-13 | 13F | Cullen Capital Management, LLC | 24.636 | -0,67 | 1.308 | -18,57 | ||||
| 2026-01-30 | 13F | New York State Teachers Retirement System | 1.017 | 0 | ||||||
| 2026-02-13 | 13F | Panagora Asset Management Inc | 45.057 | 447,41 | 2.392 | 349,62 | ||||
| 2026-02-17 | 13F | Aqr Capital Management Llc | 42.904 | 6,13 | 2.252 | -13,91 | ||||
| 2026-02-12 | 13F | Hrt Financial Lp | 0 | -100,00 | 0 | |||||
| 2026-01-29 | 13F | Comerica Bank | 304 | -0,98 | 16 | -15,79 | ||||
| 2026-02-13 | 13F | Squarepoint Ops LLC | 0 | -100,00 | 0 | |||||
| 2026-02-17 | 13F | Engineers Gate Manager LP | 27.154 | -7,54 | 1.442 | -24,20 | ||||
| 2026-02-17 | 13F | Susquehanna Portfolio Strategies, LLC | 33.847 | -13,72 | 1.797 | -29,26 | ||||
| 2026-02-23 | 13F | Leonteq Securities AG | 0 | -100,00 | 0 | |||||
| 2026-02-17 | 13F | Quantinno Capital Management LP | 6.096 | 16,60 | 324 | -4,44 | ||||
| 2026-02-13 | 13F | Rhumbline Advisers | 14.857 | -11,53 | 789 | -27,44 | ||||
| 2026-02-13 | 13F | Verition Fund Management LLC | 5.700 | -8,01 | 303 | -24,69 | ||||
| 2026-02-05 | 13F | Amalgamated Bank | 351 | -12,47 | 0 | |||||
| 2026-02-17 | 13F | Advisory Services Network, LLC | 0 | -100,00 | 0 | |||||
| 2026-02-17 | 13F | D. E. Shaw & Co., Inc. | 0 | -100,00 | 0 | |||||
| 2026-02-17 | 13F | California State Teachers Retirement System | 11.572 | 10,27 | 614 | -9,57 | ||||
| 2026-01-15 | 13F | Nisa Investment Advisors, Llc | 24 | 0,00 | 1 | 0,00 | ||||
| 2026-02-12 | 13F | Jane Street Group, Llc | 0 | -100,00 | 0 | -100,00 | ||||
| 2025-11-04 | 13F | Thrivent Financial For Lutherans | 0 | -100,00 | 0 | |||||
| 2026-02-09 | 13F | Emerald Advisers, Llc | 361.945 | -1,35 | 19.216 | -19,09 | ||||
| 2026-02-11 | 13F | Deutsche Bank Ag\ | 8.980 | -0,39 | 477 | -18,35 | ||||
| 2026-02-17 | 13F | Alliancebernstein L.p. | 10.423 | 0,00 | 553 | -17,95 | ||||
| 2026-02-13 | 13F | Great West Life Assurance Co /can/ | 1.456 | 0,00 | 0 | |||||
| 2026-04-08 | 13F | Wealth Enhancement Advisory Services, Llc | 5.150 | 210 | ||||||
| 2026-01-29 | 13F | UBS Group AG | 143.924 | 374,21 | 7.641 | 289,00 | ||||
| 2026-02-11 | 13F | Ameritas Investment Partners, Inc. | 934 | 50 | ||||||
| 2026-02-13 | 13F | Kestra Advisory Services, LLC | 393 | 21 | ||||||
| 2026-02-17 | 13F | Two Sigma Investments, Lp | 27.566 | -71,00 | 1.463 | -76,22 | ||||
| 2026-02-17 | 13F | Signature Equity Partners, LLC | 25 | 1 | ||||||
| 2026-02-17 | 13F | Shay Capital LLC | 5.000 | 265 | ||||||
| 2026-02-06 | 13F | Pnc Financial Services Group, Inc. | 85 | 6,25 | 5 | -20,00 | ||||
| 2026-01-09 | 13F | Assenagon Asset Management S.A. | 158.951 | 2,49 | 8.439 | -15,94 | ||||
| 2026-02-13 | 13F | Walleye Capital LLC | Call | 8.000 | -44,06 | 425 | -54,16 | |||
| 2026-02-13 | 13F | Walleye Capital LLC | Put | 3.300 | -71,05 | 175 | -76,26 | |||
| 2026-02-13 | 13F | Police & Firemen's Retirement System of New Jersey | 3.073 | 0,00 | 163 | -17,68 | ||||
| 2026-02-06 | 13F | Larson Financial Group LLC | 335 | 33,47 | 18 | 6,25 | ||||
| 2026-02-13 | 13F | Y-Intercept (Hong Kong) Ltd | 42.525 | 51,11 | 2.258 | 23,94 | ||||
| 2026-02-09 | 13F | Hartland & Co., LLC | 0 | -100,00 | 0 | |||||
| 2026-02-12 | 13F | Dimensional Fund Advisors Lp | 254.557 | 1,31 | 13.515 | -16,92 | ||||
| 2026-01-29 | 13F | IMC-Chicago, LLC | Call | 18.700 | -52,42 | 993 | -60,99 | |||
| 2026-02-10 | 13F | Acadian Asset Management Llc | 201.611 | 4,39 | 11 | -16,67 | ||||
| 2026-02-17 | 13F | Polar Asset Management Partners Inc. | 0 | -100,00 | 0 | |||||
| 2026-02-09 | 13F | New Age Alpha Advisors, LLC | 0 | -100,00 | 0 | |||||
| 2026-02-09 | 13F | Quest Partners LLC | 1.577 | -57,12 | 84 | -65,13 | ||||
| 2026-01-21 | 13F | SJS Investment Consulting Inc. | 59 | -42,16 | 3 | -50,00 | ||||
| 2026-02-17 | 13F | Boothbay Fund Management, Llc | 21.690 | -50,91 | 1.152 | -59,74 | ||||
| 2026-02-18 | 13F | GWM Advisors LLC | 3.750 | 861,54 | 199 | 696,00 | ||||
| 2026-02-05 | 13F | Allworth Financial LP | 19 | -5,00 | 1 | 0,00 | ||||
| 2026-01-09 | 13F | Congress Asset Management Co /ma | 0 | -100,00 | 0 | -100,00 | ||||
| 2026-02-03 | 13F | McIlrath & Eck, LLC | 1.117 | 59 | ||||||
| 2026-02-17 | 13F | Optiver Holding B.V. | 137 | 107,58 | 7 | 75,00 | ||||
| 2026-01-15 | 13F | Range Financial Group LLC | 0 | -100,00 | 0 | -100,00 | ||||
| 2026-01-29 | 13F | RMG Wealth Management LLC | 1 | 0,00 | 0 | |||||
| 2025-11-14 | 13F | Point72 (DIFC) Ltd | 0 | -100,00 | 0 | |||||
| 2026-02-05 | 13F | Plante Moran Financial Advisors, LLC | 160 | 8 | ||||||
| 2026-02-10 | 13F | State of Wyoming | 2.095 | -18,51 | 111 | -33,13 | ||||
| 2026-01-26 | 13F | Whittier Trust Co | 4 | 0,00 | 0 | |||||
| 2026-04-13 | 13F | Mather Group, Llc. | 9 | 0 | ||||||
| 2026-02-17 | 13F | Brevan Howard Capital Management LP | 16.182 | 141,52 | 859 | 98,38 | ||||
| 2026-02-17 | 13F | Russell Investments Group, Ltd. | 23.542 | -0,32 | 1.250 | -18,26 | ||||
| 2026-02-03 | 13F | Acorn Financial Advisory Services Inc /adv | 6.314 | 14,67 | 335 | -5,90 | ||||
| 2026-02-17 | 13F | Private Capital Management, LLC | 0 | -100,00 | 0 | |||||
| 2026-02-13 | 13F | BNP Paribas Asset Management Holding S.A. | 152 | 0 | ||||||
| 2026-04-10 | 13F/A | OP Asset Management Ltd | 799 | 34 | ||||||
| 2026-02-10 | 13F | CIBC World Markets Inc. | 0 | -100,00 | 0 | |||||
| 2025-10-27 | 13F | Nordea Investment Management Ab | 0 | -100,00 | 0 | |||||
| 2026-02-13 | 13F | Caxton Associates Llp | 0 | -100,00 | 0 | |||||
| 2026-02-10 | 13F | Bank of New York Mellon Corp | 34.288 | 4,34 | 1.820 | -14,43 | ||||
| 2026-02-17 | 13F | Jump Financial, LLC | 0 | -100,00 | 0 | |||||
| 2026-02-11 | 13F | Jpmorgan Chase & Co | 35.306 | 67,89 | 1.874 | 37,69 | ||||
| 2026-04-13 | 13F | IFP Advisors, Inc | 107 | 970,00 | 5 | |||||
| 2026-02-17 | 13F | Tower Research Capital LLC (TRC) | 306 | -67,82 | 16 | -73,77 | ||||
| 2026-02-11 | 13F | LPL Financial LLC | 11.942 | -13,08 | 634 | -28,68 | ||||
| 2026-02-12 | 13F | New York State Common Retirement Fund | 4.590 | 0,00 | 244 | -18,18 | ||||
| 2025-11-21 | 13F | Nebula Research & Development LLC | 0 | -100,00 | 0 | -100,00 | ||||
| 2026-02-12 | 13F | BlackRock, Inc. | 1.069.732 | 12,43 | 56.792 | -7,79 | ||||
| 2026-02-12 | 13F | Quadrant Capital Group Llc | 44 | 2 | ||||||
| 2026-02-13 | 13F | Ubs Asset Management Americas Inc | 17.867 | 22,03 | 949 | 0,11 | ||||
| 2026-02-13 | 13F | Vontobel Holding Ltd. | 3.774 | -2,00 | 200 | -19,68 | ||||
| 2026-02-13 | 13F | Mariner, LLC | 1.760.407 | 31,51 | 93.461 | 7,86 | ||||
| 2026-02-17 | 13F | MIRAE ASSET GLOBAL ETFS HOLDINGS Ltd. | 19.556 | -6,24 | 1.038 | -23,34 | ||||
| 2026-02-12 | 13F | Nuveen, LLC | 153.925 | 9,55 | 8.172 | -10,15 | ||||
| 2026-02-13 | 13F | Wells Fargo & Company/mn | 20.273 | -6,64 | 1.076 | -23,42 | ||||
| 2026-01-26 | 13F | Mirae Asset Global Investments Co., Ltd. | 49 | 19,51 | 3 | 0,00 | ||||
| 2026-02-06 | 13F | GPS Wealth Strategies Group, LLC | 100 | -50,00 | 5 | -58,33 | ||||
| 2025-11-10 | 13F | Jupiter Asset Management Ltd | 0 | -100,00 | 0 | -100,00 | ||||
| 2026-02-12 | 13F | Integrated Quantitative Investments LLC | 14.639 | 777 | ||||||
| 2026-02-13 | 13F | Sterling Capital Management LLC | 115 | 64,29 | 6 | 50,00 | ||||
| 2026-01-21 | 13F | Flagship Harbor Advisors, Llc | 1 | 0 | ||||||
| 2026-02-17 | 13F | Credit Agricole S A | 49.837 | 0,00 | 2.646 | -17,98 |