Temel İstatistikler
| Kurumsal Sahipler | 141 total, 140 long only, 1 short only, 0 long/short - change of -48,35% MRQ |
| Ortalama Portföy Dağıtımı | 0.1989 % - change of 83,44% MRQ |
| Kurumsal Hisseler (Uzun) | 24.931.076 (ex 13D/G) - change of -3,89MM shares -13,49% MRQ |
| Kurumsal Değer (Uzun) | $ 182.444 USD ($1000) |
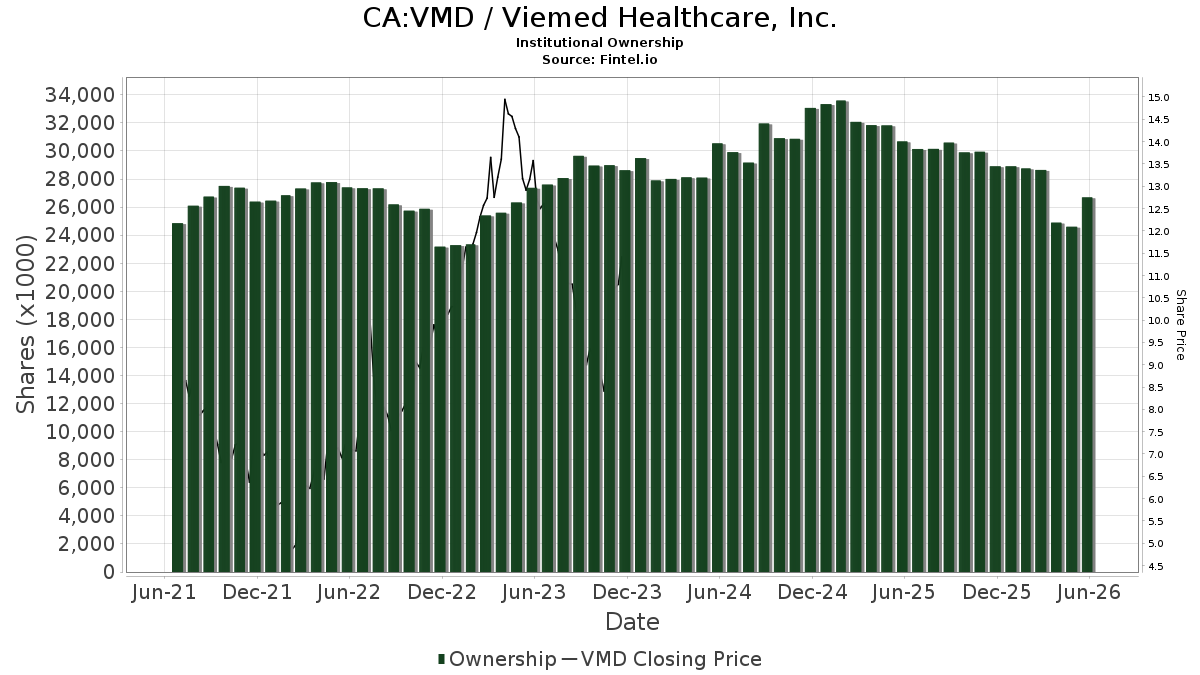
Kurumsal Mülkiyet ve Hissedarlar
Viemed Healthcare, Inc. (CA:VMD) var 141 Menkul Kıymetler Borsası Komisyonuna (SEC) 13D/G veya 13F formları dolduran kurumsal sahipler ve hissedarlar. Bu kurumların toplam 24,931,076 hissesi bulunmaktadır. En büyük hissedarlar arasındakiler: BlackRock, Inc., Forager Capital Management, LLC, Vanguard Group Inc, Goldman Sachs Group Inc, Nantahala Capital Management, LLC, Ameriprise Financial Inc, Geode Capital Management, Llc, Kent Lake PR LLC, State Street Corp, and Punch & Associates Investment Management, Inc. .
Viemed Healthcare, Inc. (TSX:VMD) kurumsal mülkiyet yapısı, kurum ve fonlara göre şirketteki mevcut pozisyonların yanı sıra pozisyon büyüklüğündeki son değişiklikleri gösterir. Büyük hissedarlar bireysel yatırımcıları, yatırım fonlarını, hedge fonlarını veya kurumları içerebilir. Çizelge 13D, yatırımcının şirketin %5inden fazlasını elinde bulundurduğunu (veya elinde önceden bulundurduğunu) ve iş stratejisinde aktif olarak bir değişiklik yapmayı planladığını (veya önceden planladığını) gösterir. Çizelge 13G, %5in üzerinde pasif yatırımı gösterir.
Fon Eğilim Skoru
Fon Eğilim Skoru (diğer adıyla Sahiplik Birikimi Skoru), fonlar tarafından en çok satın alınan hisse senetlerini bulur. En yüksek düzeyde kurumsal birikime sahip şirketleri tanımlayan karmaşık, çok faktörlü kantitatif bir modelin sonucudur. Skorlama modeli, açıklanan sahiplerdeki toplam artışın, bu sahiplerdeki portföy dağıtımındaki değişikliklerin ve diğer ölçümlerin bir kombinasyonunu kullanır. Sayı 0dan 100e kadar değişir; daha yüksek sayılar emsallerine göre daha yüksek bir birikim düzeyine işaret eder ve 50 ortalamadır.
Güncelleme Sıklığı: Günlük
En üst düzey şirketlerin listesini sağlayan Sahiplik Gezginine bakın.
AI+ Ask Fintel’s AI assistant about Viemed Healthcare, Inc..
Select a question to share a public post with an AI-crafted answer.
Thinking of good questions…
13F ve NPORT Başvuruları
13F başvurularına ilişkin ayrıntılar ücretsizdir. NP başvurularına ilişkin ayrıntılar premium üyelik gerektirir. Yeşil satırlar yeni pozisyonları gösterir. Kırmızı satırlar kapalı pozisyonları gösterir. Tam işlem geçmişini görmek için linkesimgesine tıklayınız.
Yükseltin
premium verilerin kilidini açmak ve Excele aktarmak için ![]() .
.
| Dosya Tarihi | Kaynak | Yatırımcı | Tür | Ortalama Fiyat (Tahmin) |
Hisseler | Δ Hisseler (%) |
Bildirilen Değer (1000$) |
Δ Değer (%) |
Bağlantı Noktası Dağıtımı (%) |
|
|---|---|---|---|---|---|---|---|---|---|---|
| 2026-02-13 | 13F | SRS Capital Advisors, Inc. | 0 | -100,00 | 0 | |||||
| 2026-02-02 | 13F | Strs Ohio | 69.700 | 6,57 | 518 | 16,44 | ||||
| 2026-02-05 | 13F | Allworth Financial LP | 67 | -16,25 | 0 | |||||
| 2026-02-17 | 13F | Trexquant Investment LP | 100.647 | -24,19 | 748 | -17,09 | ||||
| 2026-02-17 | 13F | Northern Trust Corp | 248.735 | -8,24 | 1.848 | 0,43 | ||||
| 2026-02-05 | 13F | Gabelli Funds Llc | 105.000 | -12,50 | 780 | -4,18 | ||||
| 2026-02-17 | 13F/A | Sentinus, LLC | 130.100 | 967 | ||||||
| 2025-11-13 | 13F | Cove Street Capital, LLC | 219.848 | 57,46 | 1.493 | 54,77 | ||||
| 2026-02-03 | 13F | SummerHaven Investment Management, LLC | 121.936 | 0,00 | 906 | 9,43 | ||||
| 2026-02-13 | 13F | Martingale Asset Management L P | 42.483 | 5,98 | 316 | 15,81 | ||||
| 2026-02-17 | 13F | Punch & Associates Investment Management, Inc. | 671.360 | 0,00 | 4.988 | 9,43 | ||||
| 2026-02-09 | 13F | Hartland & Co., LLC | 0 | -100,00 | 0 | |||||
| 2025-11-14 | 13F | Cubist Systematic Strategies, LLC | 22.379 | -41,00 | 152 | -42,37 | ||||
| 2026-02-17 | 13F | Forager Capital Management, LLC | 2.785.871 | 1,81 | 20.699 | 11,40 | ||||
| 2026-02-17 | 13F | Point72 Asset Management, L.P. | 96.374 | 716 | ||||||
| 2026-02-12 | 13F | Tocqueville Asset Management L.p. | 472.100 | 5,59 | 3.508 | 15,55 | ||||
| 2026-02-13 | 13F | Walleye Capital LLC | 24.963 | 81,38 | 185 | 98,92 | ||||
| 2026-04-10 | 13F | Daytona Street Capital LLC | 300 | 0,00 | 3 | 0,00 | ||||
| 2026-02-17 | 13F | Tower Research Capital LLC (TRC) | 1.722 | 28,41 | 13 | 33,33 | ||||
| 2026-02-13 | 13F | Panagora Asset Management Inc | 468.740 | 8,02 | 3.483 | 18,19 | ||||
| 2026-02-13 | 13F | Boston Partners | 0 | -100,00 | 0 | |||||
| 2026-02-17 | 13F | Bank Of America Corp /de/ | 50.291 | -31,28 | 374 | -24,80 | ||||
| 2026-02-17 | 13F | Petrus Trust Company, LTA | 0 | -100,00 | 0 | |||||
| 2026-04-16 | 13F | Capital Advisors, Ltd. LLC | 89 | 0,00 | 0 | |||||
| 2026-02-17 | 13F | Raffles Associates Lp | 417.691 | 0,00 | 3.103 | 9,41 | ||||
| 2025-11-14 | 13F | Kent Lake PR LLC | 700.000 | -40,66 | 4.753 | -41,69 | ||||
| 2026-02-13 | 13F | Morgan Stanley | 292.771 | 10,24 | 2.175 | 20,63 | ||||
| 2026-04-06 | 13F | GAMMA Investing LLC | 323 | 17,45 | 3 | 0,00 | ||||
| 2026-02-13 | 13F | Rhumbline Advisers | 42.620 | -12,30 | 317 | -3,95 | ||||
| 2026-02-17 | 13F | Aqr Capital Management Llc | 48.300 | -0,17 | 359 | 9,15 | ||||
| 2026-02-10 | 13F | Globeflex Capital L P | 7.516 | 0,00 | 56 | 7,84 | ||||
| 2026-02-12 | 13F | Renaissance Technologies Llc | 440.800 | -1,39 | 3.275 | 7,91 | ||||
| 2026-02-17 | 13F | Russell Investments Group, Ltd. | 10.303 | -95,29 | 77 | -94,89 | ||||
| 2026-02-05 | 13F | Amalgamated Bank | 1.074 | -6,69 | 0 | |||||
| 2026-02-13 | 13F | Victory Capital Management Inc | 0 | -100,00 | 0 | |||||
| 2026-02-13 | 13F | Manufacturers Life Insurance Company, The | 0 | -100,00 | 0 | |||||
| 2026-02-09 | 13F | Geode Capital Management, Llc | 776.362 | -2,67 | 5.770 | 6,50 | ||||
| 2026-02-17 | 13F | Kemnay Advisory Services Inc. | 6.183 | 46 | ||||||
| 2026-02-13 | 13F | Smartleaf Asset Management LLC | 1.583 | 358,84 | 12 | 450,00 | ||||
| 2026-02-17 | 13F | PDT Partners, LLC | 27.765 | -36,57 | 206 | -30,64 | ||||
| 2026-02-17 | 13F | PharVision Advisers, LLC | 0 | -100,00 | 0 | |||||
| 2026-01-29 | 13F | Vanguard Group Inc | 1.782.440 | -1,22 | 13.244 | 8,10 | ||||
| 2026-02-11 | 13F | Vestcor Inc | 23.563 | 0,00 | 0 | |||||
| 2026-02-12 | 13F | Principal Securities, Inc. | 0 | -100,00 | 0 | -100,00 | ||||
| 2026-04-13 | 13F | Salem Investment Counselors Inc | 43.507 | -31,06 | 401 | -14,53 | ||||
| 2026-02-13 | 13F | Wells Fargo & Company/mn | 37.403 | 74,75 | 278 | 91,03 | ||||
| 2026-02-17 | 13F | Lazard Asset Management Llc | 99.238 | 5,92 | 737 | 15,88 | ||||
| 2026-02-17 | 13F | Ancora Advisors, LLC | 26.054 | 194 | ||||||
| 2026-02-17 | 13F | Quantinno Capital Management LP | 37.465 | 97,58 | 278 | 117,19 | ||||
| 2026-04-08 | 13F | Violich Capital Management, Inc. | 24.450 | 225 | ||||||
| 2026-02-12 | 13F | MetLife Investment Management, LLC | 18.565 | 52,71 | 138 | 67,07 | ||||
| 2026-02-10 | 13F | Bnp Paribas Arbitrage, Sa | 121.184 | 23,54 | 900 | 35,14 | ||||
| 2026-02-12 | 13F | BlackRock, Inc. | 4.626.076 | -2,98 | 34.372 | 6,16 | ||||
| 2026-02-12 | 13F | Integrated Quantitative Investments LLC | 62.623 | 465 | ||||||
| 2026-04-16 | 13F | SG Americas Securities, LLC | 0 | -100,00 | 0 | |||||
| 2025-10-30 | 13F | Covestor Ltd | 0 | -100,00 | 0 | |||||
| 2026-02-10 | 13F | Acadian Asset Management Llc | 33.242 | 3,19 | 0 | |||||
| 2026-02-17 | 13F | Citadel Advisors Llc | 60.483 | -44,30 | 449 | -39,08 | ||||
| 2026-01-26 | 13F | Bcm Advisors, Llc | 23.520 | 0,00 | 172 | 6,83 | ||||
| 2026-01-29 | 13F | UBS Group AG | 86.199 | -50,29 | 640 | -45,62 | ||||
| 2026-04-15 | 13F | Brendel Financial Advisors LLC | 36.298 | 334 | ||||||
| 2026-02-17 | 13F | Mangrove Partners | 71.943 | 535 | ||||||
| 2026-01-15 | 13F | Nisa Investment Advisors, Llc | 8 | 0,00 | 0 | |||||
| 2026-02-04 | 13F | First Eagle Investment Management, LLC | 518.157 | 8,44 | 3.850 | 18,65 | ||||
| 2026-02-12 | 13F | Dimensional Fund Advisors Lp | 193.792 | -13,91 | 1.440 | -5,76 | ||||
| 2026-02-13 | 13F | Segall Bryant & Hamill, Llc | 288.771 | -0,23 | 2.146 | 9,16 | ||||
| 2025-11-14 | 13F | Wasatch Advisors Inc | 0 | -100,00 | 0 | |||||
| 2026-02-11 | 13F | Simplex Trading, Llc | Call | 100 | 0,00 | 0 | ||||
| 2025-11-14 | 13F | Point72 (DIFC) Ltd | 1.431 | 1.422,34 | 10 | |||||
| 2026-01-21 | 13F | Flagship Harbor Advisors, Llc | 1.600 | 12 | ||||||
| 2026-02-13 | 13F | Nantahala Capital Management, LLC | 932.445 | 0,00 | 6.928 | 9,43 | ||||
| 2026-02-17 | 13F | Susquehanna International Group, Llp | 17.029 | 127 | ||||||
| 2026-02-17 | 13F | Two Sigma Advisers, Lp | 94.000 | 25,67 | 698 | 37,67 | ||||
| 2026-02-18 | 13F | Mackenzie Financial Corp | 52.960 | -23,78 | 396 | -15,92 | ||||
| 2026-02-11 | 13F | Group One Trading, L.p. | Put | 100 | 0,00 | 1 | ||||
| 2026-02-17 | 13F | Two Sigma Investments, Lp | 261.714 | 4,10 | 1.945 | 13,88 | ||||
| 2026-02-13 | 13F | First Trust Advisors Lp | 104.584 | 0,45 | 777 | 10,06 | ||||
| 2026-04-20 | 13F | State of Alaska, Department of Revenue | 3.434 | 0,00 | 0 | |||||
| 2025-10-29 | 13F | AMH Equity Ltd | 80.000 | 0,00 | 543 | -1,63 | ||||
| 2026-02-13 | 13F | Citigroup Inc | 1.310 | -57,52 | 10 | -55,00 | ||||
| 2026-04-16 | 13F | Diversified Trust Co | 11.583 | 107 | ||||||
| 2026-01-27 | 13F | TD Waterhouse Canada Inc. | 24.465 | 20,97 | 182 | 29,29 | ||||
| 2026-02-13 | 13F | Police & Firemen's Retirement System of New Jersey | 7.421 | 0,00 | 55 | 10,00 | ||||
| 2025-11-13 | 13F | Winton Capital Group Ltd | 0 | -100,00 | 0 | -100,00 | ||||
| 2026-02-17 | 13F | Alliancebernstein L.p. | 12.460 | 0,00 | 93 | 9,52 | ||||
| 2026-02-17 | 13F | Millennium Management Llc | 48.398 | 348,21 | 360 | 391,78 | ||||
| 2025-11-14 | 13F | State Board Of Administration Of Florida Retirement System | 0 | -100,00 | 0 | -100,00 | ||||
| 2026-02-11 | 13F | LPL Financial LLC | 75.190 | -27,63 | 559 | -20,85 | ||||
| 2026-04-09 | 13F | Pacifica Partners Inc. | 375 | 0,00 | 3 | 50,00 | ||||
| 2026-02-13 | 13F | Arrowstreet Capital, Limited Partnership | 352.323 | 0,00 | 2.618 | 9,41 | ||||
| 2026-02-05 | 13F | Thrivent Financial For Lutherans | 0 | -100,00 | 0 | |||||
| 2026-02-10 | 13F | Rothschild Investment Llc | 84 | 5,00 | 1 | |||||
| 2026-02-17 | 13F | Perritt Capital Management Inc | 130.100 | 4,00 | 967 | 13,78 | ||||
| 2026-02-09 | 13F | Legal & General Group Plc | 3.726 | -3,77 | 28 | 3,85 | ||||
| 2025-11-13 | 13F | Marshall Wace, Llp | 46.994 | 120,85 | 319 | 117,01 | ||||
| 2026-02-17 | 13F | Mbb Public Markets I Llc | 23.384 | 0,00 | 174 | 9,49 | ||||
| 2026-02-17 | 13F/A | RBF Capital, LLC | 65.972 | -7,73 | 490 | 1,03 | ||||
| 2026-02-06 | 13F | EverSource Wealth Advisors, LLC | 32 | -5,88 | 0 | |||||
| 2025-11-13 | 13F | Jump Financial, LLC | 0 | -100,00 | 0 | |||||
| 2026-02-17 | 13F | Price T Rowe Associates Inc /md/ | 18.564 | 0,00 | 0 | |||||
| 2026-02-13 | 13F | Ubs Asset Management Americas Inc | 415 | 3 | ||||||
| 2026-02-17 | 13F | Royal Bank Of Canada | 5.825 | 2,63 | 43 | 13,16 | ||||
| 2026-02-13 | 13F | Barclays Plc | 131.759 | 2,71 | 979 | 12,28 | ||||
| 2026-02-12 | 13F | Nuveen, LLC | 99.550 | 0,00 | 740 | 9,48 | ||||
| 2026-01-08 | 13F | Ulland Investment Advisors, LLC | 85.495 | 16,96 | 1 | |||||
| 2026-02-11 | 13F | Deutsche Bank Ag\ | 31.041 | 3.900,13 | 231 | 4.500,00 | ||||
| 2026-02-10 | 13F | Bank of New York Mellon Corp | 79.553 | -3,57 | 591 | 5,54 | ||||
| 2026-01-30 | 13F | R Squared Ltd | 13.714 | 102 | ||||||
| 2026-02-17 | 13F | Bridgeway Capital Management Inc | 34.000 | 0,00 | 253 | 9,57 | ||||
| 2026-02-10 | 13F | Goldman Sachs Group Inc | 1.447.033 | 3,58 | 10.751 | 13,34 | ||||
| 2026-02-19 | 13F | Invesco Ltd. | 21.773 | 17,06 | 162 | 27,78 | ||||
| 2026-02-10 | 13F | Intech Investment Management Llc | 16.165 | -13,15 | 120 | -4,76 | ||||
| 2026-02-13 | 13F | Sterling Capital Management LLC | 227 | 170,24 | 2 | |||||
| 2026-01-30 | 13F | New York State Teachers Retirement System | 3.089 | 0,00 | 0 | |||||
| 2026-02-17 | 13F | Summit Global Investments | 28.783 | 1,27 | 0 | |||||
| 2026-02-17 | 13F | Fmr Llc | 1.235 | -28,61 | 9 | -18,18 | ||||
| 2026-01-14 | 13F | Spire Wealth Management | 0 | -100,00 | 0 | |||||
| 2026-02-13 | 13F | State Street Corp | 675.190 | 1,72 | 5.017 | 11,29 | ||||
| 2026-02-13 | 13F | MAI Capital Management | 24 | 0 | ||||||
| 2026-02-17 | 13F | California State Teachers Retirement System | 2.106 | -15,32 | 16 | -6,25 | ||||
| 2026-04-06 | 13F | Versant Capital Management, Inc | 2.086 | 39,53 | 19 | 72,73 | ||||
| 2026-04-07 | 13F | Farther Finance Advisors, LLC | 76 | 245,45 | 1 | |||||
| 2026-02-13 | 13F | Pinnacle Wealth Planning Services, Inc. | 703 | 5 | ||||||
| 2026-02-12 | 13F | Federation des caisses Desjardins du Quebec | 1.400 | 0,00 | 10 | 11,11 | ||||
| 2026-02-10 | 13F | Verus Capital Partners, Llc | 34.150 | -20,35 | 254 | -13,06 | ||||
| 2026-02-11 | 13F | Jpmorgan Chase & Co | 154.841 | 3,28 | 1.150 | 13,08 | ||||
| 2026-02-13 | 13F | National Bank Of Canada /fi/ | 1.496 | 0,00 | 11 | 10,00 | ||||
| 2026-02-12 | 13F | JBF Capital, Inc. | 43.578 | 0,00 | 324 | 9,49 | ||||
| 2026-04-20 | 13F | Cardinal Point Capital Management, ULC | 12.480 | 0,00 | 115 | 23,91 | ||||
| 2026-04-07 | 13F | Signaturefd, Llc | 292 | 3 | ||||||
| 2026-02-03 | 13F | SBI Securities Co., Ltd. | 0 | -100,00 | 0 | |||||
| 2026-02-17 | 13F | Expect Equity LLC | 173.970 | 59,59 | 1.293 | 74,59 | ||||
| 2026-02-11 | 13F | Los Angeles Capital Management Llc | 89.339 | 226,54 | 571 | 208,11 | ||||
| 2026-02-02 | 13F | Cornerstone Planning Group LLC | 0 | -100,00 | 0 | |||||
| 2026-01-26 | 13F | Cwm, Llc | 2.451 | -13,15 | 0 | |||||
| 2026-02-13 | 13F | Charles Schwab Investment Management Inc | 99.562 | -4,75 | 740 | 4,23 | ||||
| 2026-02-17 | 13F | Watershed Asset Management, L.L.C. | 62.653 | 466 | ||||||
| 2026-02-12 | 13F | New York State Common Retirement Fund | 7.488 | 0,00 | 56 | 10,00 | ||||
| 2026-02-12 | 13F | Campbell & CO Investment Adviser LLC | 62.072 | -17,48 | 461 | -9,61 | ||||
| 2026-02-13 | 13F | Rice Hall James & Associates, Llc | 230.382 | 15,54 | 1.712 | 26,46 | ||||
| 2026-02-13 | 13F | Quarry LP | 0 | -100,00 | 0 | |||||
| 2026-02-17 | 13F | Advisor Group Holdings, Inc. | 27.362 | -0,23 | 203 | 9,14 | ||||
| 2026-02-17 | 13F | Ameriprise Financial Inc | 822.813 | 558,53 | 6.114 | 620,87 | ||||
| 2026-02-11 | 13F | Ameritas Investment Partners, Inc. | 2.819 | 0,00 | 21 | 5,26 | ||||
| 2026-04-13 | 13F | IFP Advisors, Inc | 40 | 14,29 | 0 | |||||
| 2026-02-17 | 13F | Oxford Asset Management Llp | 0 | -100,00 | 0 | -100,00 | ||||
| 2026-02-06 | 13F | Pnc Financial Services Group, Inc. | 12 | 71,43 | 0 | |||||
| 2026-02-17 | 13F | Man Group plc | 63.394 | 13,21 | 471 | 23,95 | ||||
| 2026-02-17 | 13F | Qube Research & Technologies Ltd | 253.612 | -13,12 | 1.884 | -4,94 | ||||
| 2026-04-07 | 13F/A | Round Rock Advisors, LLC | 69.292 | 75,02 | 515 | 90,37 | ||||
| 2025-11-14 | 13F | XTX Topco Ltd | 0 | -100,00 | 0 | -100,00 | ||||
| 2026-04-21 | 13F | Penbrook Management LLC | 272.398 | 0,31 | 2.509 | 24,34 | ||||
| 2026-02-06 | 13F | Gsa Capital Partners Llp | 142.449 | -14,54 | 1 | 0,00 | ||||
| 2026-02-17 | 13F | MIRAE ASSET GLOBAL ETFS HOLDINGS Ltd. | 15.906 | -4,06 | 118 | 5,36 | ||||
| 2026-02-12 | 13F | Jane Street Group, Llc | 103.904 | -4,48 | 772 | 4,61 | ||||
| 2026-02-17 | 13F | Jones Financial Companies Lllp | 500 | 0,00 | 4 | 0,00 | ||||
| 2026-02-17 | 13F | Blair William & Co/il | 23.000 | 0,00 | 171 | 8,97 | ||||
| 2026-02-18 | 13F | GWM Advisors LLC | 23.459 | 174 | ||||||
| 2026-02-05 | 13F | Stoneridge Investment Partners Llc | 17.512 | 31,06 | 0 | |||||
| 2026-03-06 | 13F | Hsbc Holdings Plc | 103.569 | -9,87 | 770 | -0,39 | ||||
| 2025-11-14 | 13F | Virtus ETF Advisers LLC | 0 | -100,00 | 0 | -100,00 | ||||
| 2026-01-27 | 13F | WealthCollab, LLC | 1.140 | 8 | ||||||
| 2026-02-13 | 13F | Bard Associates Inc | 339.344 | -0,48 | 2.521 | 8,90 |